. 2025 Jan 2;16(1):67.
doi: 10.1038/s41467-024-55444-y.

E4F1 coordinates pyruvate metabolism and the activity of the elongator complex to ensure translation fidelity during brain development

Affiliations

E4F1 coordinates pyruvate metabolism and the activity of the elongator complex to ensure translation fidelity during brain development

Michela Di Michele et al. Nat Commun. .

Abstract

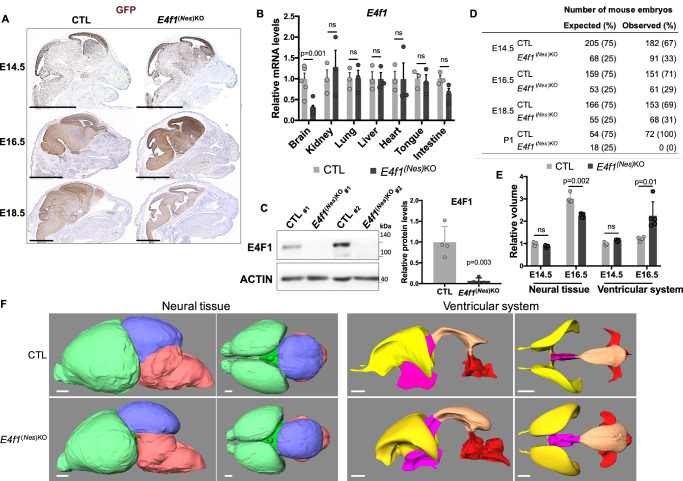
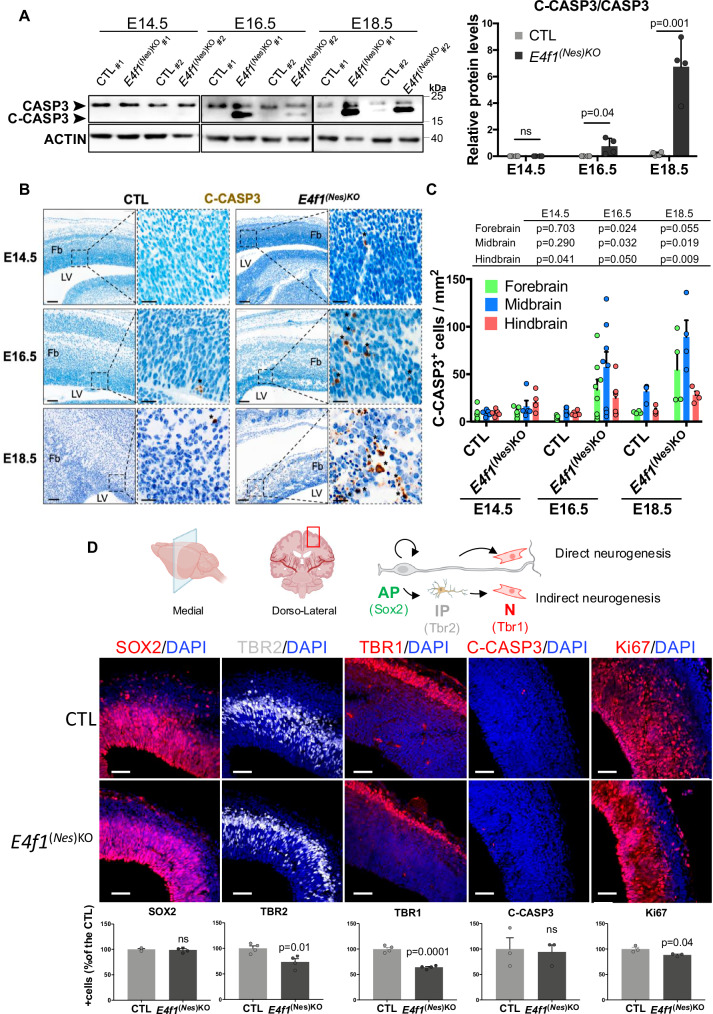
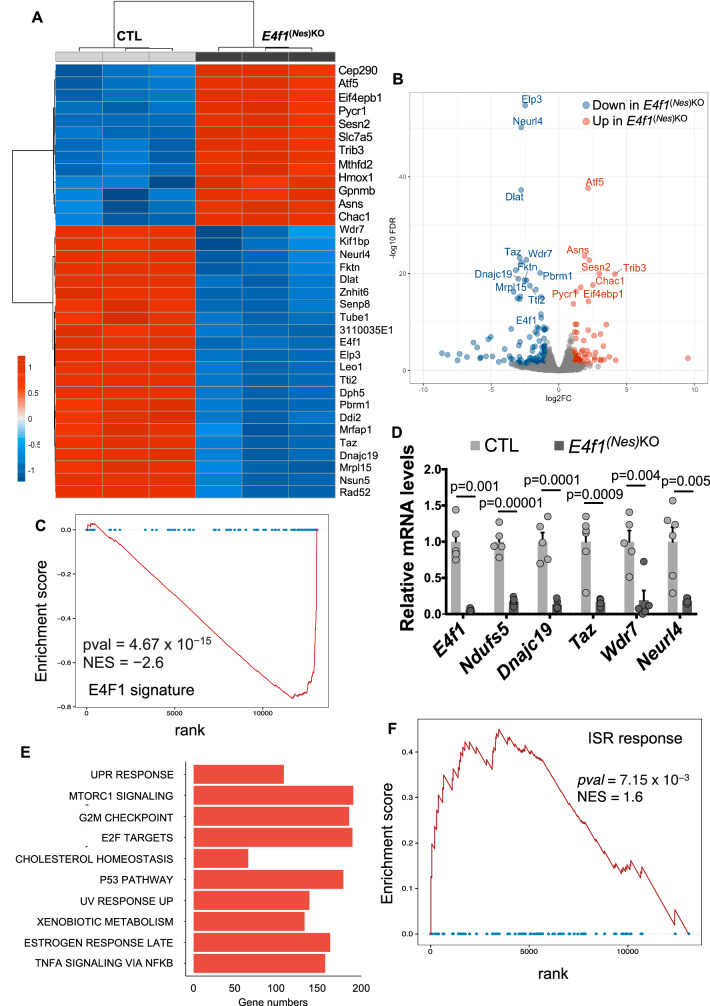
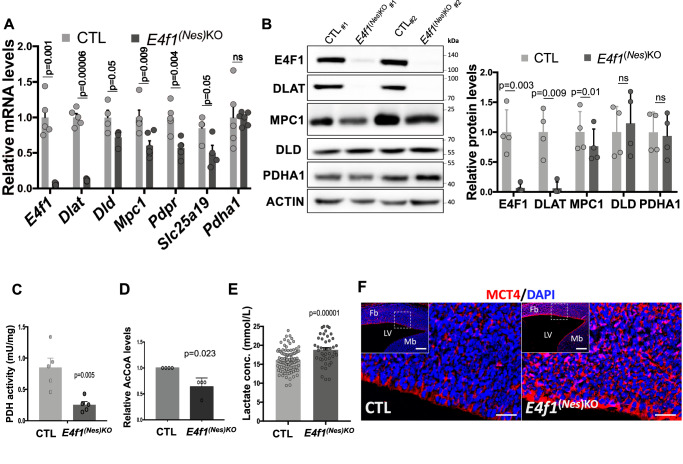
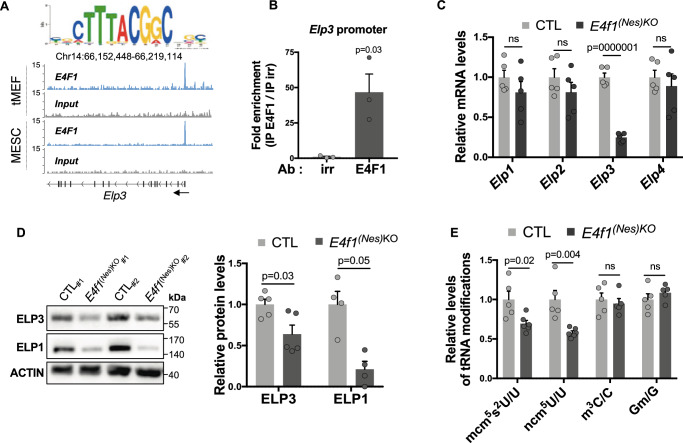
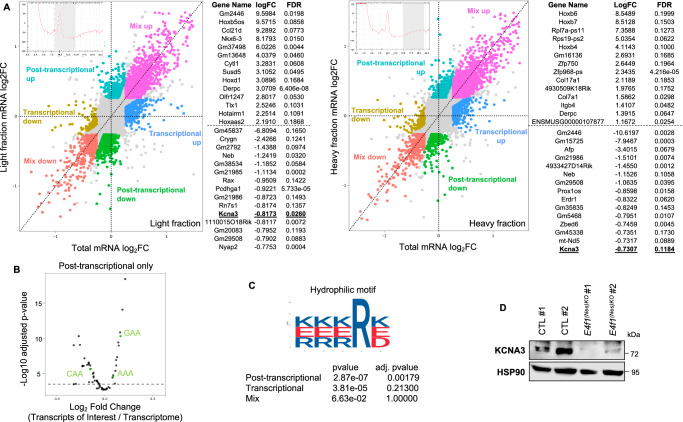
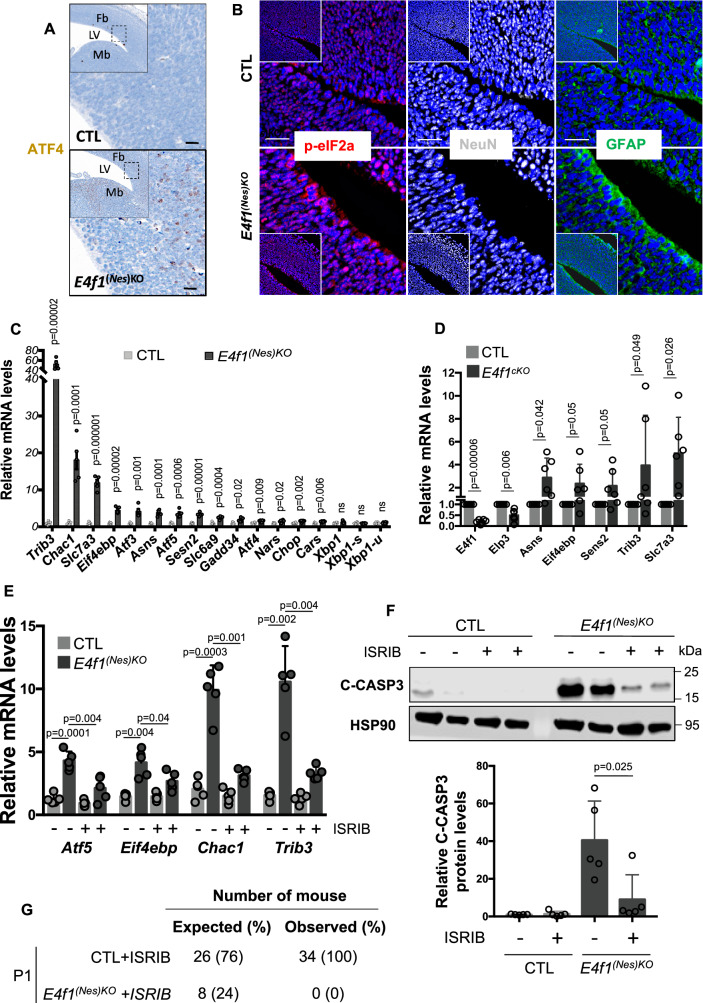
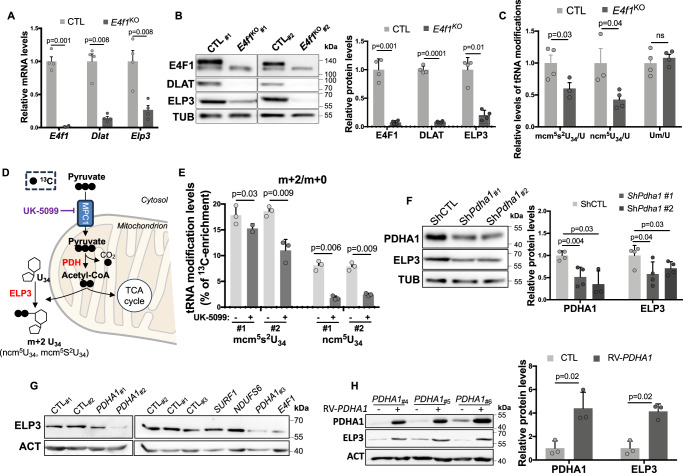
Pyruvate metabolism defects lead to severe neuropathies such as the Leigh syndrome (LS) but the molecular mechanisms underlying neuronal cell death remain poorly understood. Here, we unravel a connection between pyruvate metabolism and the regulation of the epitranscriptome that plays an essential role during brain development. Using genetically engineered mouse model and primary neuronal cells, we identify the transcription factor E4F1 as a key coordinator of AcetylCoenzyme A (AcCoA) production by the pyruvate dehydrogenase complex (PDC) and its utilization as an essential co-factor by the Elongator complex to acetylate tRNAs at the wobble position uridine 34 (U34). E4F1-mediated direct transcriptional regulation of Dlat and Elp3, two genes encoding key subunits of the PDC and of the Elongator complex, respectively, ensures proper translation fidelity and cell survival in the central nervous system (CNS) during mouse embryonic development. Furthermore, analysis of PDH-deficient cells highlight a crosstalk linking the PDC to ELP3 expression that is perturbed in LS patients.


Conflict of interest statement

Competing interests: The authors declare no competing interests.

Figures

Fig. 1
Fig. 1. E4F1 plays a critical role in corticogenesis during mouse embryonic development.
A Immunohistochemistry (IHC) analysis of GFP expression on brain sagittal sections prepared from E14.5, E16.5 and E18.5 E4f1(Nes)KO and CTL littermates. Scale bars, 2.5 mm. Images are representative of experiments performed on n = 4 animals/group. B RT-qPCR analysis of E4f1 mRNA levels in the indicated tissues in E18.5 E4f1(Nes)KO and CTL embryos (n = 6 for brain samples and n = 3 for other tissues). C Immunoblot analysis of E4F1 and ACTIN protein levels in the brain of E14.5 E4f1(Nes)KO and CTL embryos. Histobars represent the quantification of n = 4 immunoblots performed on independent samples for each genotype. D Numbers of E4f1(Nes)KO and CTL embryos identified at different developmental stages. Expected numbers were calculated based on a Mendelian distribution. E, F Analysis of brain structures in E14.5 and E16.5 E4f1(Nes)KO embryos by High Resolution Episcopic Microscopy (HREM). E Histobars represent the relative volume of the neuroepithelium tissue and of brain ventricles of E4f1(Nes)KO and CTL embryos at E14.5 (n = 3) and E16.5 (n = 3 for CTL and n = 5 for E4f1(Nes)KO). F Representative HREM images showing the 3D volumic reconstruction of different areas of the brain (forebrain in green, midbrain in blue and hindbrain in red) and of ventricles (lateral ventricles in yellow, third ventricle in pink, mesencephalic vesicle in orange and fourth ventricle in red) of E16.5 E4f1(Nes)KO and CTL littermates (n ≥ 4). Scale bars, 280 μm. Data are presented as mean + standard error of the mean (SEM) for Fig. 1B or mean + standard deviation (SD) for Fig. 1C, E from the indicated number of animals. Statistical significance was evaluated using unpaired two-sided Student’s t-test (ns, not significant).
Fig. 2
Fig. 2. E4f1 inactivation impairs neuronal development during mid-corticogenesis.
A Left panels: immunoblot analysis of uncleaved and cleaved CASPASE 3 (CASP3 and C-CASP3, respectively) and ACTIN protein levels in the brain of E14.5, E16.5 and E18.5 E4f1(Nes)KO and CTL embryos. Histobars represent the quantification of immunoblot analyzes of the ratio C-CASP3/CASP3 protein levels in the brain of E4f1(Nes)KO and CTL embryos at the indicated developmental stage (n = 4 animals/group). B IHC analysis of C-CASP3 protein in brain sagittal sections prepared from E14.5, E16.5 and E18.5 E4f1(Nes)KO and CTL embryos. Insets show images at higher magnification of the forebrain neuroepithelium. Images are representative of experiments performed on n = 5 animals/group for E14.5, n = 6 CTL animals and n = 7 E4f1(Nes)KO animals for E16.5, and n = 4 CTL animals and n = 3 E4f1(Nes)KO animals for E18.5. Scale bars, 100 μm and 20 μm for the insets. Black stars point at C-CASP3 positive cells. Fb= forebrain; LV= lateral ventricule. C Histobars represent the number of C-CASP3 positive cells in different brain regions of E4f1(Nes)KO and CTL embryos at the indicated developmental stage (n = 5 animals/group for E14.5, n = 6 CTL animals and n = 7 E4f1(Nes)KO animals for E16.5, and n = 4 CTL animals and n = 3 E4f1(Nes)KO animals for E18.5). D Upper panel: schematic representation of embryonic neurogenesis and of the dorso-lateral region of the medial plane used to determine the relative numbers of the different neuronal progenitors and their respective proliferation and survival rates by immunofluorescence (BioRender Created in BioRender. David, A. (2025) https://BioRender.com/s82s985; NIAID Visual & Medical Arts. 30/08/2024. Pyramidal Neuron. NIAID NIH BIOART Source. bioart.niaid.nih.gov/bioart/424; NIAID Visual & Medical Arts. 16/09/2024. Fibroblast. NIAID NIH BIOART Source. bioart.niaid.nih.gov/bioart/152; NIAID Visual & Medical Arts. 29/08/2024. Outer Radial Glial Cell. NIAID NIH BIOART Source. bioart.niaid.nih.gov/bioart/400). The different protein markers used to distinguish apical and intermediate progenitors and neurons are indicated. Lower panel: immunofluorescence (IF) analysis of SOX2, TBR2, TBR1, C-CASP3 and Ki67 protein levels in brain coronal sections prepared from E14.5 E4f1(Nes)KO and CTL embryos. Scale bars, 50 μm. Histobars represent the number of positive cells for the indicated protein marker expressed as % of the control (n = 4 for SOX2, TBR1, TBR2 analysis, and n = 3 for C-CASP3, Ki67 analysis). Data are presented as mean + standard deviation (SD) for Fig. 2A or mean + standard error of mean (SEM) for Fig. 2C, D from the indicated number of animals. Statistical significance was evaluated using unpaired two-sided Student’s t-test (ns, not significant).
Fig. 3
Fig. 3. Gene expression profile of E4F1-deficient neurons.
A,B RNA-seq analysis of brains prepared from E14.5, E4f1(Nes)KO and CTL embryos (n = 3 for each genotype). A Heatmap representing the relative mRNA levels (fold change, log2 ratio) of the differentially expressed genes (DEG) with the most statistically significant False Discovery Rate (likelihood ratio tests (LRT) - FDR-adjusted p-values). B Volcano plot depicting the significance (FDR) and magnitude of difference (fold change, log2 ratio) of DEG identified in E14.5 E4f1(Nes)KO embryos. C Gene set enrichment analysis (GSEA) of RNA-seq data showing decreased expression of E4F1 target genes. The normalized enrichment score (NES) and false discovery rate (FDR) are indicated. P-values were corrected using Benjamini–Hochberg’ FDR. D RT-qPCR analysis of E4f1 mRNA levels and those of a subset of its direct target genes (Ndufs5, Dnajc19, Taz, Wdr7, Neurl4) in total RNAs prepared from the forebrain of E14.5 E4f1(Nes)KO and CTL embryos (n = 5). Data are presented as mean + standard error of the mean (SEM) for the indicated number of animals. Statistical significance was evaluated using unpaired two-sided Student’s t-test. E List of the top 10 pathways identified by pathway enrichment analysis (PEA) as differentially modulated in E14.5 E4f1(Nes)KO embryos. The size of the histobars represents the number of genes in the indicated category with an FDR ≤ 0,001. F GSEA showing the induction of the Integrated Stress Response (ISR) signature in E14.5 E4f1(Nes)KO embryos. P-values were corrected using Benjamini–Hochberg’ FDR.
Fig. 4
Fig. 4. E4F1 regulates pyruvate metabolism in the CNS.
A RT-qPCR analysis of E4f1 mRNA levels and those of genes encoding key subunits or regulators of the pyruvate dehydrogenase complex (PDC) (Dlat, Dld, Mpc1, Pdpr, Slc25a19 and Pdha1) in the forebrain of E14.5 E4f1(Nes)KO and CTL embryos (a minimum of n = 4 animals/group was used to perform these analysis). B Representative immunoblots showing E4F1, DLAT, MPC1, DLD, PDHA1, and ACTIN (loading control) protein levels in the brain of E14.5 E4f1(Nes)KO and CTL embryos. Right panel: Histobars represent the quantification of immunoblots performed on n = 4 independent samples/group. C Pyruvate Dehydrogenase (PDH) activity in protein extracts prepared from E18.5 E4f1(Nes)KO and CTL embryos (n = 5 animals/group). D Relative AcetylCoenzyme A (AcCoA) levels in brain from E18.5 E4f1(Nes)KO and CTL embryos measured by HR-MS (n = 4 animals). E Blood lactate levels in E18.5 E4f1(Nes)KO (n = 43) and CTL (n = 99) embryos. F IF analysis of MCT4 protein levels in brain sagittal sections prepared from E14.5 E4f1(Nes)KO and CTL embryos (n = 5 animals/group). Fb= forebrain; Mb= middle brain; LV= lateral ventricule. Scale bars, 50 μm. Data are presented as mean + standard error of mean (SEM) for Fig. 4A, C or mean + standard deviation (SD) for Fig. 4B, D, E from the indicated number of animals. Statistical significance was evaluated using unpaired two-sided Student’s t-test (ns, not significant).
Fig. 5
Fig. 5. E4f1 controls the expression and activity of the Elongator complex.
A E4F1 ChIP-seq read densities in transformed MEFs (tMEFs) and mouse ES cells (MESC) at the Elp3 locus. The sequence and the position of the E4F1 consensus motif in the Elp3 locus are indicated. Arrows indicate gene orientation. B Quantitative ChIP (qChIP) experiments on the Elp3 promoter region using an anti-E4F1 polyclonal antibody (E4F1) or an irrelevant antibody (irr) and chromatin prepared from neuronal N2A cells (n = 3 independent experiments). Results are represented as the relative ratio between the mean value of immunoprecipitated chromatin (calculated as a percentage of the input) with the anti-E4F1 antibody and the one obtained with the control antibody. C RT-qPCR analysis of Elp1, Elp2, Elp3, and Elp4 mRNA levels in total RNAs prepared from the brain of E14.5 E4f1(Nes)KO and CTL embryos (n = 5 animals/group). D Immunoblot analysis showing ELP1, ELP3 and ACTIN (loading control) protein levels in the brain of E14.5 E4f1(Nes)KO and CTL embryos. Right panel: histobars represent the quantification of immunoblots performed on n = 4 and n = 5 independent samples for ELP1 and ELP3 respectively. E Liquid-chromatography coupled to tandem mass spectrometry (LC-MS/MS) analysis of the 5-carbamoylmethyl uridine (ncm5U34), 5-methoxy-carbonyl-methyl-2-thio uridine (mcm5s2U34), methyl-3-cytosine (m3C) and methylguanosine (Gm) tRNAs modifications, normalized to the total amount of Uridine (U), Cytosine (C) or Guanosine (G) (n = 5 independent samples/group). Data are presented as mean + standard error of the mean (SEM) from the indicated number of samples. Statistical significance was evaluated using unpaired two-sided Student’s t-test (ns, not significant).
Fig. 6
Fig. 6. E4F1 regulates U34 codon-biased translation in the CNS.
A Polysome profiling analysis of brains of E14.5 E4f1(Nes)KO and CTL embryos (n = 5 animals/group). Dot plots represent transcript levels (Log2 fold change) between E4f1(Nes)KO and CTL embryos in the pooled light (less then 3 ribosomes, left panel) or heavy (more than 3 ribosomes, right panel) polysomal fractions, according to their abundance in the total cytosolic fraction. The lists indicate the 16 genes which transcript abundance is the most deregulated (log2FC) in either the light or the heavy polysomal fractions prepared from E4F1-deficient brains but showing similar total transcript levels. B Codon enrichment in transcripts regulated at the post-transcriptional level in the brain of E14.5 E4f1(Nes)KO and CTL embryos. U34-linked codons are indicated in green. Codon enrichment was assessed by χ2 tests. C Bioinformatic analysis showing that 12% of the proteins (282 out of 2288) corresponding to genes regulated at the post-transcriptional level in the brain of E14.5 E4f1(Nes)KO embryos contain at least one penta-hydrophilic amino-acid sequence previously linked to protein aggregation and degradation upon U34 codon-dependent translation defects. Presence of the penta-hydrophilic sequence was determined by AME (Analysis of Motif Enrichment). D Immunoblot analysis showing KCNA3 and HSP90 (loading control) protein levels in the brain of E14.5 E4f1(Nes)KO and CTL embryos. Immunoblot is representative of 3 independent experiments.
Fig. 7
Fig. 7. E4F1 deficiency triggers the ISR that leads to neuronal cell death.
A IHC analysis of ATF4 protein levels in brain sagittal sections prepared from E14.5 E4f1(Nes)KO and CTL embryos. Data are representative of n = 4 independent experiments. Scale bars, 100 μm. B Immunofluorescence (IF) analysis of phospho-eIF2a (p-eIF2a), NeuN and GFAP protein levels in brain sagittal sections prepared from E14.5 E4f1(Nes)KO and CTL embryos. Data are representative of n = 4 independent experiments. Scale bars, 50 μm. C Relative mRNA levels of genes related to the ISR response in the forebrain of E14.5 E4f1(Nes)KO and CTL embryos determined by RT-qPCR (n = 5 independent samples/group). D Relative mRNA levels of genes related to the ISR response in populations of E4f1cKO and CTL primary neurons and glial cells determined by RT-qPCR, 10 days after E4f1 inactivation in vitro (n = 6 independent populations of cells/group). E Relative mRNA levels of genes related to the ISR response in the brain of mock or ISRIB -treated E14.5 E4f1(Nes)KO and CTL embryos determined by RT-qPCR (n = 5 independent samples/group). F Upper panel: immunoblot analysis showing Cleaved-Caspase-3 (C-CASP3) and TUBULIN (loading control) protein levels in the brain of mock or ISRIB -treated E16.5 E4f1(Nes)KO and CTL embryos. Lower panel: histobars represent the quantification of immunoblots performed on n = 5 independent samples/group. G Numbers of ISRIB-treated E4f1(Nes)KO and CTL embryos identified at birth (P1). Expected numbers were calculated based on a normal mendelian distribution. Data are presented as mean + standard error of the mean (SEM) for Fig. 7C or mean + standard deviation (SD) for Fig. 7DF from the indicated number of samples. Statistical significance was evaluated using unpaired two-sided Student’s t-test (ns, not significant).
Fig. 8
Fig. 8. E4F1 coordinates AcCoA production by the PDC and its utilization by the Elongator complex to ensure U34 tRNAs acetylation.
A RT-qPCR analysis of E4f1, Dlat and Elp3 mRNA levels in E4f1cKO and CTL MEFs (n = 4 independent populations of MEFs/group), 7 days after activation of the Cre recombinase. B Left panel: immunoblot analysis of E4F1, DLAT, ELP3 and TUBULIN protein levels in the same cells than in A. Right panel: histobars represent the quantification of immunoblots performed on independent samples (n = 4 populations/group). C LC-MS/MS analysis of ncm5U34, mcm5s2U34 and Um in tRNAs purified from the same cells than in A and normalized to the total amount of Uridine (U) (n = 4 independent populations of MEFs/group). D Schematic representation of pyruvate contribution to U34 tRNAs modifications when cells are incubated with uniformly labeled [U-13C]-pyruvate (NIAID Visual & Medical Arts. 29/08/2024. Mitochondria. NIAID NIH BIOART Source. bioart.niaid.nih.gov/bioart/352). E Stable isotope tracing experiments in MEFs incubated with DMSO or the MPC1 inhibitor UK-5099 and cultured in the presence of [U-13C]-pyruvate. 13C-enrichment in ncm5U34 and mcm5s2U34 was determined by LC-MS/MS in two independent experiments performed in triplicates. Data are represented as the relative ratio between the 13C-labeled m + 2 isotopologue and the corresponding unlabeled U34 modification. F Immunoblot analysis of PDHA1, ELP3 and TUBULIN protein levels in MEFs transduced with control or Pdha1 shRNAs lentiviruses (shPdha1 #1 and #2). Right panel: histobars represent the quantification of immunoblots performed on n = 4 independent samples. G Immunoblot analysis of ELP3 and ACTIN protein levels in human skin fibroblasts isolated from Leigh Sydrome (LS) patients harboring mutations in the indicated genes or from age-matched healthy donors. Immunoblot was performed in 2 independent experiments. H Immunoblot analysis of PDHA1, ELP3 and ACTIN protein levels in human skin fibroblasts isolated from LS patients harboring mutations in the PDHA1 gene transducted with an empty control or a WT-PDHA1 encoding retrovirus. Right panel: histobars represent the quantification of immunoblots performed on cells isolated from n = 3 LS patients. Data are presented as mean + standard error of the mean (SEM) for Fig. 8A, C or mean + standard deviation (SD) for Fig. 8B, E, F and H from the indicated number of samples. Statistical significance was evaluated using unpaired two-sided Student’s t-test (ns, not significant).

References

    1. Goncalves, F. G. et al. Primary mitochondrial disorders of the pediatric central nervous system: neuroimaging findings. Radiographics40, 2042–2067 (2020). - PubMed
    1. Bakare, A. B., Lesnefsky, E. J. & Lyer, S. Leigh Syndrome: a tale of two genomes. Front Physiol.12, 693734 (2021). - PMC - PubMed
    1. Raychaudhuri, P. et al. Identification of an E1A-inducible cellular factor that interacts with regulatory sequences within the adenovirus E4 promoter. EMBO J.6, 4073–4081 (1987). - PMC - PubMed
    1. Le Cam, L. et al. E4F1 is an atypical ubiquitin ligase that modulates p53 effector functions independently of degradation. Cell127, 775–788 (2006). - PubMed
    1. Fajas, L. et al. Cyclin A is a mediator of p120E4F-dependent cell cycle arrest in G1. Mol. Cell. Biol.21, 2956–2966 (2001). - PMC - PubMed

Publication types

MeSH terms

Associated data