. 2025 Jan 2;16(1):242.
doi: 10.1038/s41467-024-55520-3.

Telomere-to-telomere DNA replication timing profiling using single-molecule sequencing with Nanotiming

Affiliations

Telomere-to-telomere DNA replication timing profiling using single-molecule sequencing with Nanotiming

Bertrand Theulot et al. Nat Commun. .

Abstract

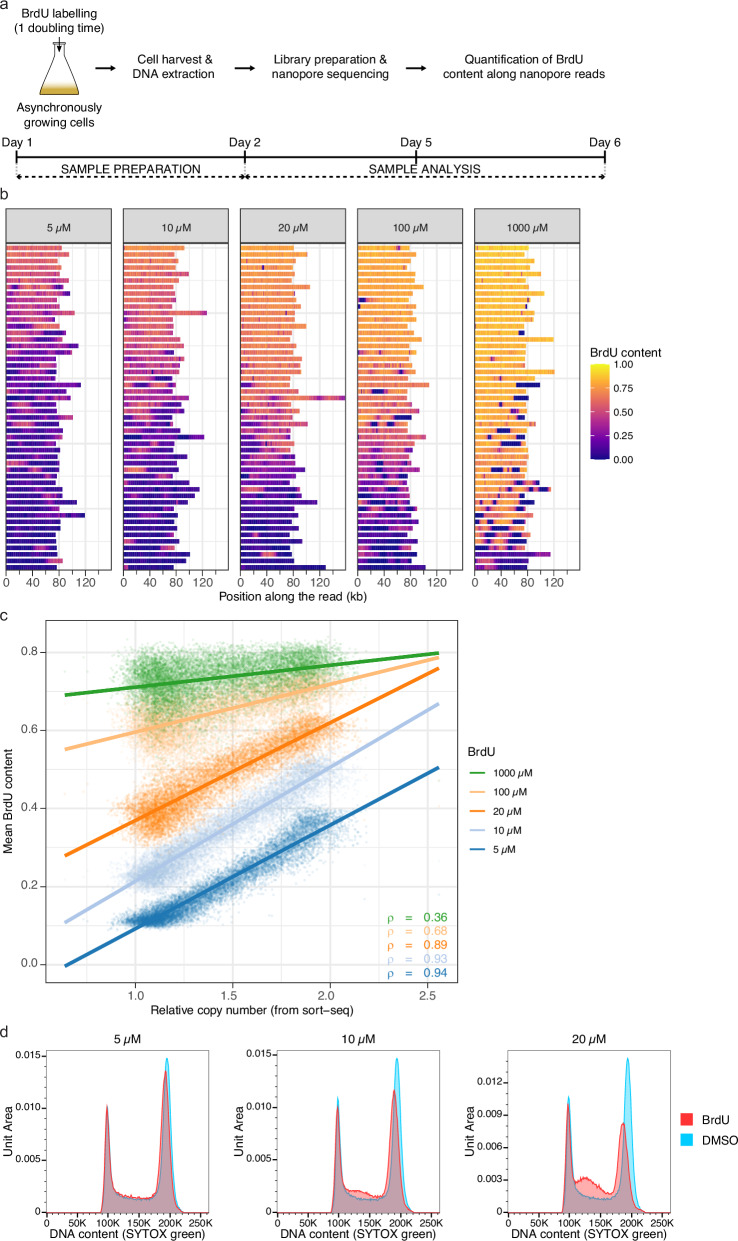
Current temporal studies of DNA replication are either low-resolution or require complex cell synchronisation and/or sorting procedures. Here we introduce Nanotiming, a single-molecule, nanopore sequencing-based method producing high-resolution, telomere-to-telomere replication timing (RT) profiles of eukaryotic genomes by interrogating changes in intracellular dTTP concentration during S phase through competition with its analogue bromodeoxyuridine triphosphate (BrdUTP) for incorporation into replicating DNA. This solely demands the labelling of asynchronously growing cells with an innocuous dose of BrdU during one doubling time followed by BrdU quantification along nanopore reads. We demonstrate in S. cerevisiae model eukaryote that Nanotiming reproduces RT profiles generated by reference methods both in wild-type and mutant cells inactivated for known RT determinants. Nanotiming is simple, accurate, inexpensive, amenable to large-scale analyses, and has the unique ability to access RT of individual telomeres, revealing that Rif1 iconic telomere regulator selectively delays replication of telomeres associated with specific subtelomeric elements.


Conflict of interest statement

Competing interests: The authors declare no competing interests.

Figures

Fig. 1
Fig. 1. Accessing S. cerevisiae genome RT by BrdU-mediated capture of dTTP pool expansion during S phase.
a Scheme of the protocol for BrdU labelling of replicating DNA in BT1 cells followed by BrdU quantification in nanopore reads of genomic DNA. The typical timeline is indicated. See text for BrdU concentrations used in this study. b BrdU content fluctuations along nanopore reads of genomic DNA from BT1 cells labelled for one doubling time with BrdU. The BrdU content in 1 kb bins along individual nanopore reads, corresponding to the fraction of the thymidine sites of these bins that incorporated a BrdU (i.e., to their BrdU/(BrdU+Thymidine) ratio), is represented as a 1D heatmap. Reads were randomly selected and are organised according to their median BrdU content (from top to bottom, median BrdU content from highest to lowest); BrdU-free reads (median BrdU content ≤ 0.02) corresponding to parental DNA were filtered out. The BrdU dose used for cell labelling is indicated on top of each panel. c Comparison between relative copy number established by sort-seq in 1 kb bins of BT1 genome and mean BrdU content in the cognate bins computed from nanopore reads of genomic DNA of cells labelled with the indicated BrdU dose for one doubling time. A linear regression model (coloured line) and Spearman’s rank correlation coefficient (ρ) between mean BrdU content and relative copy number are given for each labelling BrdU concentration. d Labelling of BT1 cells for one doubling time with 5 µM BrdU does not impact S phase progression. Representative analysis of BT1 cell cycle after exposure to DMSO or 5, 10, or 20 µM BrdU for one doubling time. DNA content was analysed by flow cytometry after DNA staining with SYTOX Green. The BrdU dose is indicated above each panel. This experiment was performed three times independently with similar results.
Fig. 2
Fig. 2. RT profiles of S. cerevisiae chromosome XII using Nanotiming.
a Mean BrdU content and sort-seq relative copy number profiles (reads of genomic DNA from BT1 cells). b Mean BrdU content and MFA-seq relative copy number profiles (data from BT1 cells and from ref. , respectively). cf Mean BrdU content profile in wild-type (wt) and ctf19∆ (c), rif1∆ (d), yku70∆ (e) and fkh1∆ (f) BT1 cells. g Mean BrdU content profiles from a multiplexed PromethION run with 24 barcoded samples of BT1 BrdU-labelled DNA; the corresponding sort-seq relative copy number profile is also shown. ag Mean BrdU content and relative copy number were computed in 1 kb bins; data were rescaled between 1 (end of S phase) and 2 (start of S phase) for comparison (see “Methods”). Mean BrdU content profiles were calculated using nanopore reads of genomic DNA from cells labelled with 5 µM BrdU for one doubling time; six and three biological replicates, corresponding to independent cell cultures, are presented in cf for wild-type and mutant BT1 cells, respectively; BT1 wt_rep1 mean BrdU content profile is shown in (a) and (b); the 24 samples in (g) originate from the same BT1 BrdU-labelled genomic DNA. Purple and green vertical lines, positions of confirmed S. cerevisiae replication origins and of centromeres, respectively; grey box, rDNA. BT1 assembly rDNA locus comprises 12 copies of the 9.1 kb rDNA repeat, with some discontinuities due to contig assembly and scaffolding issues (see Methods); please note that, although reads with “external” rDNA repeats flanked by sequences located upstream or downstream of the rDNA locus, allowing unambiguous mapping, contribute to the BrdU signal, most of the rDNA reads only contain repeats and are therefore randomly mapped on the 12 rDNA copies, giving rise to an average RT profile of the rDNA locus. RT, replication timing; rep, replicate.
Fig. 3
Fig. 3. Rif1 controls the late RT of S. cerevisiae XY’, but not X, telomeres.
a RT at individual telomeres in wild-type (wt) and rif1∆ BT1 cells. Dot, mean BrdU content in a given sample of either the first (for left (L) telomeres) or last (for right (R) telomeres) 1 kb bin of the cognate chromosome adjacent to the terminal telomeric repeats, with purple and green backgrounds distinguishing X and XY’ telomeres, respectively; box, 50% interval; thick horizontal line, median value; whiskers, extreme values. nwt = 6 mean BrdU content values from independent cell cultures, nrif1∆ = 3. b RT at X and XY’ telomeres in wt and rif1∆ cells. Half-eye plots aggregate values at individual telomeres presented in (a) according to their X/XY’ status. For X telomeres, nwt = 72 mean BrdU content values, nrif1∆ = 36; for XY’ telomeres, nwt = 120, nrif1∆ = 60. Black dot, median RT; thick and thin black vertical lines, 50% and 95% intervals, respectively. c, Mean BrdU content profiles over 50 kb of the left and right extremities of chromosomes (chr) XI-XV in wt and rif1∆ BT1 cells. Purple vertical lines, positions of confirmed S. cerevisiae replication origins; brown, pink, and olive boxes, TG1-3 repeats, subtelomeric X and Y’ elements, respectively. Purple and green backgrounds distinguish chromosome extremities with X and XY’ telomeres, respectively. Six and three biological replicates, corresponding to independent cell cultures, are presented for wt and rif1∆ BT1 cells, respectively. ac wt and rif1∆ samples are in red and blue colours, respectively. Mean BrdU content was computed in 1 kb bins from nanopore reads of genomic DNA of cells labelled with 5 µM BrdU for one doubling time and rescaled as in Fig. 2. RT, replication timing.
Fig. 4
Fig. 4. Analysis of the relationship between telomere length and RT at the single-telomere level in wild-type, rif1∆, yku70∆, ctf19∆, and fkh1∆ BT1 cells.
a Telomere length in the indicated strain. Half-eye plots show the distribution of individual telomeric repeat lengths measured using nanopore reads of genomic DNA from independent cell cultures of the corresponding strains. Telomere length was concurrently estimated in unlabelled BT1 cells (wt_noBrdU sample) to ascertain that BrdU incorporation has no impact on telomere length estimation. TEL13R length was not determined in the yku70∆ mutant due to a missing Y’ element at the right end of chromosome XIII compared to BT1 assembly, preventing proper read mapping and telomeric repeat length measurement. Black dot, median telomeric repeat length, value indicated in red on top; thick and thin black vertical lines, 50% and 95% intervals, respectively; bottom, number of individual telomeric repeat length measurements. bf, RT versus length of single telomeres plotted as a 2D density plot in the indicated strain for TEL07L/R, TEL08L/R, TEL09L/R, and TEL10L/R. Coefficient (ρ) and p-value of Spearman’s correlation test (two-sided) between telomeric repeat length and RT as well as the number of measurements (n) are indicated. Purple and green backgrounds distinguish X and XY’ telomeres, respectively. Mean BrdU content data were rescaled as in Fig. 2. RT, replication timing; rep, replicate; wt, wild-type.

References

    1. Vouzas, A. E. & Gilbert, D. M. Mammalian DNA replication timing. Cold Spring Harb. Perspect. Biol.13, a040162 (2021). - PMC - PubMed
    1. Rhind, N. DNA replication timing: biochemical mechanisms and biological significance. Bioessays44, e2200097 (2022). - PMC - PubMed
    1. Hulke, M. L., Massey, D. J. & Koren, A. Genomic methods for measuring DNA replication dynamics. Chromosome Res.28, 49–67 (2020). - PMC - PubMed
    1. Reynolds, A. E., McCarroll, R. M., Newlon, C. S. & Fangman, W. L. Time of replication of ARS elements along yeast chromosome III. Mol. Cell Biol.9, 4488–4494 (1989). - PMC - PubMed
    1. Cosgrove, A. J., Nieduszynski, C. A. & Donaldson, A. D. Ku complex controls the replication time of DNA in telomere regions. Genes Dev.16, 2485–2490 (2002). - PMC - PubMed

Publication types

MeSH terms

Associated data

LinkOut - more resources