. 2025 Jan 2;16(1):264.
doi: 10.1038/s41467-024-55574-3.

Enterocyte-like differentiation defines metabolic gene signatures of CMS3 colorectal cancers and provides therapeutic vulnerability

Affiliations

Enterocyte-like differentiation defines metabolic gene signatures of CMS3 colorectal cancers and provides therapeutic vulnerability

Arezo Torang et al. Nat Commun. .

Abstract

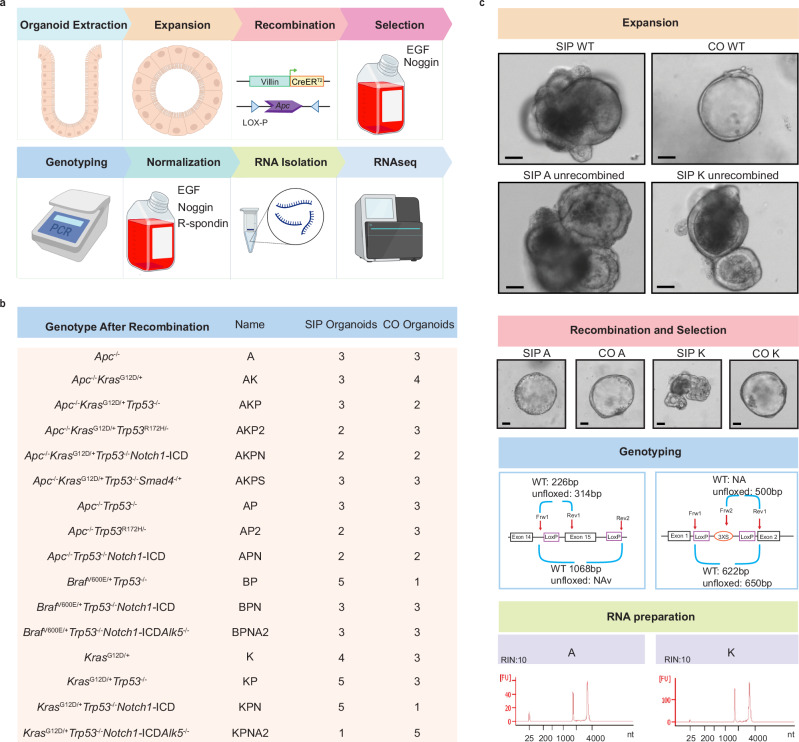
Colorectal cancer (CRC) is stratified into four consensus molecular subtypes (CMS1-4). CMS3 represents the metabolic subtype, but its wiring remains largely undefined. To identify the underlying tumorigenesis of CMS3, organoids derived from 16 genetically engineered mouse models are analyzed. Upon in vitro Cre-recombinase activation, transformation is established and transcriptional profiling reveals that distinct CMSs (CMS2-4) are modeled with different organoids. CMS3-like, metabolic signature-positive, organoids are induced by KRAS mutations. Interestingly, metabolic signatures are subsequently shown to result from enterocyte-like differentiation both in organoids and human cancers. Further analysis reveals carbamoyl-phosphate synthase 1 (CPS1) and sucrase-isomaltase (SI) as signature proteins. More importantly, CPS1 is crucial for de novo pyrimidine synthesis in CMS3 and its inhibition targets proliferation and stemness, facilitating enterocyte-like differentiation, while CMS2 and CMS4 models are not affected. Our data point to an enterocyte-like differentiation of CMS3 CRCs and reveal a selective vulnerability of this subtype through CPS1 inhibition.


Conflict of interest statement

Competing interests: The Authors declare no competing interests. Inclusion & ethics: Inclusion & ethics statement One or more of the authors of this paper self-identifies as an unrepresented ethnic minority in science. One or more of the authors of this paper self-identifies as a gender minority in their field of research. One or more of the authors of this paper self-identifies as a member of the LGBTQIA+ community.

Figures

Fig. 1
Fig. 1. Generation of in vitro recombined mouse models.
a Workflow protocol demonstrating the generation of samples from organoid extraction to RNA sequencing. Created in BioRender. Kirov, A. (2024) https://BioRender.com/y10l827 [https://BioRender.com/y10l827] (See also Supplementary Fig. 1 and Supplementary Fig. 2). b List of all genotypes after recombination and their corresponding nomenclatures. Total of 49 SIP and 44 CO samples were processed (See also Supplementary Table 1). c Expansion: the morphology of SIP wild-type (SIP WT) and of unrecombined Apcfl/fl (SIP A unrecombined), unrecombined KrasG12D/+ (SIP K unrecombined) and CO wild-type (CO WT). Recombination and Selection: the morphology and the change that occurs in SIP and CO APC-deleted or KRAS-mutant organoids after successful recombination of the cultures. Genotyping: protocol example for A and K with corresponding primer locations. RNA preparation: RNA quality measured by Bioanalyzer. Scale bar size for all figures is at 100 µm. Picture is representative of a minimum of three independent repeats.
Fig. 2
Fig. 2. Association of mutations with gene expression patterns.
a Principal component analysis (PCA) of proximal small intestine (SIP) transformed organoids with the indicated genotypes. A total of 80 independent RNA analyses of the 49 distinct organoids are presented. The size of circles represents the variation in RNA expression within the genotypes, defined by averaged standard error of first and second principal components. b PCA of colon (CO) transformed organoids with the indicated genotypes. A total of 68 independent RNA analyses of the 44 distinct organoids is presented. The size of circles represents the variation in RNA expression within the genotypes, defined by averaged standard error of first and second principal components (see Supplementary Table 1 and Supplementary Fig. 3). c Heatmap of top 1000 differentially expressed genes defined by inter quartile range in the mouse organoid panel (n = 148), colored with light blue for lower expression and orange for higher expression values normalized to z-scores. The top annotation table indicates the origin of samples and the presence of mutations. Genes and genotypes were clustered using complete linkage method. Source data are provided as a Source Data file for all panels.
Fig. 3
Fig. 3. CMS in mouse organoids.
a Heatmap of gene signatures of special interest (listed in Supplementary Table 2) in studying CMS subtypes shown for small intestine organoids (n = 80). The colors of left annotation link each signature to a CMS subtype, as described by Guinney et al. to be explicitly enriched in that CMS. The top annotation indicates the identified CMS labels of each genotype, where gray means unstratified (See also Supplementary Table 3 and Supplementary Fig. 5). b Classification of all mouse organoids using the newly developed mouse classifier. Circle size indicates the number of samples and the color with a gradient from white (0%) to dark blue (100%) shows the percentage of samples in each genotype. Small intestine (SIP) organoids, n = 80; Colon (CO) organoids, n = 68 (See also Supplementary Table 4). c Gene set enrichment results of stratified organoids. Small intestine (SIP) organoids, n = 80; Colon (CO) organoids two-sided permutation testing was conducted to assess the significance of enrichments; n = 61. ns: p > 0.05, *p < 0.05, **p < 0.01, ***p < 0.001, ****p < 0.0001. Source data are provided as a Source Data file for all panels.
Fig. 4
Fig. 4. Enterocytes define metabolism of CMS3.
a Gene set enrichment analysis (GSEA) of CMS stratified organoids for signatures of cell types in small intestine of mice developed by Haber et al.. Each model was compared to A organoids and genes were ranked by logFCs. Circle size indicates the significance defined by p value and color intensity shows the normalized enrichment scores (NES), with shades of dark blue for negative enrichment and red for positive enrichment; two-sided permutation testing was conducted to assess the significance of enrichments. EC (enterocytes), EMP (enterocyte mature proximal), EMD (enterocyte mature distal), EPL (enterocyte progenitor late), EEC (enteroendocrine cells), P (Paneth), S (stem cells), T (Tuft), G (Goblet cells). See also Supplementary Data 1. b GSEA of human colon cell types for metabolic signatures of interest in CMS3. Each cell type was compared to the rest and genes were ranked by logFC values. Circle size indicates the significance defined by p value and color intensity shows the normalized enrichment scores (NES), with shades of dark blue for negative enrichment and red for positive enrichment; two-sided permutation testing was conducted to assess the significance of enrichments. S (stem cells), TA (transint-amplifying cells), EEC (enteroendocrine cells), P-like (Paneth-like cells), G (Goblet cells), EC (enterocytes). c GSEA of CMS3 vs CMS1, CMS2, and CMS4 in human CRC tumours for enterocyte-related signatures; two-sided permutation testing was conducted to assess the significance of enrichments; ns: p > 0.05, *p < 0.05, **p < 0.01, ***p < 0.001, ****p < 0.0001. See also Supplementary Table 5. d Correlation plot of enterocyte and metabolic scores calculated for human CRCs and colored by CMS color code. Density plots for each subtype were added. Two-sided t-test was performed to assess the significance of Pearson correlation; R2: Pearson correlation coefficient; df: degree of freedom; t: t-value; ns: p > 0.05, *p < 0.05, **p < 0.01, ***p < 0.001, ****p < 0.0001. Source data are provided as a Source Data file for all panels.
Fig. 5
Fig. 5. SI/SIS and CPS1 expression in human and mouse tissues, organoids and cancers.
a Immunohistochemistry of mouse samples from WT mouse small intestine and colon tissue samples, from WT SIP organoids and from KRAS-mutant and APC-deficient SIP organoids stained with CPS1 (left) and SIS (right) antibodies at 1:1000 concentration. Picture are representative of a minimum of three independent biological replicates. b Boxplots of proteomic levels of CPS1 (left) and SI (right) in tumour samples of 37 patients from the AMC-AJCCII-90 dataset split over the 4 CMS subtypes. One-way ANOVA test was performed to assess the significance of the mean differences between groups; df: degree of freedom; F: F-value; ns: p > 0.05, *p < 0.05, **p < 0.01, ***p < 0.001, ****p < 0.0001, center lines show median and box limits are first and third quartiles, whiskers represent data within 1.5 times the interquartile range (IQR) from the first quartile and the third quartile; outliers are defined as points outside 1.5 x IQR. Source data are provided as a Source Data file. c Immunohistochemistry of human normal colon, and tissue microarray cores of patient AMC54 (CMS3) and AMC15 (CMS2) for CPS1 (left) and SI (right). Inset shows blow up of the figures. Scale bars are as indicated. Picture is representative of a minimum of three independent repeats. d 15NH4Cl tracing with 10 mM added to the medium performed for 2 hours in either CMS2 cells (HT-55) or CMS3 cells (SW1463). Data represented as fractional increase in 15N-containing UMP related to untraced control (n = 3). Two-sided t-test was performed to assess the significance of the mean differences; ns: p > 0.05, *p < 0.05, **p < 0.01, ***p < 0.001, ****p < 0.0001. Bars represent mean values of a technical triplicate with error bars indicating standard deviation. Source data are provided as a Source Data file.
Fig. 6
Fig. 6. Murine CMS3, enterocyte-like organoids show selective drug sensitivity.
a Imaging of APC-deficient and KRAS-mutant organoids with EVOS FL Cell Imaging System (Thermo Scientific) (right) and barplots of organoid counting of APC-deficient and KRAS-mutant organoids untreated and treated with CPS1 inhibitor (H3B-120 at 50 µM) Counts shown are from a technical triplicate per condition and is representative for 3 independent experiments with similar outcome. (left); two-sided t-test was performed to assess the significance of the mean differences; ns: p > 0.05, *p < 0.05, **p < 0.01, ***p < 0.001, ****p < 0.0001. Scale bar is at 500 μm. b SsGSEA of the indicated CRC cell lines with a total of 6 enterocyte-related gene signatures derived from MsigDB. Purple indicates positive association. c Toxicity analysis in DMEM/F12 (1.5 µM thymidine) using Cell Titer Blue staining of LS513 cells treated for 84 hours with increasing doses of H3B-120; n = 3 in each treatment dose. Each point represents the mean value of replicates at the corresponding dose, with error bars indicating the standard deviation. d Toxicity analysis in DMEM/F12 (1.5 µM thymidine) using Cell Titer Blue staining of CMS3 lines LS513 (n = 3), SW1463 (n = 3), CMS2 line HT-55 (n = 3) and CMS4 line OUMS23 (n = 3) treated for 72 hours with increasing doses of Bay-2402234. Each point represents the mean value of replicates at the corresponding dose, with error bars indicating the standard deviation. e Treatment of LS513 cells for 84 hours with 25 μM H3B-120, 1.5 μM 5-FU or both. Cell viability was tested with Cell Titer Blue and related to control treatment; n = 4 biological replicates in each treatment group. Bars represent mean values with error bars indicating standard deviation. f Immunohistochemistry of KRAS-mutant mouse organoids treated with or without 50 μM H3B-120 for 84 hours. Samples were stained for CPS1, KI67, OLFM4 and SIS. Scale bar is at 50 μm. Picture are representative of a minimum of three independent biological repeats. Source data are provided as a Source Data file for panels (a, b, c, d, and e).

References

    1. Siegel, R. L., Miller, K. D., Fuchs, H. E. & Jemal, A. Cancer statistics, 2022. Ca. Cancer J. Clin.72, 7–33 (2022). - PubMed
    1. Guinney, J. et al. The consensus molecular subtypes of colorectal cancer. Nat. Med.21, 1350–1356 (2015). - PMC - PubMed
    1. Isella, C. et al. Selective analysis of cancer-cell intrinsic transcriptional traits defines novel clinically relevant subtypes of colorectal cancer. Nat. Commun.8, 1–16 (2017). - PMC - PubMed
    1. Asif, P. J., Longobardi, C., Hahne, M. & Medema, J. P. The role of cancer‐associated fibroblasts in cancer invasion and metastasis. Cancers (Basel).13, 1–18 (2021). - PMC - PubMed
    1. Lyssiotis, C. A. & Kimmelman, A. C. Metabolic interactions in the tumor microenvironment. Trends Cell Biol.27, 863–875 (2017). - PMC - PubMed

Publication types

MeSH terms