. 2025 Jan 2;16(1):95.
doi: 10.1038/s41467-024-55448-8.

diaTracer enables spectrum-centric analysis of diaPASEF proteomics data

Affiliations

diaTracer enables spectrum-centric analysis of diaPASEF proteomics data

Kai Li et al. Nat Commun. .

Abstract

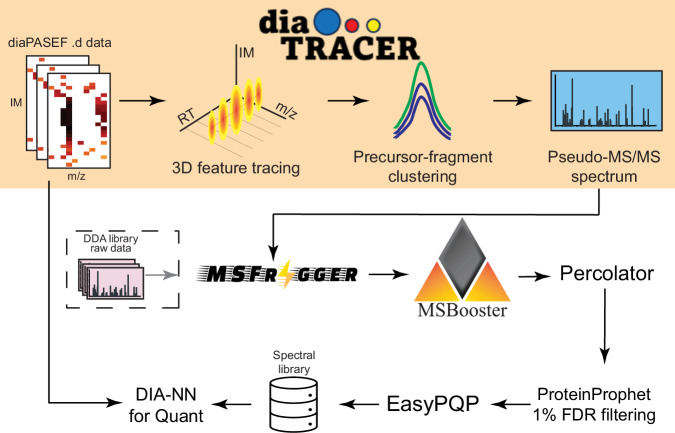
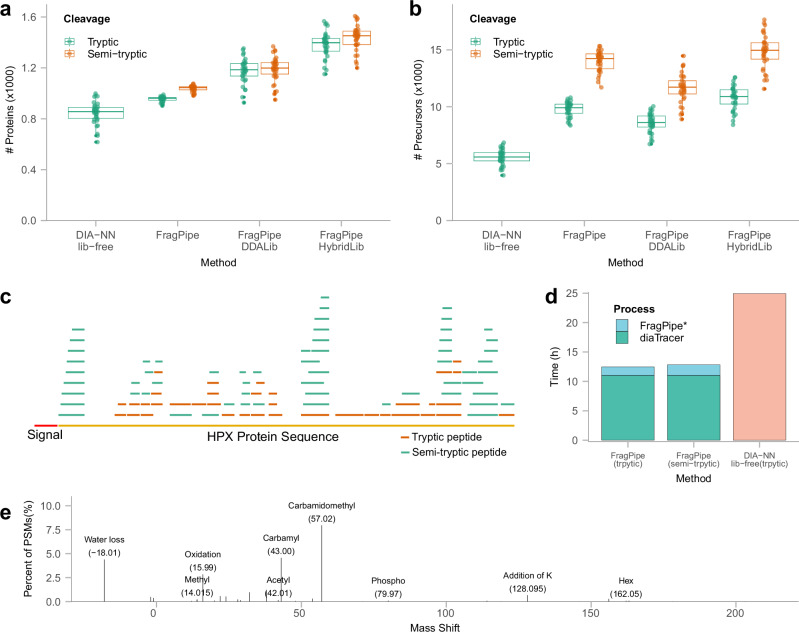
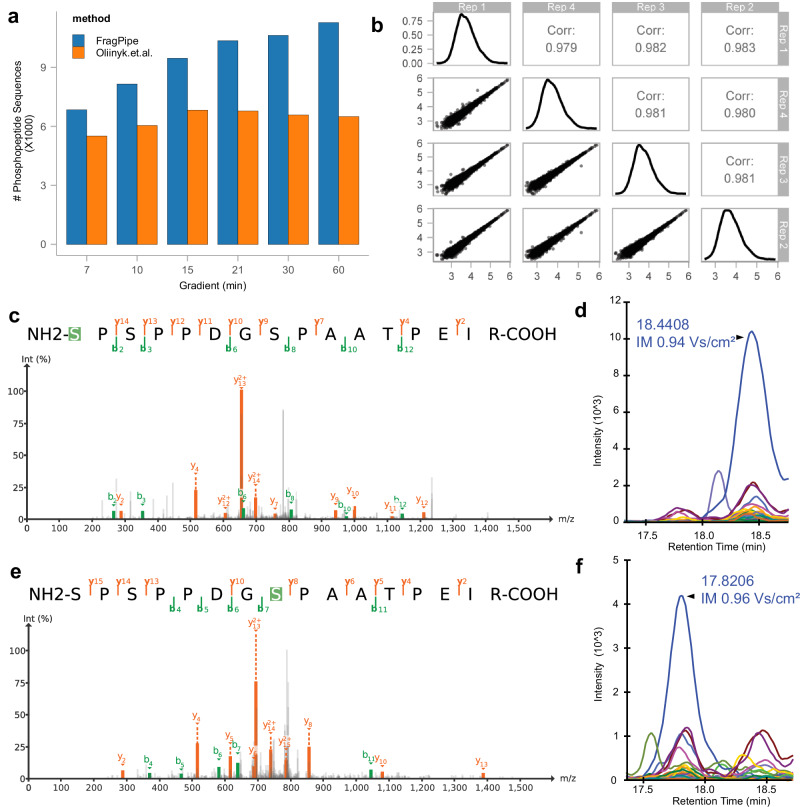
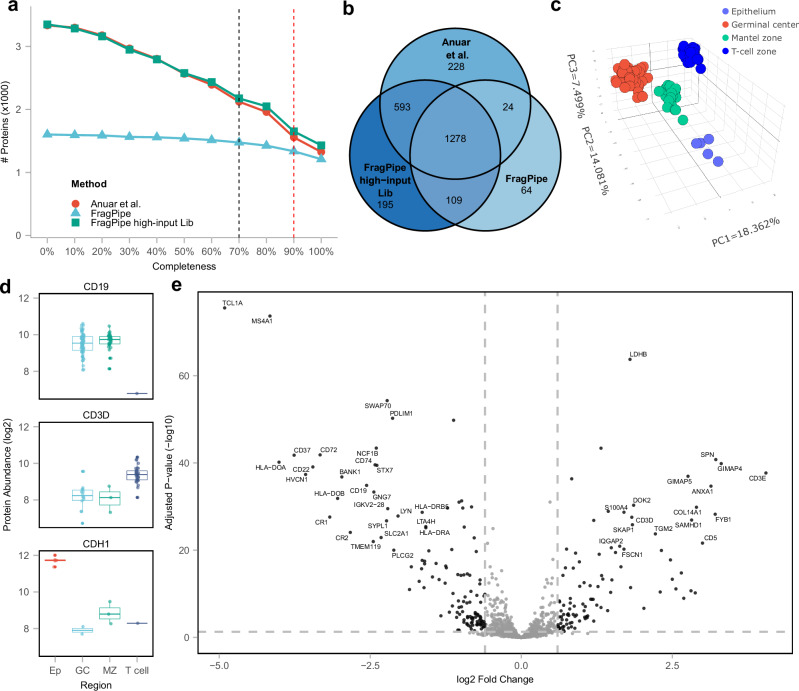
Data-independent acquisition has become a widely used strategy for peptide and protein quantification in liquid chromatography-tandem mass spectrometry-based proteomics studies. The integration of ion mobility separation into data-independent acquisition analysis, such as the diaPASEF technology available on Bruker's timsTOF platform, further improves the quantification accuracy and protein depth achievable using data-independent acquisition. We introduce diaTracer, a spectrum-centric computational tool optimized for diaPASEF data. diaTracer performs three-dimensional (mass to charge ratio, retention time, ion mobility) peak tracing and feature detection to generate precursor-resolved "pseudo-tandem mass spectra", facilitating direct ("spectral-library free") peptide identification and quantification from diaPASEF data. diaTracer is available as a stand-alone tool and is fully integrated into the widely used FragPipe computational platform. We demonstrate the performance of diaTracer and FragPipe using diaPASEF data from triple-negative breast cancer, cerebrospinal fluid, and plasma samples, data from phosphoproteomics and human leukocyte antigens immunopeptidomics experiments, and low-input data from a spatial proteomics study. We also show that diaTracer enables unrestricted identification of post-translational modifications from diaPASEF data using open/mass-offset searches.


Conflict of interest statement

Competing interests: A.I.N. and F.Y. receive royalties from the University of Michigan for the sale of MSFragger, IonQuant, and diaTracer software licenses to commercial entities. K.L. receives royalties from the University of Michigan for the sale of diaTracer software licenses to commercial entities. All license transactions are managed by the University of Michigan Innovation Partnerships office, and all proceeds are subject to university technology transfer policy. Other authors declare no other competing interests.

Figures

Fig. 1
Fig. 1. Overview of diaTracer and FragPipe computational platform.
diaTracer applies a 3D feature detection algorithm to detect signals from all possible precursors and fragments in MS1 and MS2 diaPASEF data. Pseudo-MS/MS spectra are generated through precursor-fragment clustering and can be processed as DDA data using MSFragger and FragPipe to build a spectral library directly from the data. A hybrid spectral library can also be generated if DDA data are available. This spectral library is then used to extract quantification using DIA-NN.
Fig. 2
Fig. 2. Deep proteome profiling.
a Box plot showing the numbers of quantified proteins of 16 diaPASEF runs from 16 individual TNBC peptide samples using different methods. The lower and upper edges of the box represent the first (Q1) and the third quartiles (Q3). The interquartile range (IQR) is the box between Q1 and Q3. The central line represents the median of the numbers. Whiskers extend from the box to the smallest and largest data points within 1.5 times the IQR from Q1 and Q3, respectively. Data points outside this range are considered outliers and are shown as individual dots. b Histogram showing the number of quantified proteins in the TNBC dataset using Spectronaut 18.5 and FragPipe with diaTracer, direct DIA and hybrid DDA/DIA analysis, and using DIA-NN in library-free mode, after application of different non-missing value filters. Shades of blue represent data completeness; darker blues indicate presence in a greater number of samples. Source data are provided as a Source Data file.
Fig. 3
Fig. 3. CSF data.
a Box plot showing the numbers of quantified proteins using different methods, with colors representing cleavage types (green: trypsin cleavage; orange: allowing semi-tryptic peptides). Each dot represents the number reported for each of the 34 diaPASEF runs from 15 patients with Alzheimer’s disease (AD) and 19 control subjects. In the boxplot, the central line represents the median of the numbers. The lower and upper edges of the box represent the first (Q1) and third quartiles (Q3). The interquartile range (IQR) is the box between Q1 and Q3. Whiskers extend from the box to the smallest and largest data points within 1.5 times the IQR from Q1 and Q3, respectively. Data points outside this range are considered outliers and are shown as individual dots. b Box plot showing the numbers of quantified precursors of 34 diaPASEF runs using different methods. The box plots’ median, edges, and whiskers are same as the ones in (a). c Distribution of identified peptides for protein HPX, with the red segment indicating the signal peptide region at the N-terminal. Orange segments represent tryptic peptides, while green segments represent semi-tryptic peptides. d Running time comparison. FragPipe* indicated the FragPipe run time (including DIA-NN for quantification) starting from diaTracer-extracted files. e Modifications identified using the common mass-offset workflow in FragPipe using pseudo-MS/MS spectra generated by diaTracer. Source data are provided as a Source Data file.
Fig. 4
Fig. 4. Plasma data.
a Histogram showing the number of quantified proteins using diaTracer-based FragPipe workflows (tryptic and semi-tryptic search), using DIA-NN library-free mode, colored from deep to light blue corresponding to different non-missing value filters. Shades of blue represent data completeness; darker blues indicate presence in a greater number of samples. b Same as (a) for quantified precursors. c Volcano plot comparing protein abundance between stage IV non-small cell lung cancer (NSCLC) and non-cancer control samples, highlighting NSCLC-overexpressed proteins (Log2 fold change ≥ 0.6; adjusted p-value ≤ 0.05). The adjusted p-value is from the moderated t-test followed by the Benjamini-Hochberg procedure. d Boxplots of protein abundance distribution of AKT2 (top) and H2AX (bottom) proteins in semi-tryptic (left) and tryptic (right) searches between 40 diaPASEF runs from 20 NSCLC (red) and 20 control (blue) samples. The p-values change from 0.086 to 0.037 and from 0.089 to 0.00063 for AKT2 and H2AX respectively after using semi-tryptic searches. In the boxplot, the central line represents the median of the numbers. The lower and upper edges of the box represent the first (Q1) and third quartiles (Q3). The interquartile range (IQR) is the box between Q1 and Q3. Whiskers extend from the box to the smallest and largest data points within 1.5 times the IQR from Q1 and Q3, respectively. Data points outside this range are considered outliers and are shown as individual dots. ns: p > 0.05; *p ≤ 0.05; **p ≤ 0.01; ***p ≤ 0.001; ****p ≤ 0.0001 (two-sided t-test). Source data are provided as a Source Data file.
Fig. 5
Fig. 5. HLA immunopeptidomics data.
a Number of quantified immunopeptides obtained using FragPipe with diaTracer and those reported in the original study based on Spectronaut 17. b Histogram of predicted binders for all HLA alleles of the corresponding sample donor, colored by binder type (light: weak binder; dark: strong binder). c Length distribution of quantified immunopeptides using FragPipe with diaTracer and that reported in the original study based on Spectronaut 17 directDIA, DDA experimental library, and panlibrary, each with a unique color. d Charge state distribution of quantified immunopeptides using FragPipe with diaTracer and that reported in the original study based on Spectronaut 17 directDIA. e Pseudo-MS/MS spectrum generated by diaTracer and the predicted spectrum for one of the quantified immunopeptides, VYQHLFTRI. The entropy score between the two spectra is 0.9863. Visualization using FragPipe-PDV viewer. Source data are provided as a Source Data file.
Fig. 6
Fig. 6. Phosphoproteomics data.
a Histogram of quantified phosphorylated peptide sequences across different gradients using FragPipe with diaTracer (blue) and those reported in the original study based on Spectronaut 16 (orange). b Quantified phosphorylated peptides intensities and correlations in four replicates in the 7 min gradient time experiment. c, d PSM and fragment XICs of phosphorylated peptide S(Pho)PSPPDGSPAATPEIR. e, f PSM and fragment XICs of phosphorylated peptide SPSPPDGS(Pho)PAATPEIR. The spectrum was generated by FragPipe-PDV. The XICs were generated by Skyline. Source data are provided as a Source Data file.
Fig. 7
Fig. 7. Low-input, spatial proteomics data.
a Number of quantified proteins after application of non-missing value (in at least one group) filter ranging from 0% to 100%, with line colors representing different methods. Red: results from the original study based on the library built using high-input samples; Green: results based on FragPipe with diaTracer, also using high-input data to build the library (“FragPipe high-input Lib”); Blue: result using diaTracer and FragPipe with low-input data only (“FragPipe”). b Venn diagram of quantified proteins between the three methods, with data filtered to keep proteins with at least 70% non-missing values in at least one group. c Principal-component analysis (PCA) plot of 148 samples based on 1471 proteins (after missing value filtering and data imputation) quantified using the FragPipe workflow (using low-input data only). d Log2 transformed protein level abundance distribution of selected cell-type-specific proteins in different regions. In the boxplot, the central line represents the median of the numbers. The lower and upper edges of the box represent the first (Q1) and third quartiles (Q3). The interquartile range (IQR) is the box between Q1 and Q3. Whiskers extend from the box to the smallest and largest data points within 1.5 times the IQR from Q1 and Q3, respectively. Data points outside this range are considered outliers and are shown as individual dots. e Volcano plot showing protein abundance differences between Mantel zone (28 samples) and T cell zone (34 samples), highlighting tissue-specific proteins (Log2 fold change ≤ 1; adjusted p-value ≤ 0.05). The adjusted p-value is from the moderated t-test followed by the Benjamini-Hochberg procedure. Source data are provided as a Source Data file.

Update of

References

    1. Aebersold, R. & Mann, M. Mass-spectrometric exploration of proteome structure and function. Nature537, 347–355 (2016). - PubMed
    1. Gillet, L. C. et al. Targeted data extraction of the MS/MS spectra generated by data-independent acquisition: a new concept for consistent and accurate proteome analysis*. Mol. Cell. Proteom.11, O111.016717 (2012). - PMC - PubMed
    1. Panchaud, A. et al. Precursor acquisition independent from ion count: how to dive deeper into the Proteomics Ocean. Anal. Chem.81, 6481–6488 (2009). - PMC - PubMed
    1. Venable, J. D., Dong, M.-Q., Wohlschlegel, J., Dillin, A. & Yates, J. R. Automated approach for quantitative analysis of complex peptide mixtures from tandem mass spectra. Nat. Methods1, 39–45 (2004). - PubMed
    1. May, J. C. & McLean, J. A. Ion mobility-mass spectrometry: time-dispersive instrumentation. Anal. Chem.87, 1422–1436 (2015). - PMC - PubMed

Publication types

LinkOut - more resources