. 2025 Jan 2;16(1):121.
doi: 10.1038/s41467-024-55684-y.

G-quadruplex stabilization provokes DNA breaks in human PKD1, revealing a second hit mechanism for ADPKD

Affiliations

G-quadruplex stabilization provokes DNA breaks in human PKD1, revealing a second hit mechanism for ADPKD

Agata M Parsons et al. Nat Commun. .

Abstract

The "secondhit" pathway is responsible for biallelic inactivation of many tumor suppressors, where a pathogenic germline allele is joined by somatic mutation of the remaining functional allele. The mechanisms are unresolved, but the human PKD1 tumor suppressor is a good experimental model for identifying the molecular determinants. Inactivation of PKD1 results in autosomal dominant polycystic kidney disease, a very common disorder characterized by the accumulation of fluid-filled cysts and end-stage renal disease. Since human PKD1 follows second hit and mouse Pkd1 heterozygotes do not, we reasoned that there is likely a molecular difference that explains the elevated mutagenesis of the human gene. Here we demonstrate that guanine quadruplex DNA structures are abundant throughout human, but not mouse, PKD1 where they activate the DNA damage response. Our results suggest that guanine quadruplex DNAs provoke DNA breaks in PKD1, providing a potential mechanism for cystogenesis in autosomal dominant polycystic kidney disease specifically and for the inactivation of guanine quadruplex-rich tumor suppressors generally.


Conflict of interest statement

Competing interests: A pending U.S. Provisional Patent Application No. 63/693,922 (inventor E.L.) directed to G4 quadruplex structures in the PKD1 gene has been filed on behalf of the applicant, Western Michigan University Homer Stryker M.D. School of Medicine. The authors declare no other competing interests.

Figures

Fig. 1
Fig. 1. G4 DNA sequences in PKD1.
a A basic G4 DNA sequence motif and model of a G4 structure. Guanines (G) pair with one another to form stacks of tetrads. Created in BioRender. Bouma, J. (2024) BioRender.com/n41z770. b G4 motifs quantitated for human (H), mouse (M) and rat (R) PKD1 with QGRS mapper, using a 45 nt. window, 3G minimum, and 8 nt. loop. c G4 motifs (+) mapped onto the sense strand of human, mouse, and rat PKD1. hPKD1 intron 1, 21, and 34 are marked (red text).
Fig. 2
Fig. 2. G4 formation in vitro.
a Dot blot assay using SG4 and mutated SG4 (SG4-R105A) nanobodies on a G4-folded oligonucleotide from hPKD1 intron 1 (G4) or thymine substituted (GT) control. Membranes were post-stained with SYBR gold (SYBR). b Circular dichroism (CD) spectroscopy of a representative G4 DNA repeat from IVS1 (G4) and a control DNA substituted to disrupt G4-folding potential (GT). A peak near 260 nm and dip at 240 nm indicates G4 DNA.
Fig. 3
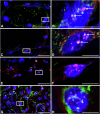
Fig. 3. G4 DNA at the human PKD1 locus in normal and ADPKD tissue.
A, B Normal human kidney tissue sections labeled with SG4 nanobody (green) and dCAS9 with sgRNAs to PKD1 (red). B Boxed region in (A) enlarged showing G4 DNA and PKD1 colocalization (arrows). C, D Human ADPKD tissue sections were labeled with SG4 nanobody against G4 DNAs (green) and dCAS9 with sgRNAs to PKD1 (red). D Boxed region in (C) is enlarged to show G4 DNA and PKD1 co-localization (arrows). EH are controls. E, F normal human kidney tissue sections labeled with mutated nanobody (SG4mut-R105A) (green) and dCAS9 with sgRNAs to PKD1 (red). G, H human ADPKD tissue sections labeled with SG4 nanobody (green) and dCAS9 without sgRNAs (red). Boxed region in (E, G) are expanded in (F, H), respectively. Scale bars in (A, C, E, G = 50 microns). Scale bars in (B, D, F, H = 10 microns).
Fig. 4
Fig. 4. G4 formation in hPKD1.
BG4-ChIP of HEK293T or mIMCD3 chromatin from cells treated with vehicle (DMSO), 10 µM Phen-DC3 (left) or 0.1 µM CX-5461 (right). Primers specific for a region adjacent to human PKD1 IVS21 (G4-rich) or IVS34 (G4-poor), and mouse IVS21 or IVS37 (both G4-poor) were used in qPCR to determine enrichment. Locus amplification is displayed as 2−delta Ct. For Phen-DC3, data are presented as mean values ± s.e.m. (n = 6 from two independent experiments) *** = P < 0.001, P > 0.999 for IVS34, IVS21 (mouse), and IVS37. The experiment was repeated with another G4-ligand, CX-5461 (right), and data are presented as mean values ± s.e.m. (n = 6 from two independent experiments) *** = P < 0.001, P = 0.681 for IVS34, P = 0.959 for IVS21 (mouse), and P = 0.785 for IVS37. Source data provided as a Source Data file.
Fig. 5
Fig. 5. G4 DNA impacts the expression of hPKD1.
qPCR of PKD1 mRNA from HEK293T or mIMCD3 cells incubated with 10 µM Phen-DC3 at indicated timepoints. cDNA abundance is relative to DMSO treatment. Data are presented as mean values ± s.e.m. (n = 3 independent experiments). RM one-way ANOVA, ** = P < 0.01. For HEK293T, day 0–1 P = 0.042, day 0–2, P = 0.003, day 0–7 P = 0.002. For mIMCD3 day 0–1 P = 0.119, day 0–2 P = 0.099, day 0–7 P = 0.019. Source data provided as a Source Data file.
Fig. 6
Fig. 6. G4 stabilization results in activation of the DNA damage response at PKD1.
a qPCR data for PKD1 and PCNA from ChIPs of genomic DNA with anti-γH2AX antibody in DMSO, Phen-DC3 (left) or CX-5461-treated (right) HEK293T and mIMCD3 cells. For both ligands, data are presented as mean ± s.e.m. (n = 6 from two independent experiments for each ligand (four total experiments/IPs)), two-way ANOVA, *** = P < 0.001. For Phen-DC3, hPCNA P = 0.784, mPkd1 P > 0.999, and mPcna P = 0.741. For CX-5461, hPCNA P = 0.623, mPkd1 P = 0.263, mPcna P = 0.947. b qPCR data for PKD1 and PCNA from ChIPs of genomic DNA precipitated with anti-RAD51 antibody in DMSO, Phen-DC3 (left) or CX5461-treated (right) HEK293T. Data are presented as mean ± s.e.m. (n = 6 from two (Phen-DC3) and n = 9 from three (CX-5461) independent experiments), two-way ANOVA, *** = P < 0.001. For Phen-DC3 hPCNA P = 0.431, for CX-5461 hPCNA P = 0.931. Amplification results for ChIPs are displayed as 2−delta Ct. Source data provided as a Source Data file.
Fig. 7
Fig. 7. Model for G4 DNA-induced second hit mutations in hPKD1.
Somatic cells heterozygous for a pathogenic PKD1 allele (PKD1+/−) do not lead to cysts, left. G4 DNA forms in PKD1 during replication, center. G4 DNAs block DNA metabolism and increases the risk of double strand breaks (DSB) in the remaining normal allele, right. Second hit inactivation (PKD1−/−) due to G4 DNA formation lowers polycystin-1 levels and leads to cell proliferation and cystogenesis. Created in BioRender, Bouma, J. (2024) BioRender.com/v35i306.

References

    1. Knudson, A. G. Mutation and cancer: statistical study of retinoblastoma. Proc. Natl. Acad. Sci. USA68, 820–823 (1971). - PMC - PubMed
    1. Qiu, J., Germino, G. G. & Menezes, L. F. Mechanisms of cyst development in polycystic kidney disease. Adv. Kidney Dis. Health30, 209–219 (2023). - PMC - PubMed
    1. Watnick, T. J. et al. Somatic mutation in individual liver cysts supports a two-hit model of cystogenesis in autosomal dominant polycystic kidney disease one possible explanation for the focal nature of renal cyst formation. Mol. Cell2, 247–251 (1998). - PubMed
    1. Koptides, M. et al. Loss of heterozygosity in polycystic kidney disease with a missense mutation in the repeated region of PKD1. Hum. Genet.103, 709–717 (1998). - PubMed
    1. Brasier, J. L. & Henske, E. P. Loss of the polycystic kidney disease (PKD1) region of chromosome 16p13 in renal cyst cells supports a loss-of-function model for cyst pathogenesis. J. Clin. Investig.99, 194–199 (1997). - PMC - PubMed

Publication types

LinkOut - more resources