. 2025 Jan 2;16(1):50.
doi: 10.1038/s41467-024-55745-2.

Liver-specific gene PGRMC1 blocks c-Myc-induced hepatocarcinogenesis through ER stress-independent PERK activation

Affiliations

Liver-specific gene PGRMC1 blocks c-Myc-induced hepatocarcinogenesis through ER stress-independent PERK activation

Fubo Ji et al. Nat Commun. .

Abstract

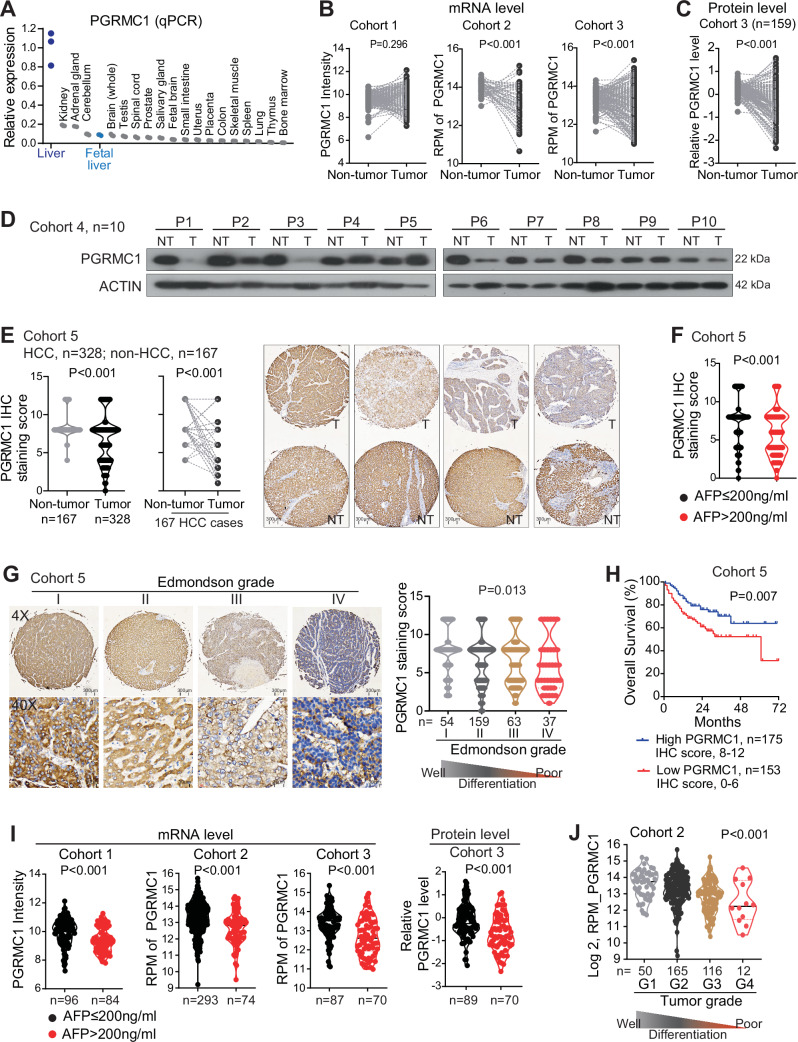
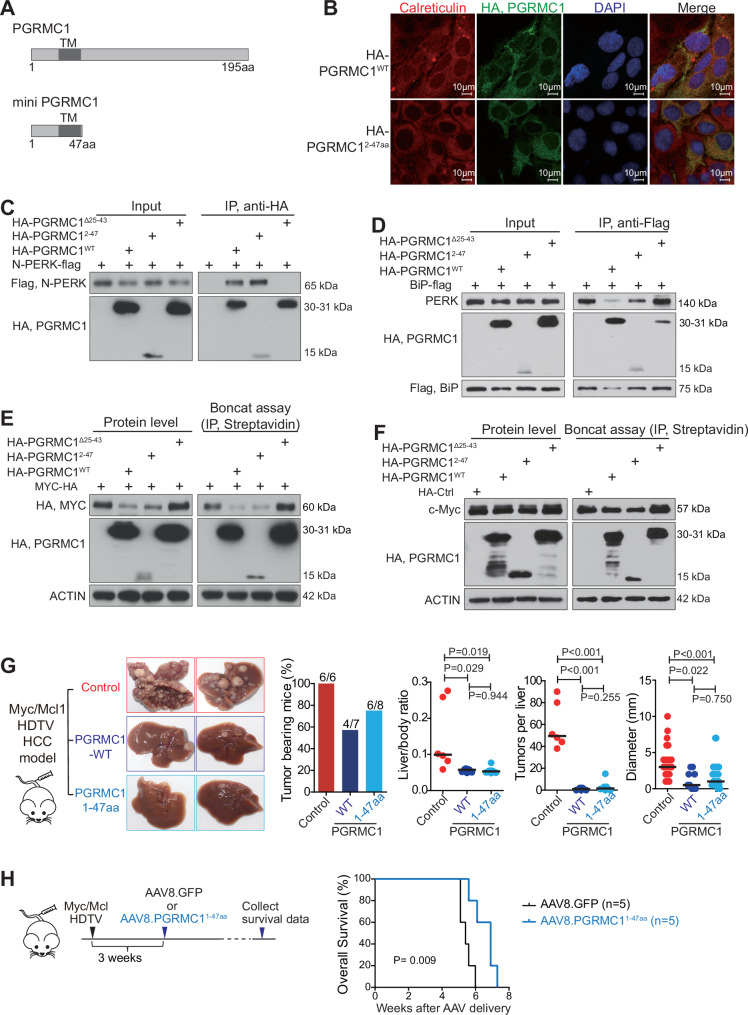
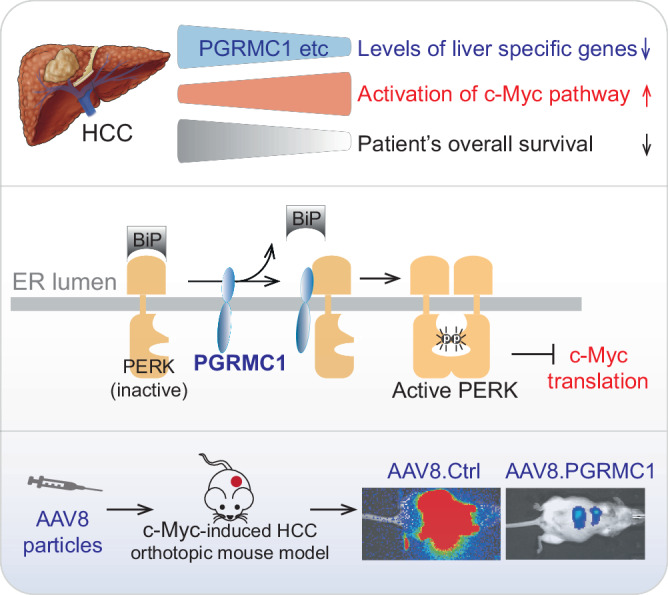
Roles of liver-specific genes (LSGs) in tumor initiation and progression are rarely explored in hepatocellular carcinoma (HCC). Here we show that LSGs are generally downregulated in HCC tumor tissues compared to non-HCC liver tissues, and low-LSG HCCs show poor prognosis and the activated c-Myc pathway. Among the c-Myc- and patient prognosis-associated LSGs, PGRMC1 significantly blocks c-Myc-induced orthotopic HCC formation. The role of PGRMC1 depends on its localization to the endoplasmic reticulum (ER) membrane, where PGRMC1 interacts with PERK through their ER luminal domains. This interaction in turn activates PERK in an ER stress-independent manner, which phosphorylates eIF2α and consequently inhibits c-Myc protein translation. In HCC patients, PGRMC1 level is significantly reduced in tumor tissues and negatively associated with the c-Myc signature. Patients with low-PGRMC1 in their tumors have poor prognosis. Collectively, deregulated LSGs in HCC are associated with the c-Myc pathway activation and PGRMC1 blocks c-Myc-induced hepatic carcinogenesis through promoting ER stress-independent PERK activation.


Conflict of interest statement

Competing interests: The authors declare no competing interests.

Figures

Fig. 1
Fig. 1. LSGs were heterogeneously expressed in HCC and associated with c-Myc signaling.
A In cohorts 1-3, HCC patients were clustered by liver-specific genes expression in non-tumor and tumor tissues. NT non-tumor. T tumor. B HCC patients were divided into low-, middle- and high- LSGs expression groups, clustered by LSG levels in tumor tissues. The number of cases were indicated. The status of AFP level and TNM stage for each patient were labeled. C Kaplan-Meier analysis of time to recurrence and overall survival for three groups of HCC cases in cohorts 1-3. Log-rank test was performed. D In cohorts 1-3, GSEA analysis were performed between HCC patients with high LSG levels and ones with low LSG levels in their tumors. Venn diagram analysis revealed the 34 signatures in LSG high group which were commonly enriched in three independent cohorts. Enrichment score (ES) is computed using a weighted Kolmogorov-Smirnov test and signature with the nominal p-value of ES score <0.05 is shown (one-sided). E In cohorts 1-3, c-Myc activation status in low-, middle- and high- LSG expression HCC subgroups. F LSG expression status in strong, middle, and weak c-Myc activation HCC subgroups in cohort 1-3. E, F The number of cases in each group or subgroup was indicated in the figure. Chi-square test was performed (two-sided). Source data are provided as a Source Data file.
Fig. 2
Fig. 2. Liver-specific gene PGRMC1 significantly suppressed c-Myc-induced HCC tumor formation.
A Venn diagram analysis of c-Myc- and survival-related LSGs in cohorts 1-2. c-Myc related genes were screened by class comparison of tumor tissue mRNA profiling between strong and weak c-Myc activation subgroups (P < 0.001, |fold change | >2). Survival-related LSGs were screened by Kaplan-Meier survival analysis with a median cut-off of each LSG (P < 0.05). 40 c-Myc/survival-related LSGs were identified and shown by their P-values of c-Myc-related gene analysis. TPM, transcripts per million, from the average of three transcriptomics datasets (HPA, GTEx and FANTOM5). B Expression levels of the top 5 c-Myc/survival-related LSGs in different c-Myc activation groups (left panel, median and quartiles were shown), and their hazard ratio of low-LSG group survival vs. high-LSG group (right panel, hazard ratio with 95% confidence interval). For strong, middle and weak c-Myc activation groups, n = 67, 62, 47 in Cohort 1; n = 109, 133, 129 in Cohort 2; n = 66, 75, 30 in Cohort 3. C Screening LSGs in suppressing c-Myc-mediated HCC development with Myc/Mcl1-induced HDTV mouse model. Overall survival analysis was presented. Five to six mice for each group were used (Control, ABAT, FMO4 and PGRMC1 groups, n = 6; HAGH and SLC10A1 groups, n = 5). D Tumor bearing mice (including mice died from tumor burden) in five LSG groups and the control group of Myc/Mcl1 mouse model. E Tumor formation in Myc/Mcl1-induced HCC mouse model with or without PGRMC1 overexpression. Control group, n = 7. PGRMC1 group, n = 6. F Tumor formation in c-Myc-induced HCC mouse model with or without PGRMC1 overexpression. Control group, n = 8. PGRMC1 group, n = 6. E, F Representative images were shown. Tumor bearing animals, liver/body ratio, tumors per liver, and tumor diameter were also quantified and compared. Student’s t-test was performed (two-tailed). G Overall flow of Myc/Mcl1/luciferase-induced HCC mouse model treated with AAV8 particle. Representative images of in vivo bioluminescence imaging with mice treated with AAV8 at day 28 of post-injection. H Average bioluminescence radiance at 14, 21, 24, and 28 days after injecting AAV8 particle (4 mice per group). Two-way ANOVA was performed. Overall survival was shown for mice treated with AAV8.GFP or AAV8.PGRMC1 and Log-rank test was performed. Source data are provided as a Source Data file.
Fig. 3
Fig. 3. PGRMC1 was downregulated in HCC tumor tissues, especially in those tissues with poorly differentiation.
A PGRMC1 expression in 20 normal human organs by RT-qPCR. These RNAs were commercially available and each organ RNA was a pooled RNA which was originally from more than three different individuals. Data were from three technique triplicates of the pooled RNAs. B PGRMC1 mRNA levels in paired non-tumor and tumor tissues of HCC patients from cohorts 1-3. C PGRMC1 protein levels in paired non-tumor and tumor tissues of HCC patients from cohort 3. D PGRMC1 protein level was detected by Western Blot in paired non-tumor and tumor tissues of HCC patients from cohort 4. E PGRMC1 IHC staining in cohort 5. The quantitative data and representative images were shown. Scale bar, 300 µm. F PGRMC1 levels in HCC tumors from AFP positive ( > 200 ng/ml, n = 90) or AFP negative ( ≤ 200 ng/ml, n = 166) HCC patients in cohort 5. G Representative images and quantitative data of PGRMC1 staining in HCC tumor with different Edmondson grades in HCC cohort 5. Scale bars, 300 µm for the top panel and 30 µm for the bottom panel. H Kaplan-Meier analysis of overall survival in HCC cases from cohort 5 based on PGRMC1 protein level. Log-rank test was performed. I PGRMC1 levels in HCC tumors from AFP positive or AFP negative HCC patients in cohorts 1-3. The number of cases were indicated. J PGRMC1 levels in tumors with different tumor grades in cohort 2. B, C, F, I Student’s t-test was performed (two tailed). E Non-parametric t-test was performed (two-tailed). G, J One-way ANOVA was performed. Source data are provided as a Source Data file.
Fig. 4
Fig. 4. PGRMC1 reduced c-Myc protein level by suppressing c-Myc protein translation.
The mRNA and protein levels of c-Myc and PGRMC1 in Huh7 and Huh1 cells being transfected with siPGRMC1 A or HA-PGRMC1 B. Data were from three biological triplicates, and shown as mean ± standard deviation. C Exogenous c-Myc protein level were examined by western blot in Huh7 and Huh1 cells with or without overexpression of PGRMC1. Boncat assay were used for detecting exogenous D and endogenous E c-Myc protein translation in Huh7 and Huh1 cells with or without overexpression PGRMC1. F Boncat assay were used to detect c-Myc protein translation in Huh7 and Huh1 cells with or without silencing PGRMC1. All these examinations were performed in more than three independent experiments and representative results were shown here. Source data are provided as a Source Data file.
Fig. 5
Fig. 5. PGRMC1 activated PERK/p-eIF2α axis, which contributed to the reduced level of c-Myc.
A Huh7 and Huh1 cells were transfected with MYC-HA and HA-PGRMC1 together with siCtrl or siPERK. The indicated proteins were detected by Western Blot. B Huh7 and Huh1 cells were transfected with MYC-HA and HA-PGRMC1 together with the treatment of PERK inhibitors (iPERK-1 and iPERK-2). The indicated proteins were detected. C Huh7 and Huh1 cells were transfected with siCtrl or siPERK with or without the tunicamycin treatment. The indicated proteins were detected. D Huh7 and Huh1 cells were transfected with HA-PGRMC1 together with siCtrl or siPERK and the indicated proteins were detected. E Huh7 and Huh1 cells were transfected with HA-PGRMC1 together with the treatment of PERK inhibitors. The indicated proteins were detected. F 3T3 and Hepa1-6 cells were transfected with HA-Ctrl or HA-PGRMC1 and the indicated proteins were detected. G Liver tumor formation in Myc/Mcl1-induced HCC mouse model with or without PGRMC1, upon with or without silencing of mouse Perk by shRNAs. Representative images were shown. Liver vs. body ratio, tumor numbers per liver, and tumor diameter were quantified and compared. Six mice were used for the control group and eight mice were used for the rest groups. Student’s t-test was used for comparison (two-tailed). Immunoblotting images in panel A–F represent the data from three or more independent experiments. Source data are provided as a Source Data file.
Fig. 6
Fig. 6. PGRMC1 interacted with PERK via their ER luminal regions and disassociated BiP from PERK.
A Anti-HA IP was performed to detect the interaction of PGRMC1 with PERK in Huh7, Huh1 and 293 T cells when HA-PGRMC1 was transfected. B Mapping PERK regions involved in PGRMC1 binding. Anti-flag IPs were performed in 293 T and Huh7 cells co-transfected with HA-PGRMC1 and different PERK-flag vectors. C-PERK, C-terminal region of PERK; N-PERK, N-terminal region of PERK. C Mapping PGRMC1 regions involved in PERK binding. Anti-HA IPs were performed in 293 T and Huh7 cells co-transfected with N-PERK-flag and different HA-PGRMC1 vectors. D Anti-Flag IP was performed to detect the interaction of BiP and PERK in 293 T and Huh7 cells when BiP-flag was co-transfected with PGRMC1. E Anti-Flag IP was performed in 293 T and Huh7 cells when BiP-flag was co-transfected with PGRMC1WT, PGRMC1Δ25-43 and PGRMC1Δ1-24. F Exogenous c-Myc level, p-eIF2α and eIF2α levels in Huh7 cells being transfected with PGRMC1 and with or without TUDCA and 4-PBA treatment. G Endogenous c-Myc protein level, p-eIF2α and eIF2α levels in Huh7 cells being transfected with PGRMC1 and with or without TUDCA and 4-PBA treatment. H An illustrated model of PGRMC1 activating PERK at an ER stress-independent manner. Immunoblotting images in this figure represent the results from three or more independent experiments. Source data are provided as a Source Data file.
Fig. 7
Fig. 7. Both N-terminal domain and ER location of PGRMC1 were vital for PGRMC1 to inhibit c-Myc translation and c-Myc-induced liver tumor formation.
A Confocal microscopy images of PGRMC1 and ER marker Calreticulin and their co-localization in Huh7 cells transfected with HA-Ctrl, HA-PGRMC1WT, HA-PGRMC1Δ1-24 and HA-PGRMC1Δ25-43. Scale bar, 10 µm. B Boncat assay in Huh7 cells co-transfected with PGRMC1WT or PGRMC1Δ25-43 along with MYC-HA. C Boncat assay in Huh7 cells transfected with PGRMC1WT or PGRMC1Δ25-43. D Liver tumor formation in Myc/Mcl1-induced HCC mouse model with PGRMC1WT or PGRMC1Δ25-43 overexpression. Representative images were shown. Liver vs. body ratio, tumor numbers per liver, and tumor diameter were quantified and compared. Six mice per group were used. Student’s t-test was used (two-tailed). E Boncat assay in Huh7 cells co-transfected with PGRMC1WT or PGRMC1Δ1-24 along with MYC-HA. F Boncat assay in Huh7 cells transfected with PGRMC1WT or PGRMC1Δ1-24. G Liver tumor formation in Myc/Mcl1-induced HCC mouse model with PGRMC1WT or PGRMC1Δ2-24 overexpression. Representative images were shown. Liver vs. body ratio, tumor numbers per liver, and tumor diameter were quantified and compared. Six mice for control group, seven for PGRMC1 group and eight for PGRMC1Δ2-24 group were used. Student’s t-test was used (two-tailed). Images in panels A–C and E, F represent the data from three or more independent experiments. Source data are provided as a Source Data file.
Fig. 8
Fig. 8. A mini PGRMC1 (1-47aa) interacted with PERK, and reduced c-Myc translation and Myc/Mcl1-induced tumor formation.
A The diagram of a mini PGRMC1 (47aa), including the N-terminal region and transmembrane domain of PGRMC1. B Confocal microscopy images of HA-PGRMC1WT and HA-PGRMC12–47aa with ER marker Calreticulin and their co-localization in Huh7 cells. C Anti-HA IP was performed to detect the interaction of PGRMC1 and PERK in Huh7 cells transfected with HA-PGRMC1WT, HA-PGRMC12–47aa, or PGRMC1Δ25-43, along with N-PERK-flag. D Anti-flag IP was performed to detect the interaction of PERK and BiP in Huh7 cells transfected with BiP-flag together with HA-PGRMC1WT, HA-PGRMC12–47aa, or PGRMC1Δ25-43. E Boncat assay in Huh7 cells co-transfected with MYC-HA along with PGRMC1WT, HA-PGRMC12–47aa, or PGRMC1Δ25-43. The indicated protein was detected. F Boncat assay in Huh7 cells transfected with PGRMC1WT, HA-PGRMC12–47aa, or PGRMC1Δ25-43. G Liver tumor formation in Myc/Mcl1-induced HCC mouse model with PGRMC1WT or PGRMC11–47aa overexpression. Representative images were shown. Liver vs. body ratio, tumor numbers per liver, and tumor diameter were quantified and compared. Six mice for control group, seven for PGRMC1 group and eight for PGRMC11–47aa group were used. Student’s t-test was used (two-tailed). H Overall flow of Myc/Mcl1-induced orthotopic HCC mouse model treated with AAV8.GFP or AAV8.PGRMC11–47aa particle. Five mice per group were used. Overall survival time of mice treated with AAV8 was collected and compared. Log-rank t test was performed. Images in panels B-F represent the data from three or more independent experiments. Source data are provided as a Source Data file.
Fig. 9
Fig. 9. Summary of liver specific genes and PGRMC1 in regulating HCC.
The deregulated liver-specific genes (LSGs) in HCC were associated with c-Myc oncogenic pathway activation. The LSG PGRMC1 promoted PERK activation in an ER stress-independent manner, and consequently blocked c-Myc-induced hepatic carcinogenesis. Methods restoring the level of liver specific genes such as PGRMC1 hold the potential of treating or even preventing HCC.

References

    1. Sung, H. et al. Global Cancer Statistics 2020: GLOBOCAN estimates of incidence and mortality worldwide for 36 cancers in 185 Countries. CA Cancer J Clin71, 209–249 (2021). - PubMed
    1. Kulik, L. & El-Serag, H. B. Epidemiology and management of hepatocellular carcinoma. Gastroenterology156, 477–491 e471 (2019). - PMC - PubMed
    1. El-Serag, H. B. Epidemiology of viral hepatitis and hepatocellular carcinoma. Gastroenterology142, 1264–1273 e1261 (2012). - PMC - PubMed
    1. Gao, Q. et al. Integrated proteogenomic characterization of HBV-related hepatocellular carcinoma. Cell179, 1240 (2019). - PubMed
    1. Chaisaingmongkol, J. et al. Common molecular subtypes among asian hepatocellular carcinoma and cholangiocarcinoma. Cancer Cell32, 57–70 e53 (2017). - PMC - PubMed

Publication types

MeSH terms

Associated data

LinkOut - more resources