. 2025 Jan 2;15(1):268.
doi: 10.1038/s41598-024-79445-5.

Downregulation of Gldc attenuates myocardial ischemia reperfusion injury in vitro by modulating Akt and NF-κB signalings

Affiliations

Downregulation of Gldc attenuates myocardial ischemia reperfusion injury in vitro by modulating Akt and NF-κB signalings

Lian Shuang et al. Sci Rep. .

Abstract

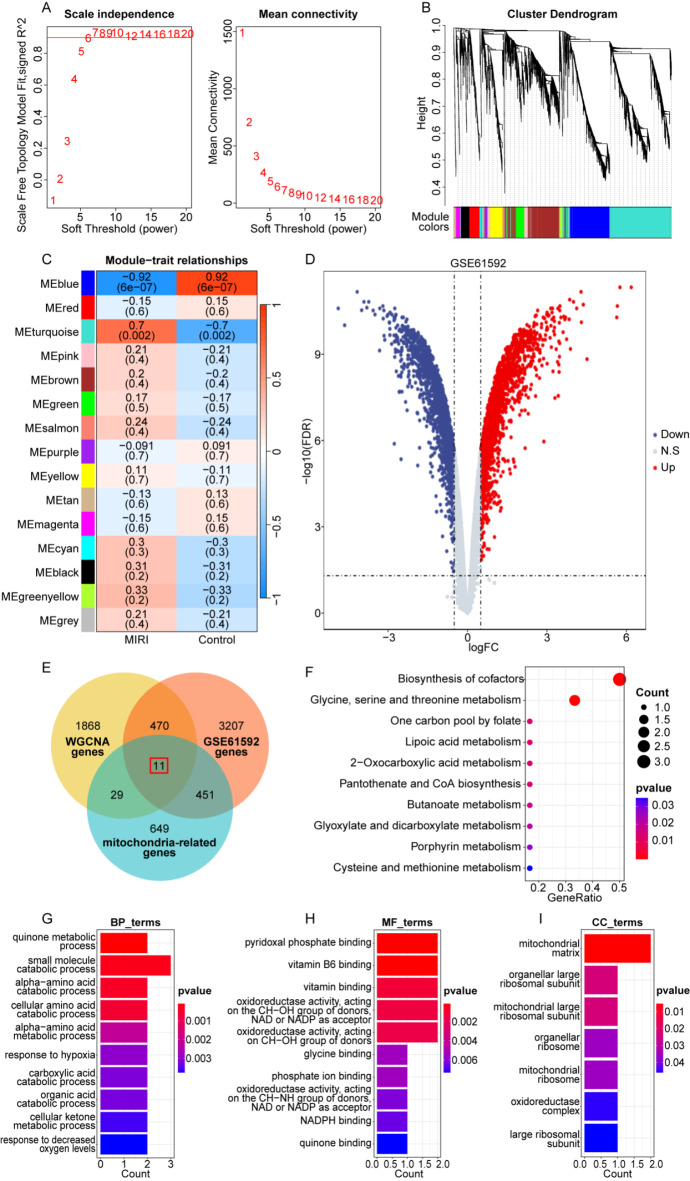
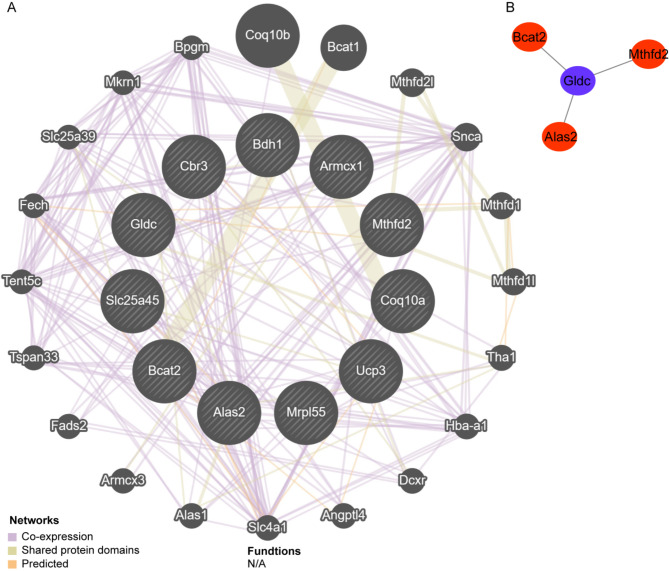
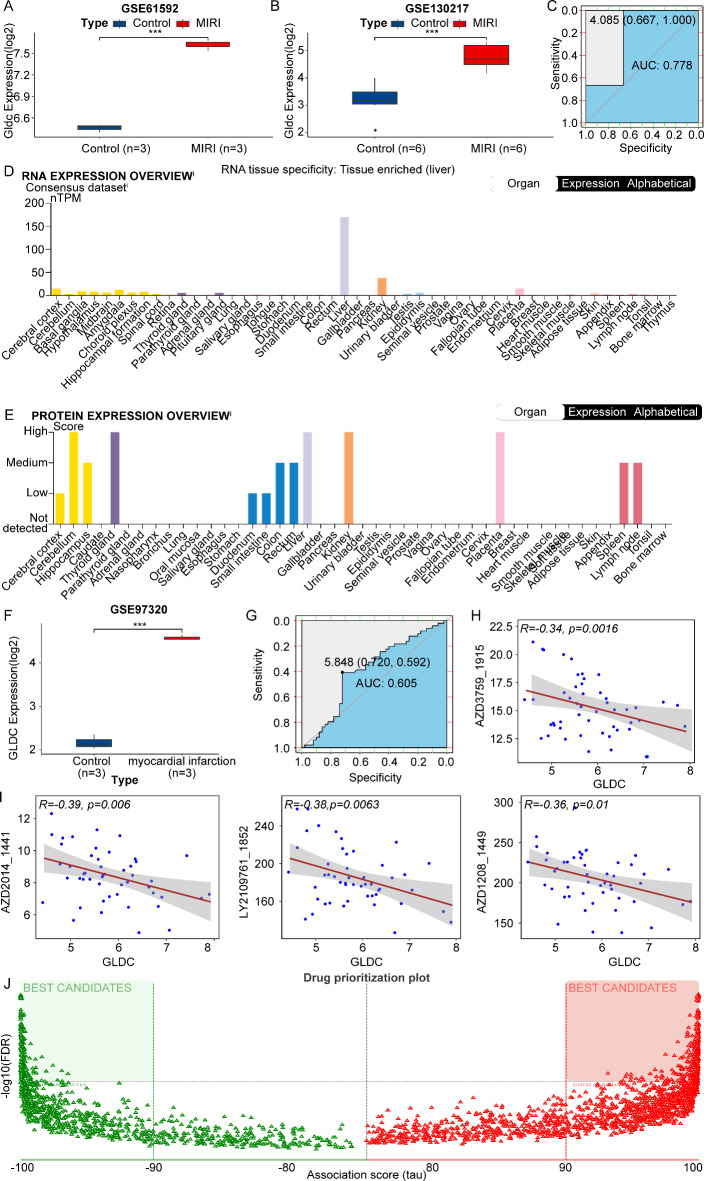
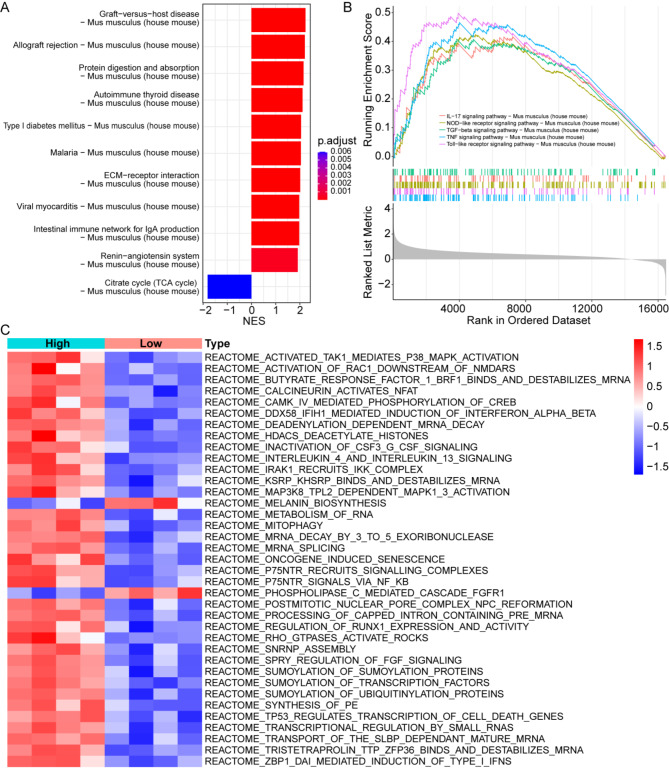
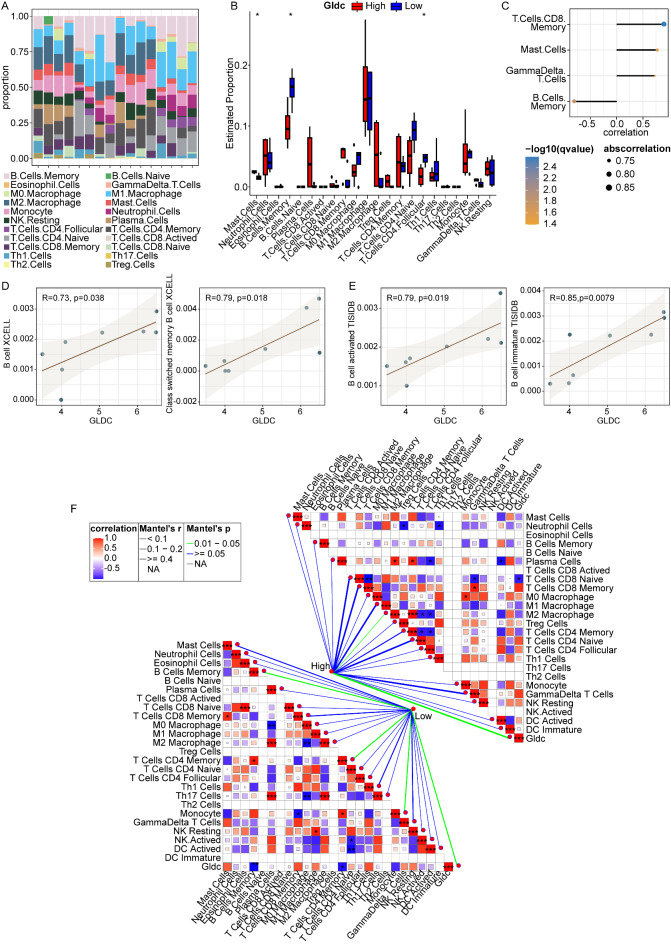
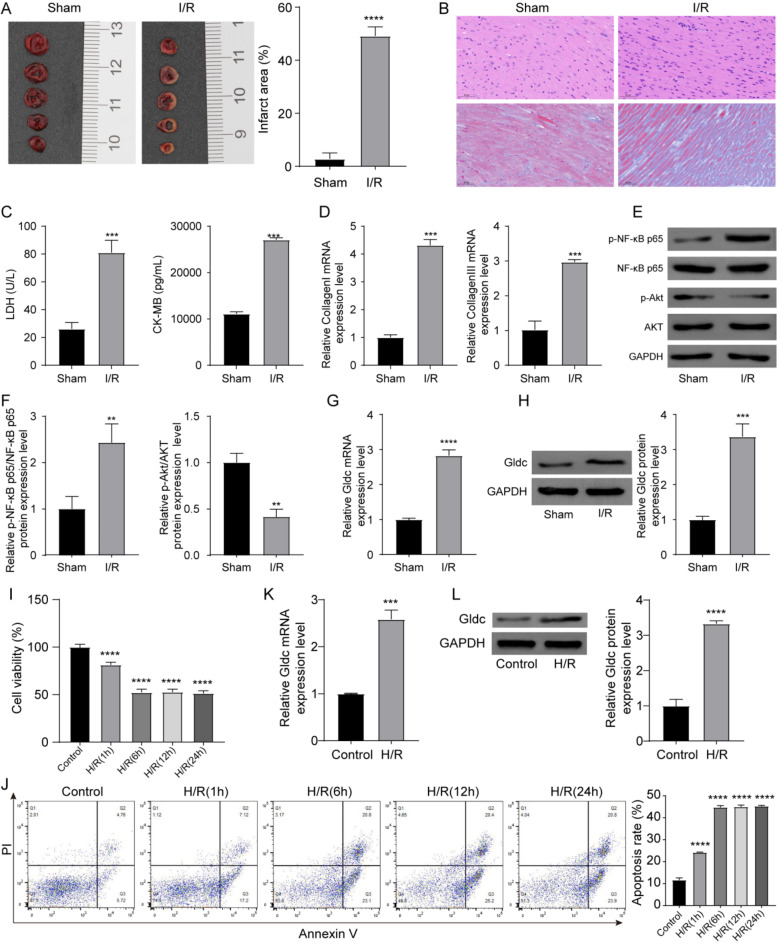
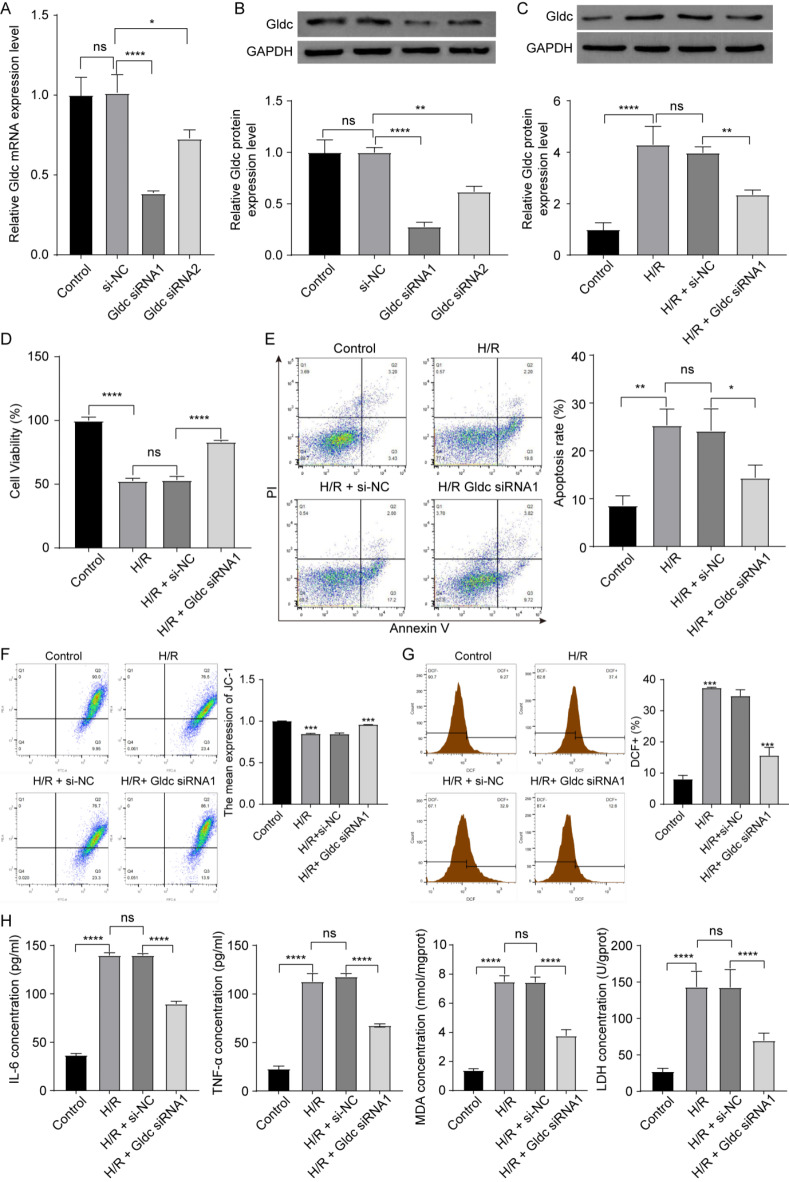
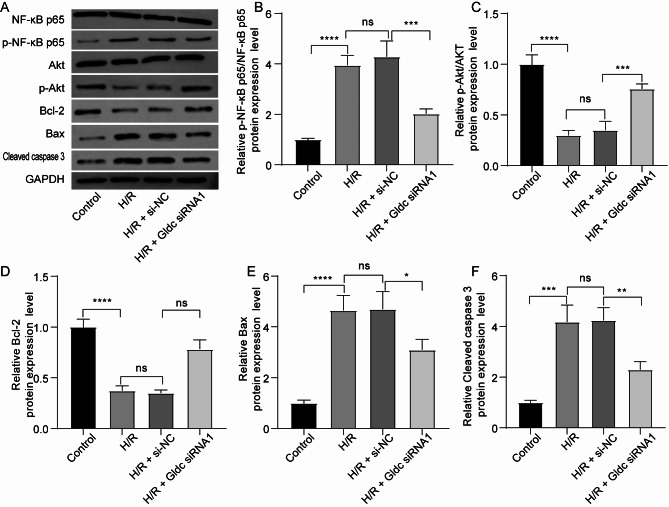
Myocardial ischemia/reperfusion injury (MIRI) is a serious clinical complication that is caused by reperfusion therapy following myocardial infarction (MI). Mitochondria-related genes (Mito-RGs) play important roles in multiple diseases. However, the role of mitochondria-related genes in MIRI remains largely unknown. The GSE67308 dataset from the GEO database was utilized to identify MIRI-related gene modules through WGCNA. Meanwhile, differential expression analysis was conducted to identify differentially expressed genes (DEGs) in the GSE61592 dataset. Next, candidate Mito-RGs related to MIRI were screened by Venn analysis. Thereafter, a myocardial hypoxia/reperfusion (H/R) H9C2 cell model and a mouse ischemia/reperfusion (I/R) model were established to verify the expression level of glycine decarboxylase (Gldc) in MIRI in vitro and in vivo. Based on data from the GEO database, Gldc levels were notably upregulated in murine MIRI samples, compared to the control group. RT-qPCR and western blot confirmed that Gldc levels were obviously elevated in the heart of I/R mice and H/R-exposed cardiomyocytes. Moreover, the deficiency of Gldc notably increased the viability and reduced the apoptosis and inflammatory responses in H9C2 cells exposed to H/R. Meanwhile, Gldc downregulation significantly reduced p-NF-κB p65, Bax and cleaved caspase 3 levels and elevated p-Akt and Bcl-2 levels in H9C2 cells exposed to H/R. The ROC curve analysis further demonstrated that Gldc gene exhibited good diagnostic value for MIRI. Collectively, Gldc deficiency could attenuate H/R injury in cardiomyocytes in vitro through activating Akt and inactivating NF-κB signalings. These data suggested that GLDC may serve as both a diagnostic and therapeutic target for MIRI.

Keywords: Glycine decarboxylase; Mitochondria-related gene; Myocardial infarction; Myocardial ischemia; Myocardial ischemia/Reperfusion injury.


Conflict of interest statement

Declarations. Competing interests: The authors declare no competing interests. Ethical approval: All the animal experiments were complied with the guidelines of the Tianjin Medical Experimental Animal Care, and animal protocols were approved by the Institutional Animal Care and Use Committee of Yi Shengyuan Gene Technology (Tianjin) Co., Ltd. (protocol number YSY-DWLL-2023254).

Figures

Fig. 1
Fig. 1
Identification of candidate Mito-RGs associated with MIRI. (A) Determine of the best soft threshold (β = 6). (B) Clustering results of gene modules in the GSE67308 cohort (MIRI, n = 8; normal, n = 8). (C) Heat map of the correlation between each module and MIRI. (D) Volcano plots showed DEGs between MIRI (n = 3) and normal samples (n = 3) in the GSE61592 dataset. (E) Venn diagram of the overlapping genes. (F) KEGG and (GI) GO analyses were performed on the overlapping genes. (F) Top 10 KEGG pathways. (G) Top 10 GO-BP terms. (H) Top 10 GO-MF terms. (I) 7 GO-CC terms.
Fig. 2
Fig. 2
Gldc gene was selected as a hub Mito-RGs associated with MIRI. (A) PPI network constructed by GeneMANIA database. (B) PPI network constructed by the STRING database.
Fig. 3
Fig. 3
Validation of the expression and clinical value of Gldc gene. (A, B) The box-plot showed Gldc levels in normal (n = 3) and MIRI (n = 3) samples in GSE61592 cohort and in normal (n = 6) and MIRI (n = 6) samples in GSE130217 cohort. (C) ROC curve was used to evaluate the diagnostic value of Gldc in MIRI in merged GSE61592 and GSE130217 cohort (n = 18). The (D) mRNA and (E) protein levels of GLDC in human normal tissues were obtained from the HPA database. (F) The box-plot showed GLDC levels in normal (n = 3) and myocardial infarction (n = 3) samples in GSE97320 cohort. (G) ROC curve was used to evaluate the diagnostic value of GLDC in myocardial infarction in GSE97320 cohort (n = 6). (H, I) The scatter plot showed the correlation between GLDC and IC50 values of 4 potential drugs in MI samples (n = 49) in GSE66360 cohort. (J) The DREIMT database was applied to predict potential therapeutic drugs utilizing MI samples (n = 49) from the GSE66360 cohort.
Fig. 4
Fig. 4
Biological function analysis of Gldc gene in MIRI. (A, B) GSEA and (C) GSVA analyses.
Fig. 5
Fig. 5
Immune cell infiltration in H-Gldc and L-Gldc groups. (A) The CIBERSORT algorithm was used to analyze the abundance of 22 types of infiltrated immune cells in each sample in the GSE67308 cohort (n = 16). (B) The box-plot showed the Gldc levels in 22 immune cells between L-Gldc (n = 4) and H-Gldc (n = 4) groups in MIRI samples in GSE67308 cohort. (C) The correlation between Gldc levels and immune cells in MIRI samples in GSE67308 cohort (n = 8). (D) Xcell algorithm (E) TISIDB database were performed to evaluate the correlation between GLDC levels and immune cells in MIRI samples in GSE67308 cohort (n = 8). (F) The correlation between high- (n = 4) or low-Gldc (n = 4) level group and 22 immune cells.
Fig. 6
Fig. 6
Gldc level was elevated in heart tissue of I/R mice and H/R cardiomyocytes. (A) The myocardial infarct size was evaluated by the TTC staining assay (n = 5). (B) Representative image of H&E and Masson staining (n = 3). (C) LDH and CK-MB levels in heart tissue were evaluated by ELISA (n = 3). (D) RT-qPCR analysis of Collagen I and Collagen III levels in sham and I/R groups (n = 3). (E, F) Western blot analyses of p-NF-κB p65 and p-Akt levels in sham and I/R groups (n = 3). (G, H) RT-qPCR and western blot analyses of Gldc levels in sham and I/R groups (n = 3). (I, J) H9C2 cells were subjected to 4 h of hypoxia followed by reoxygenation periods of 1, 6, 12 and 24 h. CCK-8 and flow cytometry were used to assess cell viability and apoptosis (n = 3). (K, L) H9C2 cells were subjected to 4 h of hypoxia followed by 12 h of reoxygenation. RT-qPCR and western blot analyses of Gldc levels in cells subjected to H/R (n = 3). **P < 0.01, ***P < 0.001, ****P < 0.0001. Data were presented as mean ± standard deviation.
Fig. 7
Fig. 7
Downregulation of Gldc protected against H/R injury in H9C2 cells. (A, B) RT-qPCR and western blot analyses of Gldc levels in H9C2 cells transfected with si-NC, Gldc siRNA1 or Gldc siRNA2 (n = 3). (C) H9C2 cells transfected with si-NC or Gldc siRNA1, and then subjected to 4 h of hypoxia followed by 12 h of reoxygenation. Western blot assay was used to assess Gldc levels in H9C2 cells (n = 3). (D, E) CCK-8 and flow cytometry were applied for determining cell vaiblity and apoptosis (n = 3). (F, G) Flow cytometry was performed to assess MMP and ROS production in cells (n = 3). (H) ELISA was used to evaluate IL-6, TNF-a, MDA and LDH levels in the supernatant of H9C2 cells (n = 3). *P < 0.05, **P < 0.01, ***P < 0.001, ****P < 0.0001. Data were presented as mean ± standard deviation.
Fig. 8
Fig. 8
Downregulation of Gldc protected against H/R injury in H9C2 cells through activating Akt and inactivating NF-κB signalings. H9C2 cells transfected with si-NC or Gldc siRNA1, and then subjected to 4 h of hypoxia followed by 12 h of reoxygenation. (AF) Western blot assay was used to assess p-NF-κB p65, p-Akt, Bcl-2, Bax and cleaved caspase 3 levels in H9C2 cells (n = 3). *P < 0.05, **P < 0.01, ***P < 0.001, ****P < 0.0001. Data were presented as mean ± standard deviation.

Similar articles

References

    1. Frank, A. et al. Myocardial ischemia reperfusion injury: from basic science to clinical bedside. Semin. Cardiothorac. Vasc. Anesth.16, 123–132 (2012). - PMC - PubMed
    1. Haidarali, S. et al. Targeting apoptotic pathways in myocardial infarction: attenuated by phytochemicals. Cardiovasc. Hematol. Agents Med. Chem.12, 72–85 (2014). - PubMed
    1. Braunwald, E. & Pfeffer, M. A. Ventricular enlargement and remodeling following acute myocardial infarction: mechanisms and management. Am. J. Cardiol.68, 1D–6D (1991). - PubMed
    1. Guan, Y. et al. Rescuing cardiac cells and improving cardiac function by targeted delivery of oxygen-releasing nanoparticles after or even before acute myocardial infarction. ACS Nano16, 19551–19566 (2022). - PMC - PubMed
    1. Sun, Q. et al. A self-sustaining antioxidant strategy for effective treatment of myocardial infarction. Adv. Sci. (Weinh)10, e2204999 (2023). - PMC - PubMed

Publication types

LinkOut - more resources