

Integrating electronic health records and GWAS summary statistics to predict the progression of autoimmune diseases from preclinical stages
- PMID: 39747168
- PMCID: PMC11695684
- DOI: 10.1038/s41467-024-55636-6
Integrating electronic health records and GWAS summary statistics to predict the progression of autoimmune diseases from preclinical stages
Abstract
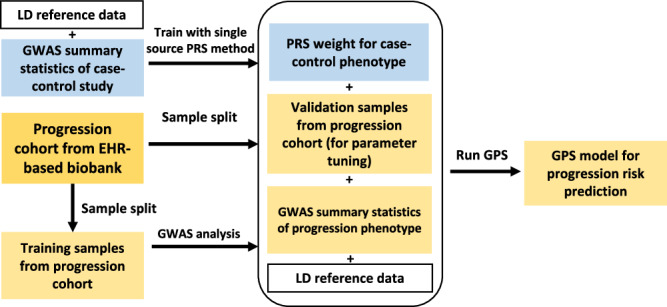
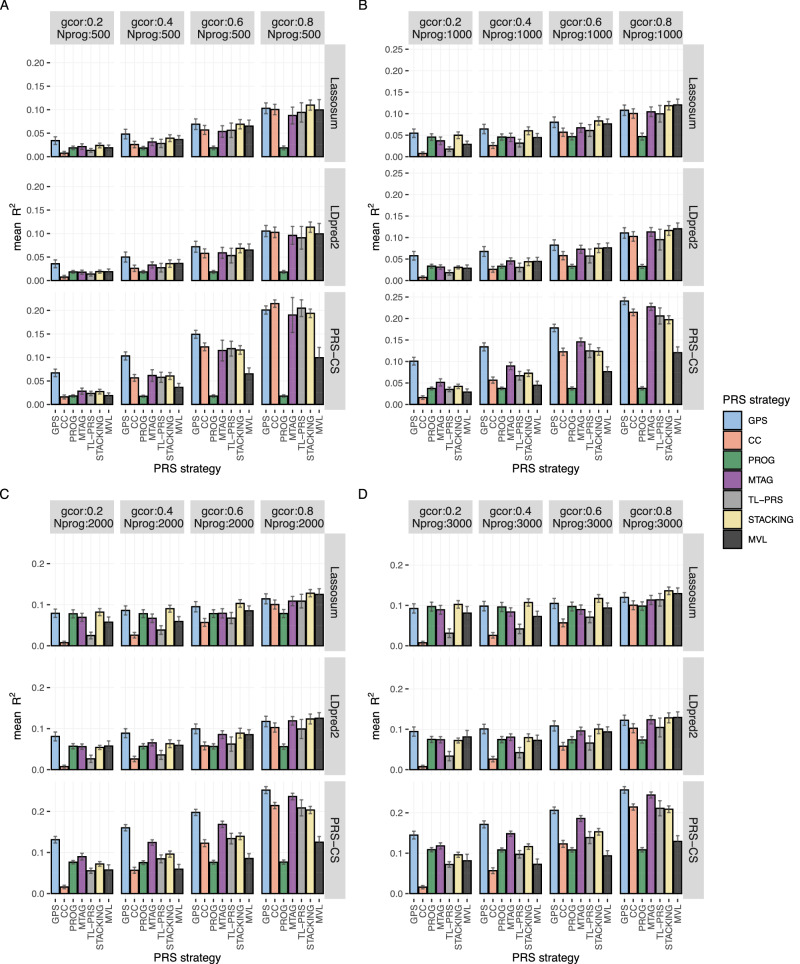
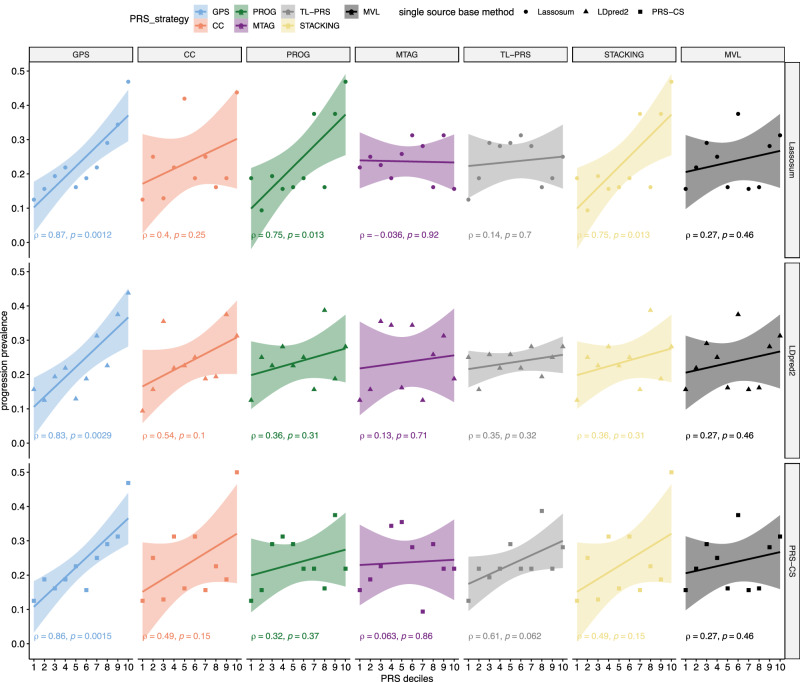
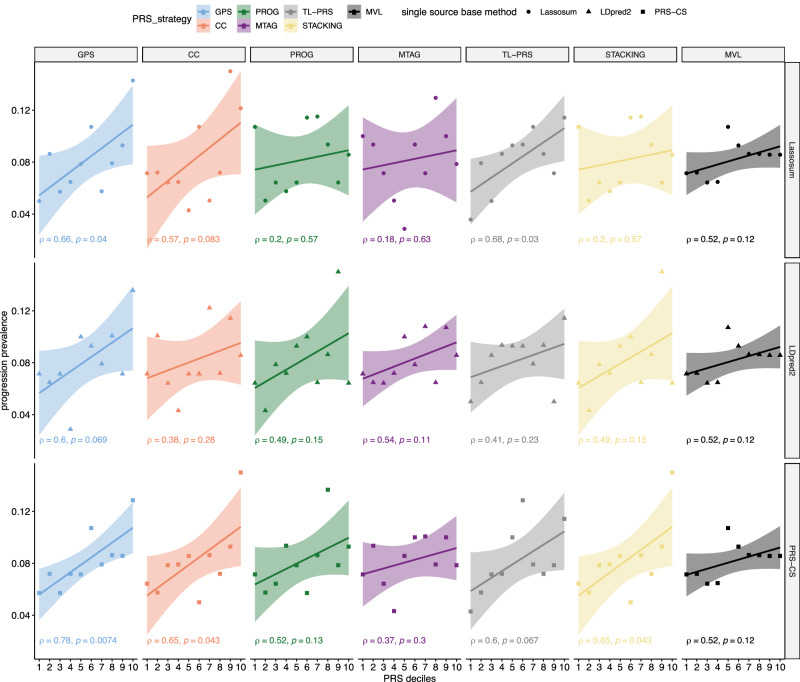
Autoimmune diseases often exhibit a preclinical stage before diagnosis. Electronic health record (EHR) based-biobanks contain genetic data and diagnostic information, which can identify preclinical individuals at risk for progression. Biobanks typically have small numbers of cases, which are not sufficient to construct accurate polygenic risk scores (PRS). Importantly, progression and case-control phenotypes may have shared genetic basis, which we can exploit to improve prediction accuracy. We propose a novel method Genetic Progression Score (GPS) that integrates biobank and case-control study to predict the disease progression risk. Via penalized regression, GPS incorporates PRS weights for case-control studies as prior and forces model parameters to be similar to the prior if the prior improves prediction accuracy. In simulations, GPS consistently yields better prediction accuracy than alternative strategies relying on biobank or case-control samples only and those combining biobank and case-control samples. The improvement is particularly evident when biobank sample is smaller or the genetic correlation is lower. We derive PRS for the progression from preclinical rheumatoid arthritis and systemic lupus erythematosus in the BioVU biobank and validate them in All of Us. For both diseases, GPS achieves the highest prediction and the resulting PRS yields the strongest correlation with progression prevalence.
© 2024. The Author(s).
Conflict of interest statement
Competing interests: The authors declare no competing interests.
Figures
Similar articles
-
Efficient Implementation of Penalized Regression for Genetic Risk Prediction.Genetics. 2019 May;212(1):65-74. doi: 10.1534/genetics.119.302019. Epub 2019 Feb 26. Genetics. 2019. PMID: 30808621 Free PMC article.
-
Genetic relationships between systemic lupus erythematosus and a positive antinuclear antibody test in the absence of autoimmune disease.Lupus Sci Med. 2025 Jun 12;12(1):e001476. doi: 10.1136/lupus-2024-001476. Lupus Sci Med. 2025. PMID: 40514052 Free PMC article.
-
Phenotype integration improves power and preserves specificity in biobank-based genetic studies of major depressive disorder.Nat Genet. 2023 Dec;55(12):2082-2093. doi: 10.1038/s41588-023-01559-9. Epub 2023 Nov 20. Nat Genet. 2023. PMID: 37985818 Free PMC article.
-
A survey of genome-wide association studies, polygenic scores and UK Biobank highlights resources for autoimmune disease genetics.Front Immunol. 2022 Aug 5;13:972107. doi: 10.3389/fimmu.2022.972107. eCollection 2022. Front Immunol. 2022. PMID: 35990650 Free PMC article. Review.
-
Clinical implications of shared genetics and pathogenesis in autoimmune diseases.Nat Rev Endocrinol. 2013 Nov;9(11):646-59. doi: 10.1038/nrendo.2013.161. Epub 2013 Aug 20. Nat Rev Endocrinol. 2013. PMID: 23959365 Review.
Cited by
-
Medical laboratory data-based models: opportunities, obstacles, and solutions.J Transl Med. 2025 Jul 24;23(1):823. doi: 10.1186/s12967-025-06802-x. J Transl Med. 2025. PMID: 40707923 Free PMC article. Review.
References
-
- Arbuckle, M. R. et al. Development of autoantibodies before the clinical onset of systemic lupus erythematosus. N. Engl. J. Med.349, 1526–1533 (2003). - PubMed
-
- Herman, C. R., Gill, H. K., Eng, J. & Fajardo, L. L. Screening for preclinical disease: test and disease characteristics. Am. J. Roentgenol.179, 825–831 (2002). - PubMed
-
- Aho, K., Heliövaara, M., Maatela, J., Tuomi, T. & Palosuo, T. Rheumatoid factors antedating clinical rheumatoid arthritis. J. Rheumatol.18, 1282–1284 (1991). - PubMed
Publication types
MeSH terms
Grants and funding
- S10 OD017985/OD/NIH HHS/United States
- UL1 TR000445/TR/NCATS NIH HHS/United States
- OT2 OD026556/OD/NIH HHS/United States
- R01 HL173869/HL/NHLBI NIH HHS/United States
- R01HL173869/U.S. Department of Health & Human Services | NIH | National Heart, Lung, and Blood Institute (NHLBI)
- U2C OD023196/OD/NIH HHS/United States
- OT2 OD025315/OD/NIH HHS/United States
- U24 OD023121/OD/NIH HHS/United States
- OT2 OD026552/OD/NIH HHS/United States
- OT2 OD026549/OD/NIH HHS/United States
- OT2 OD025277/OD/NIH HHS/United States
- RC2 GM092618/GM/NIGMS NIH HHS/United States
- OT2 OD026554/OD/NIH HHS/United States
- R01AI174108/U.S. Department of Health & Human Services | National Institutes of Health (NIH)
- OT2 OD023206/OD/NIH HHS/United States
- R01 ES036042/ES/NIEHS NIH HHS/United States
- U24 OD023176/OD/NIH HHS/United States
- OT2 OD026548/OD/NIH HHS/United States
- U19 HL065962/HL/NHLBI NIH HHS/United States
- U01AI185638/U.S. Department of Health & Human Services | National Institutes of Health (NIH)
- R01 AI174108/AI/NIAID NIH HHS/United States
- S10 RR025141/RR/NCRR NIH HHS/United States
- OT2 OD026551/OD/NIH HHS/United States
- F30 GM151848/GM/NIGMS NIH HHS/United States
- R01HG011035/U.S. Department of Health & Human Services | NIH | National Human Genome Research Institute (NHGRI)
- OT2 OD025337/OD/NIH HHS/United States
- U01AI176135/U.S. Department of Health & Human Services | NIH | National Institute of Allergy and Infectious Diseases (NIAID)
- OT2 OD026555/OD/NIH HHS/United States
- OT2 OD026550/OD/NIH HHS/United States
- R01 HD074711/HD/NICHD NIH HHS/United States
- OT2 OD026553/OD/NIH HHS/United States
- P50 GM115305/GM/NIGMS NIH HHS/United States
- OT2 OD023205/OD/NIH HHS/United States
- R01ES036042/U.S. Department of Health & Human Services | National Institutes of Health (NIH)
- U01 AI185638/AI/NIAID NIH HHS/United States
- U01 HG006378/HG/NHGRI NIH HHS/United States
- U01 AI176135/AI/NIAID NIH HHS/United States
- OT2 OD025276/OD/NIH HHS/United States
- UL1 RR024975/RR/NCRR NIH HHS/United States
- R01 NS032830/NS/NINDS NIH HHS/United States
- U01 HG004798/HG/NHGRI NIH HHS/United States
- OT2 OD026557/OD/NIH HHS/United States
- UL1 TR002243/TR/NCATS NIH HHS/United States
- R01 HG011035/HG/NHGRI NIH HHS/United States
- U24 OD023163/OD/NIH HHS/United States
LinkOut - more resources
Full Text Sources
Medical
