

Spectroscopic, quantum chemical, and topological calculations of the phenylephrine molecule using density functional theory
- PMID: 39747169
- PMCID: PMC11697212
- DOI: 10.1038/s41598-024-81633-2
Spectroscopic, quantum chemical, and topological calculations of the phenylephrine molecule using density functional theory
Abstract
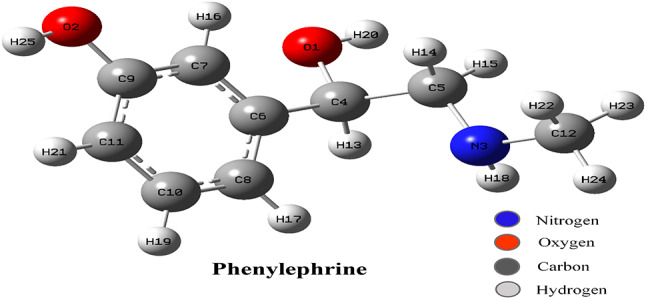
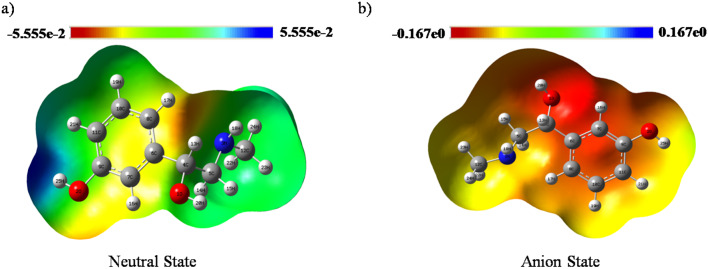
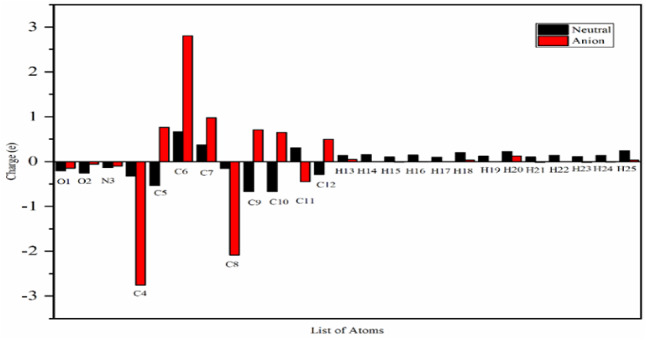
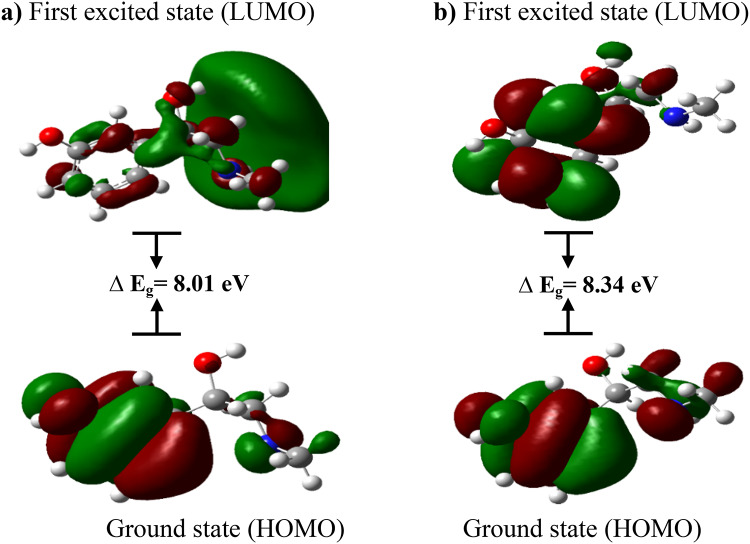
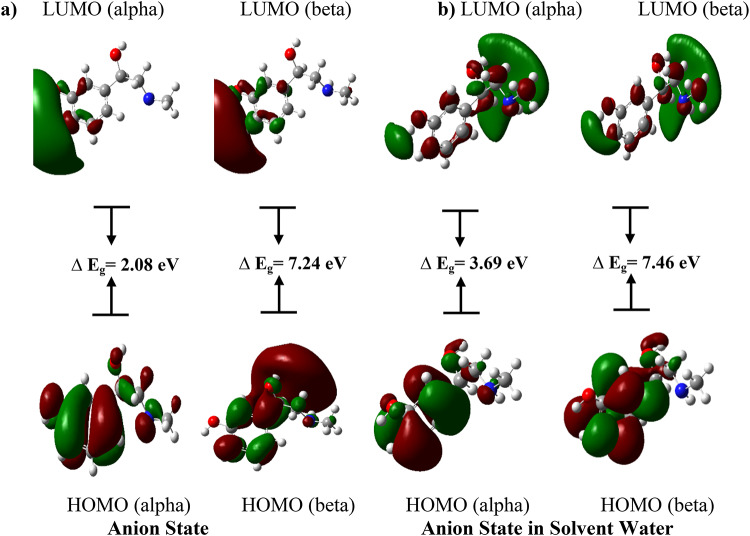
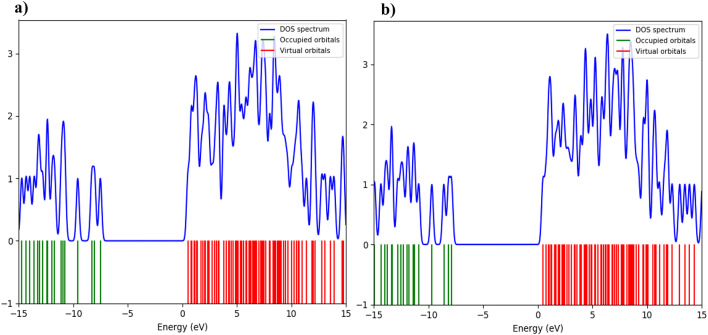
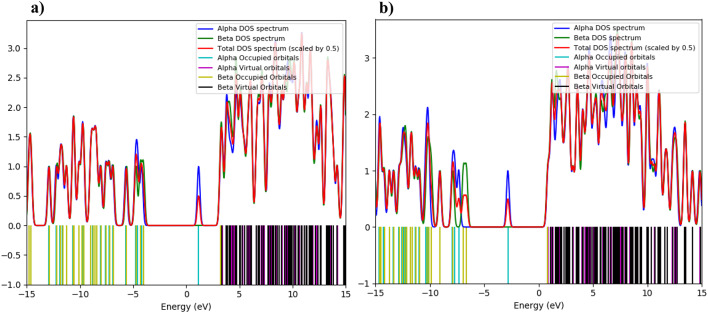
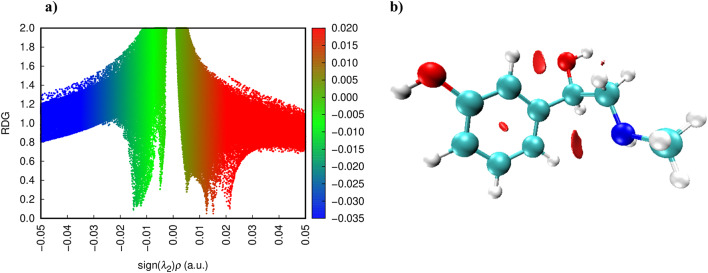
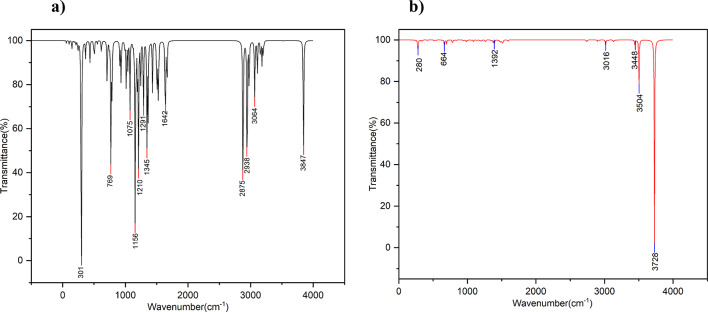
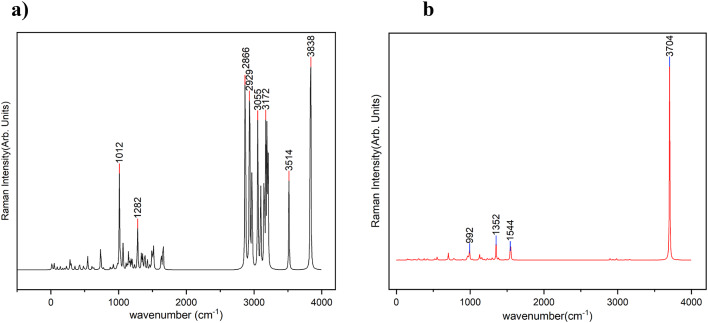
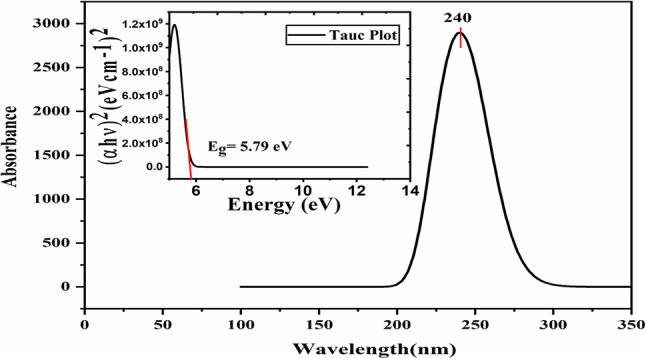
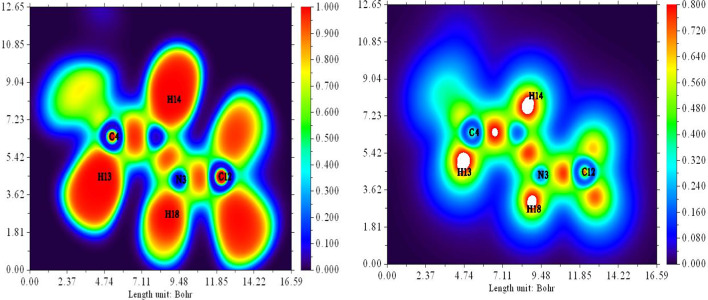
In this work, Density Functional Theory (DFT) on Gaussian 09 W software was utilized to investigate the phenylephrine (PE) molecule (C9H13NO2). Firstly, the optimized structure of the PE molecule was obtained using B3LYP/6-311 + G (d, p) and CAM-B3LYP/6-311 + G (d, p) basis sets. The electron charge density is shown in Mulliken atomic charge as a bar chart and also as a color-filled map in Molecular Electrostatic Potential (MEP). Using these properties, the possibility of different charge transfers occurring within the molecule was evaluated. The calculated values of the energy gap from HOMO-LUMO mapping, illustrated in Frontier Molecular Orbitals (FMO) and Density of State (DOS), were found to be similar for both the neutral and anion states in the gaseous and water solvent phases. Both the global and local reactivity were studied to understand the reactivity of the PE molecule. Using the thermodynamic parameters, the thermochemical property of the title molecule was understood. Non-covalent interaction was studied to understand the Van der Waals interactions, hydrogen bonds, and steric repulsion in the title molecule. Natural Bond Orbital (NBO) Analysis was performed to understand the strongest stabilization interaction. In the vibrational analysis, Total Electron Density (TED) assignments were done in the intense region where the frequency of the title molecule was shifted distinctly. For vibrational spectroscopy, FT-IR and Raman spectra in the neutral and anion states were plotted and compared. Using the TD-DFT technique, the UV-Vis spectra along with Tauc's plot were studied. Finally, topological analysis, electron localized function (ELF), and localized orbital locator (LOL) were performed in the PE molecule.
Keywords: DOS; ELF and LOL; HOMO-LUMO; MEP; NBO; TD-DFT; TED; UV-Vis.
© 2024. The Author(s).
Conflict of interest statement
Declarations. Conflict of interest: The authors declare that they have ‘no known conflict of interests or personal relationships’ that could have appeared to influence the work reported in this paper.. Ethics approval: Not Applicable (as the results of studies do not involve any human or animal). Consent to participate: Not Applicable (as the results of studies do not involve any human or animal).
Figures
Similar articles
-
Molecular simulation, vibrational spectroscopy and global reactivity descriptors of pseudoephedrine molecule in different phases and states.Heliyon. 2023 Mar 21;9(3):e14801. doi: 10.1016/j.heliyon.2023.e14801. eCollection 2023 Mar. Heliyon. 2023. PMID: 37101481 Free PMC article.
-
Physical analysis of aspirin in different phases and states using density functional theory.Heliyon. 2024 Jun 7;10(11):e32610. doi: 10.1016/j.heliyon.2024.e32610. eCollection 2024 Jun 15. Heliyon. 2024. PMID: 38961960 Free PMC article.
-
Spectroscopic profiling, DFT computations, molecular docking and molecular dynamic simulation of biologically active 5-isoquinolinesulfonic acid.J Biomol Struct Dyn. 2023 Feb;41(2):722-735. doi: 10.1080/07391102.2021.2011417. Epub 2021 Dec 9. J Biomol Struct Dyn. 2023. PMID: 34882072
-
The spectroscopic (FT-IR, FT-Raman, dispersive Raman and NMR) study of ethyl-6-chloronicotinate molecule by combined density functional theory.Spectrochim Acta A Mol Biomol Spectrosc. 2016 Jan 15;153:754-70. doi: 10.1016/j.saa.2015.09.007. Epub 2015 Sep 21. Spectrochim Acta A Mol Biomol Spectrosc. 2016. PMID: 26483317
-
Quantum mechanical study and spectroscopic (FT-IR, FT-Raman, UV-Visible) study, potential energy surface scan, Fukui function analysis and HOMO-LUMO analysis of 3-tert-butyl-4-methoxyphenol by DFT methods.Spectrochim Acta A Mol Biomol Spectrosc. 2014 Sep 15;130:604-20. doi: 10.1016/j.saa.2014.04.058. Epub 2014 Apr 20. Spectrochim Acta A Mol Biomol Spectrosc. 2014. PMID: 24813291
Cited by
-
The impact of urbanization on land use land cover change using geographic information system and remote sensing: a case of Mizan Aman City Southwest Ethiopia.Sci Rep. 2025 Apr 8;15(1):12014. doi: 10.1038/s41598-025-94189-6. Sci Rep. 2025. PMID: 40199909 Free PMC article.
-
Quantum physical analysis of caffeine and nicotine in CCL4 and DMSO solvent using density functional theory.Sci Rep. 2025 Mar 26;15(1):10372. doi: 10.1038/s41598-025-91211-9. Sci Rep. 2025. PMID: 40140665 Free PMC article.
-
Blockchain based electronic educational document management with role-based access control using machine learning model.Sci Rep. 2025 May 29;15(1):18828. doi: 10.1038/s41598-025-99683-5. Sci Rep. 2025. PMID: 40442245 Free PMC article.
References
-
- Andersen, A. M. The crystal and molecular structure of (–)-phenylephrine. Acta chem. Scand.30, 193–197 (1976).
-
- Hendeles, L. Selecting a decongestant. Pharmacotherapy: J. Hum. Pharmacol. Drug Therapy. 13 (6P2), 129S–134S (1993). - PubMed
-
- Hatton, R. C., Winterstein, A. G., McKelvey, R. P., Shuster, J. & Hendeles, L. Ambulatory care: efficacy and safety of oral phenylephrine: systematic review and Meta-analysis. Ann. Pharmacother.41 (3), 381–390 (2007). - PubMed
-
- Ahmed, A. M. K., Anwar, S. M. & Hattab, A. H. Spectrophotometric determination of phenylephrine hydrochloride in pharmaceutical preparations by oxidative coupling reaction. Int. J. Drug Delivery Technol.10, 323–327 (2020).
-
- Magder, S. Phenylephrine and tangible bias. Anesth. Analgesia. 113 (2), 211–213 (2011). 10.1213/ANE.0b013e318220406a. - PubMed
LinkOut - more resources
Full Text Sources
Miscellaneous
