. 2025 Jan 2;16(1):173.
doi: 10.1038/s41467-024-55596-x.

Targeting pleuro-alveolar junctions reverses lung fibrosis in mice

Affiliations

Targeting pleuro-alveolar junctions reverses lung fibrosis in mice

Adrian Fischer et al. Nat Commun. .

Erratum in

  • Author Correction: Targeting pleuro-alveolar junctions reverses lung fibrosis in mice.
    Fischer A, Han W, Hu S, Mück-Häusl M, Wannemacher J, Kadri S, Lin Y, Dai R, Christ S, Su Y, Dasgupta B, Sardogan A, Deisenhofer C, Dutta S, Kadri A, Güney TG, Correa-Gallegos D, Mayr CH, Hatz R, Stoleriu MG, Lindner M, Hilgendorff A, Adler H, Machens HG, Schiller HB, Hauck SM, Rinkevich Y. Fischer A, et al. Nat Commun. 2025 Feb 24;16(1):1911. doi: 10.1038/s41467-025-57261-3. Nat Commun. 2025. PMID: 39994215 Free PMC article. No abstract available.

Abstract

Lung fibrosis development utilizes alveolar macrophages, with mechanisms that are incompletely understood. Here, we fate map connective tissue during mouse lung fibrosis and observe disassembly and transfer of connective tissue macromolecules from pleuro-alveolar junctions (PAJs) into deep lung tissue, to activate fibroblasts and fibrosis. Disassembly and transfer of PAJ macromolecules into deep lung tissue occurs by alveolar macrophages, activating cysteine-type proteolysis on pleural mesothelium. The PAJ niche and the disassembly cascade is active in patient lung biopsies, persists in chronic fibrosis models, and wanes down in acute fibrosis models. Pleural-specific viral therapeutic carrying the cysteine protease inhibitor Cystatin A shuts down PAJ disassembly, reverses fibrosis and regenerates chronic fibrotic lungs. Targeting PAJ disassembly by targeting the pleura may provide a unique therapeutic avenue to treat lung fibrotic diseases.


Conflict of interest statement

Competing interests: The authors declare the following competing interests: A.F., M.M.H., S.K., and Y.R. have filed patent application EP21206 688.0 covering the use of these methods to study extracellular matrix movement in organ fibrosis. The remaining authors declare no competing interests.

Figures
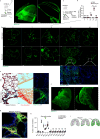
Fig. 1
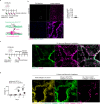
Fig. 1. Extracellular matrix -fate mapping reveals inward matrix transfer during lung injury.
a Schematic representation of the pleural matrix fate mapping setup. C57BL/6J mice were intrapleurally injected with NHS-FITC labelling mix and two weeks later lungs were harvested. b Representative light sheet images of murine lungs two weeks post-intrapleural NHS-FITC injection. n = 6 biological replicates (C57BL/6J WT mice) and three independent experiments. Scale bars: 500 µm. c Schematic representation of bleomycin pleural matrix fate mapping setup. Mice were intrapleurally injected with NHS-FITC labelling mix. The next day bleomycin was applied and lungs were collected after indicated timepoints. d Representative histology images of mouse lungs 3-, 7-, 10-, 14- and 45-days post-bleomycin installation (p.b.i). n = 6 biological replicates (C57BL/6J WT mice) and 5 independent experiments. The graphic above shows relative FITC intensity in the interstitium in control and treated mice at the various timepoints. Data represented are mean ± SD. A two-sided independent T-test was used for the comparison of two groups (Day10: p = 0.00013, Day14: p = 8.61e-05)(***P < 0.001; NS= not significant). Scale bars: 500 µm (Overview); 100 µm (Highlight). e Representative images of mouse lung interstitum 14 days p.b.i. Collagen fibers are stained blue (Masson trichrome) and red (Pico Sirius Red). n = 6 biological replicates (C57BL/6J WT mice) and 6 independent experiments. Scale bars: 50 µm. f Representative light sheet microscopy images of murine lungs two-weeks p.b.i. n = 6 biological replicates (C57BL/6J WT mice) and 6 independent experiments. Scale bars: whole organ 500 µm. g Representative histology images of mouse lungs 14 days p.b.i. Mice were intrapleurally injected with NHS-FITC labelling mix. The next day bleomycin was installed. Regions with NHS-FITC+ and PDGFRα+ signal are highlighted in red. n = 6 biological replicates (C57BL/6 J WT mice) and 6 independent experiments. Scale bars: 50 µm. h Quantification of inflammatory cells (CD45+) and fibroblasts (pSMAD2/3+ and YAPTAZ+) in mouse lungs post-oropharyngeal bleomycin or PBS installation. n = 6 biological replicates (C57BL/6J WT mice) and 6 independent experiments. Data represented are mean ± SD. One-way ANOVA was used for the multiple comparison (NS= not significant). i Schematic representation of bleomycin induced matrix invasion. Upon oropharyngeal bleomycin installation pleural matrix pools invade lung interstitium.
Fig. 2
Fig. 2. Significant interstitial collagens in fibrotic mouse lungs come from distant sites.
a Schematic representation of non-canonical amino acid (ncAAS) protein tracing setup. C57BL/6J mice were intrapleurally injected with NHS-FITC labelling mix and for three consecutive days, ncAAS was injected intra-peritoneally. Lungs were collected four days post-NHS-FITC injection. ncAAS are randomly integrated in newly synthesized proteins and can be detected with a fluorescence probe using Click-iT chemistry. b Representative images of mouse lungs after three days of consecutive ncAAS injections. ncAAS were visualized using Click-iT chemistry. n = 6 biological replicates (C57BL/6J WT mice) and 6 independent experiments. Scale bars: 500 µm (Overview); 50 µm (high magnification). Data represented are mean ± SD. A two-sided independent T-test was used for the comparison of two groups (NS= not significant). c Representative images of mouse lungs 10 days post-NHS-FITC labeling with daily ncAAS injection. n = 6 biological replicates (C57BL/6J WT mice) and 6 independent experiments. Scale bars: 50 µm. d Representative images of mouse lungs intrapleurally labeled with NHS-FITC, 14 days p.b.i. ncAAS were injected daily and visualized using Click-iT chemistry. n = 6 biological replicates (C57BL/6J WT mice) and 6 independent experiments. Scale bars: 100 µm (left) and 50 µm (right). Data represented are mean ± SD. One-way ANOVA was used for the multiple comparison (*** P < 0.001; NS= not significant).
Fig. 3
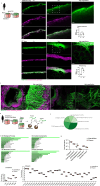
Fig. 3. Lung mesothelium is the source of transferred matrix in injury.
a Schematic representation of genetic pleural collagen protein fate mapping in animals. Mesothelial cells were transduced by intra-pleural injection of AAV particles expressing collagen reporters that monitor mesothelial-specific deposition of collagen. b Representative histology images of mouse lungs three days post-Col1-reporter injection. n = 6 biological (C57BL/6J WT mice) and 6 independent experiments replicates per reporter construct. Scale bars: 500 µm (Overview); 50 µm (high magnification). c Schematic, graphic and representative histology images of mouse lungs 10 and 14 days p.b.i. n = 6 biological (C57BL/6J WT mice) and 6 independent experiments replicates per reporter construct. Scale bars: 1000 µm (Overview); 50 µm (high magnification). Data represented are mean ± SD. A two-sided independent T-test was used for the comparison of two groups (Col1 reporter: p = 1.09e-07, Col2 reporter: p = 1.87e-07, CNA35: p = 4.49e-08)(***P < 0.001). d Schematic representation of the mesothelial-specific fate mapping of collagen protein in bleomycin-induced lung fibrosis. Upon oropharyngeal bleomycin installation pleural matrix pools that include newly deposited collagen (yellow) invade lung interstitium.
Fig. 4
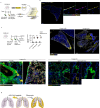
Fig. 4. Human invading matrix resembles scar tissue.
a Schematic representation of human tissue ex vivo assay. Pleural surfaces from human tissue explants where labeled with NHS-FITC and incubated for 24 h. b Representative multiphoton images of NHS-FITC labelled in both peritumor and IPF human lung tissues. Scale bars: 25 µm. n = 5 biological replicates (peritumor human lung tissue or IPF human lung tissue) and 5 independent experiments. A two-sided independent T-test was used for the comparison of two groups (IPF: p = 0.0079)(ns = not significant; **P < 0.01). c Representative high magnification multiphoton images of NHS-FITC labelled in IPF human lung tissues. n = 5 biological replicates (IPF human lung tissue) and 5 independent experiments. Scale bars: 100 µm and 20 µm. d Schematic representation of proteomic identification of NHS-EZ-LINK+ transferred human matrix components. e Identified matrisomal proteins in mass spectrometry analysis. f GO enrichments of matrisome proteins identified in mass spectrometry analysis. Moved NHS+-ECM shows similarity to atrophic scar tissue. g Identified matrisome proteins in mass spectrometry analysis of NHS-EZ-LINK-Biotin+ proteins. Showing which NHS + -ECM elements are enriched in pleura and interstitium after 24 h. n = five biological replicates and 5 independent experiments. Data represented are mean ± SD. Single comparison was performed by two-sided independent T-test (ECM regulators: p = 2.16e-07)(***P < 0.001).
Fig. 5
Fig. 5. AMs initiate matrix transfer by activating mesothelium through IL-18.
a Representative immunolabeling histology images of IL-18 receptor expression in murine and human IPF lungs. n = five biological replicates (C57BL/6J WT mice) and 3 independent experiments. Scale bars: 50 µm (murine); 20 µm (human). b Representative immunolabeling histology image of IL-18 expression in lungs 1, 7, 10 and 14 days p.b.i. or 15 days post-herpes virus installation. n = 3 biological replicates (C57BL/6J WT mice) and 3 independent experiments. Scale bars: 100 µm(10x); 50 µm(20x). Data represented are mean ± SD. A two-sided independent T-test was used for the comparison of two groups (p.b.i.: Day 1:p = 0.000138, Day 7:p = 0.000663, Day 14:p = 0.0004998)(post-herpes virus: Day 15: p = 8.34e-05, Day 45: p = 7.34e-06)(***P < 0.001). c Representative immunolabeling histology image showing contrast of IL-18 expression in lung interstitium compared to surface 14 days p.b.i. n = five biological replicates (C57BL/6J WT mice) and 3 independent experiments. bars: 50 µm. d Representative immunolabeling histology images against IL-18 in combination with CD45 and CD11c in lungs 14 days p.b.i. or human IPF lung tissue. n = 3 biological replicates (C57BL/6J WT mice) and 3 independent experiments. Data represented are mean ± SD. A two-sided independent T-test was used for the comparison of two groups (***P < 0.001). Scale bars: 50 µm. e Representative histology images of mouse lung tissue with NHS-FITC+ marked pleural site cultivated ex vivo with 10 ng/ml recombinant IL-18 or in trans wells with macrophages and 100 ng/ml IL-18 Receptor-blocking antibody for 48 h. Data represented are mean ± SD. n = five biological replicates and 6 independent experiments. One-way ANOVA was used for the multiple comparison (***P < 0.001). Scale bars: 25 µm. f Flowchart of ex vivo mouse lungs coculture with IL-18+ macrophages using transwell. Created in BioRender. Han, W. (2024) https://BioRender.com/y450579.
Fig. 6
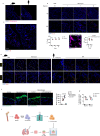
Fig. 6. Mesothelial Cathepsin B drives pleural matrix transfer and pulmonary fibrosis.
a scRNA-Seq data from bleomycin-installed mice and ILD patients. b Representative immunolabeling of Cathepsin histology images of ex vivo mouse lungs treated with IL-18 or transwell coculture with IL-18high Macrophages. n = 10 biological replicates (C57BL/6J WT mice) and 5 independent experiments. Scale bars: 20 µm. c, d Representative immunolabeling histology images of Cathepsin B in mouse lungs 7, 14 and 45 days p.b.i. or 15 days post-herpes virus. n = 10 biological replicates (C57BL/6J WT mice or IFN-γ-R/ mice) and 5 independent experiments. p.b.i.: Day 7: p = 5.71e-10, Day14: p = 8.59e-11; post-herpes virus: Day15: p = 7.32e-12, Day 45: p = 1.59e-16. Scale bars: 50 µm. e Representative histology images of mouse lungs 14 days p.b.i. Mice were intrapleurally injected with NHS-FITC labelling mix. The next day bleomycin was installed and cathepsin B inhibitor were applied every other day in 10 µm concentration, DMSO acted as control. Log-rank test was used for statistical comparison. n = 6 biological replicates (C57BL/6J WT mice) and 3 independent experiments. Scale bars: 1000 µm (Fluorescence); 100 µm (Histology). f Survival of mice in (e). Log-rank test was used for statistical comparison. g Representative immunolabeling histology images of Cathepsin B and its inhibitor Cystatin A in mouse lungs 3 days post-intrapleural AAV injection. n = 6 biological (C57BL/6J WT mice) and 6 independent experiments. Scale bars: 500 µm; high magnification: 20 µm. h Representative histology images of mouse lungs 14 days p.b.i. Mice were intrapleurally injected with NHS-FITC labelling mix. AAV particles encoding for Cathepsin B inhibitor Cystatin A were also applied intrapleurally; then, five days later bleomycin was installed. For Cathepsin B coding AAVs no bleomycin was applied. n= six biological replicates (C57BL/6J WT mice) and 3 independent experiments. Masson trichrome was used to visualize structural changes, pSMAD2/3 staining visualized fibroblast activation. FITC: p = 1.69e-07, pSAMD: p = 6.84e-13. Scale bars: Fluorescence 1000 µm (Overview); 100 µm (pSMAD2/3 staining); Masson Trichrome 100 µm. i Bodyweight and survival of mice in (h). Log-rank test was used for statistical comparison. j Schematic representation of AAV-Cystatin mediated intervention in bleomycin lung fibrosis model experiment. Mice were treated with bleomycin and seven days later, mice were intrapleurally injected with AAV-Cystatin A. k Representative histology- and pSMAD2/3 immuno- staining images 24 days and bodyweights of animals after bleomycin treatment. n = 6 biological replicates (C57BL/6J WT mice) and 3 independent experiments. Scale bars: immunostainings: 100 µm; Masson trichrome 100 µm. Log-rank test was used for statistical comparison of bodyweights. pSAMD: p = 9.46e-11. l Schematic representation of AAV-Cystatin mediated intervention in herpes virus lung fibrosis model. Mice were treated with herpes virus and 45 days later, mice were intrapleurally injected with AAV-Cystatin A. m Representative histology- and pSMAD2/3 immuno- staining images 90 days after Herpes virus treatment. n = 6 biological replicates (IFN-γ-R/ mice) and 3 independent experiments. Scale bars: immunostainings: 100 µm; Masson trichrome 50 µm. pSAMD: p = 2.54e-09. All data represented in Fig. 6 are mean ± SD. One-way ANOVA was used for the multiple comparison. Single comparison was performed by two-sided independent T-test. (***P < 0.001; NS= not significant).
Fig. 7
Fig. 7. Revised model of lung fibrosis development.
Schematic representation of lung fibrosis development. a A monolayer of mesothelium (shown in pink) encapsulates a thin layer of matrix reservoir (shown in green) in healthy lungs. b Lung injury activates alveolar macrophages to secrete IL-18. IL-18 triggers surface mesothelium through IL-18 receptor. c Surface mesothelium produces Cathepsin B that liberates pleural matrix pools, triggering matrix transfer inwards. d Invaded matrix changes interstitial environment, which in turn activates fibroblasts and forming of pulmonary fibrosis.

References

    1. White, E. S. Lung extracellular matrix and fibroblast function. Ann. Am. Thorac. Soc.12, S30–S33 (2015). - PMC - PubMed
    1. Chambers, R. C. & Mercer, P. F. Mechanisms of alveolar epithelial injury, repair, and fibrosis. Ann. Am. Thorac. Soc.12, S16–S20 (2015). - PMC - PubMed
    1. Upagupta, C., Shimbori, C., Alsilmi, R. & Kolb, M. Matrix abnormalities in pulmonary fibrosis. Eur. Respir. Rev.27, 10.1183/16000617.0033-2018 (2018). - PMC - PubMed
    1. Grillo, F., Barisione, E., Ball, L., Mastracci, L. & Fiocca, R. Lung fibrosis: an undervalued finding in COVID-19 pathological series. Lancet Infect. Dis.21, e72 (2021). - PMC - PubMed
    1. Zhang, P. et al. Long-term bone and lung consequences associated with hospital-acquired severe acute respiratory syndrome: a 15-year follow-up from a prospective cohort study. Bone Res.8, 8 (2020). - PMC - PubMed

Publication types