. 2025 Jan 2;15(1):325.
doi: 10.1038/s41598-024-83460-x.

Deficiency in NPC2 results in disruption of mitochondria-late endosome/lysosomes contact sites and endo-lysosomal lipid dyshomeostasis

Affiliations

Deficiency in NPC2 results in disruption of mitochondria-late endosome/lysosomes contact sites and endo-lysosomal lipid dyshomeostasis

Raffaele Pastore et al. Sci Rep. .

Abstract

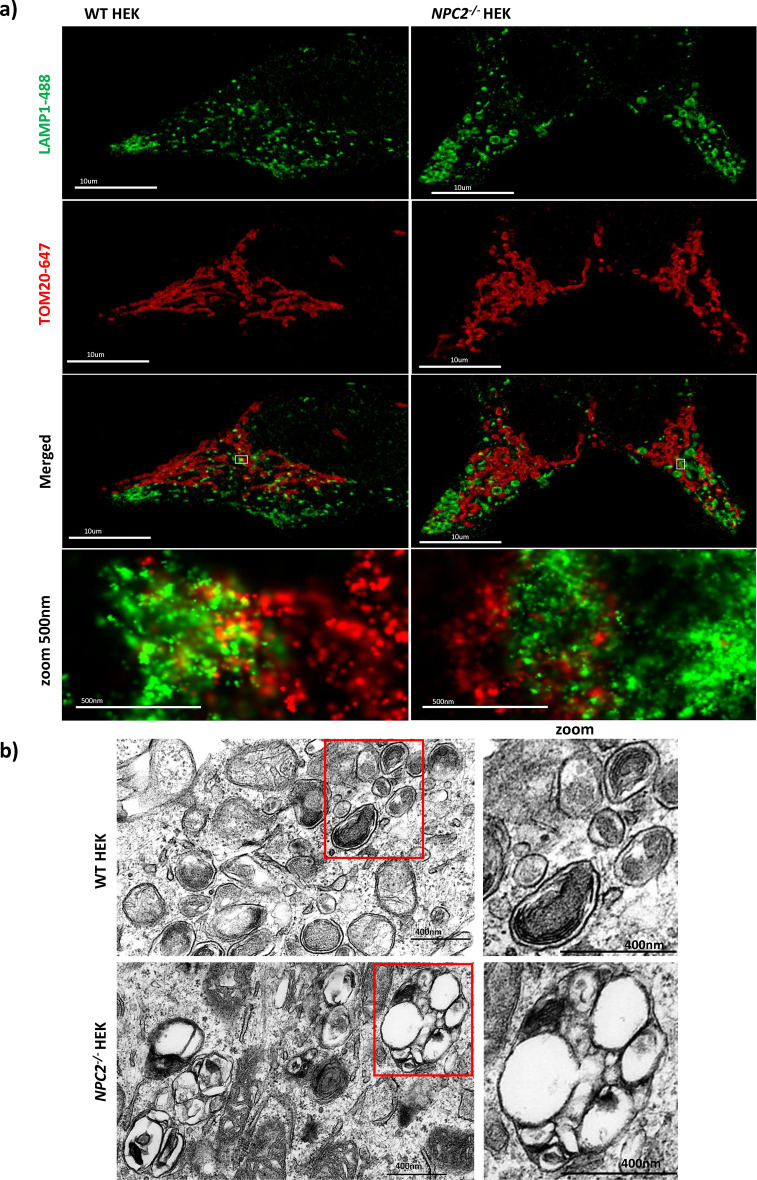
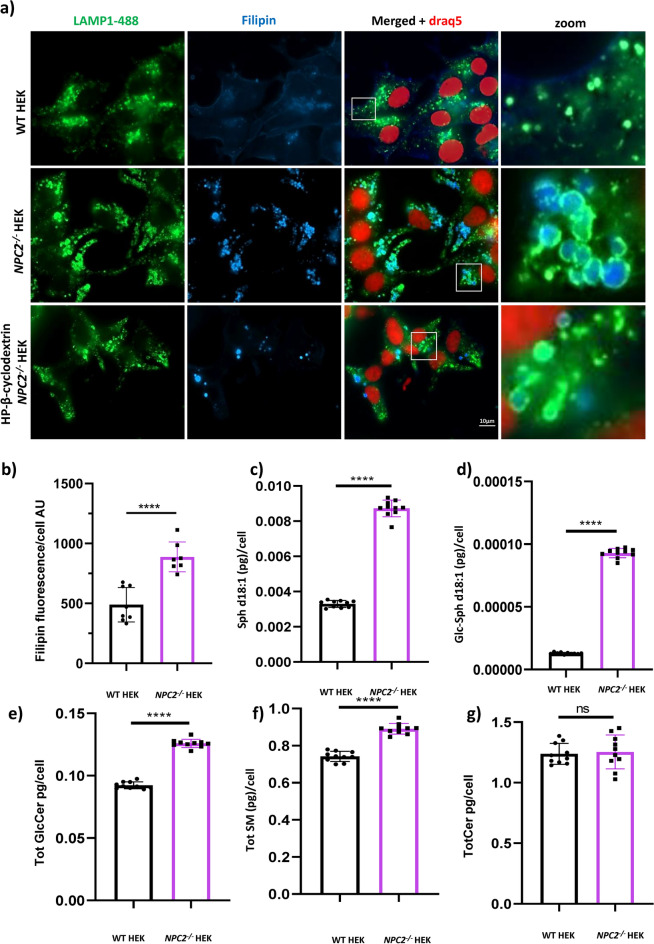
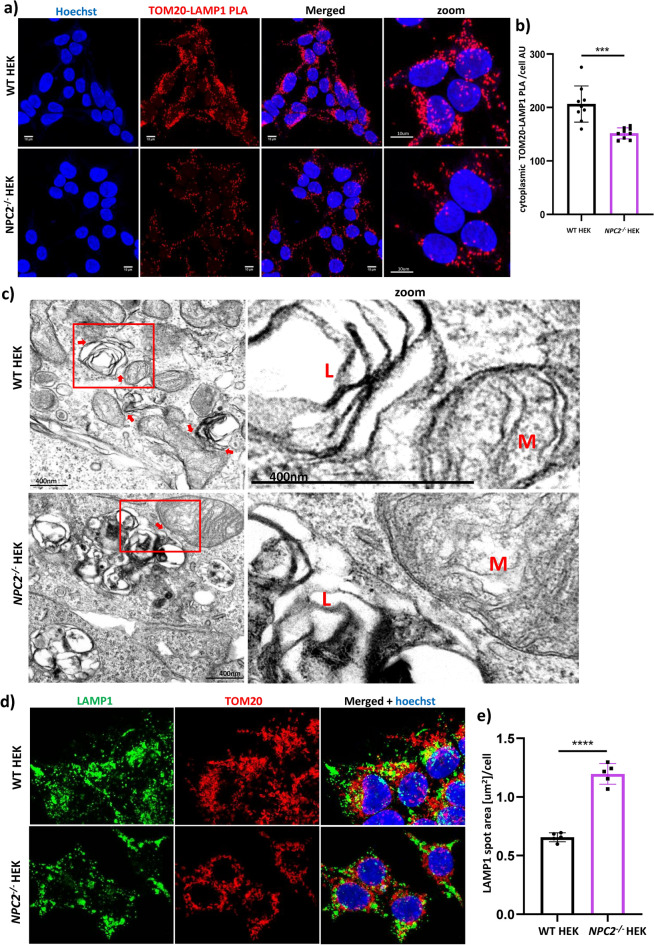
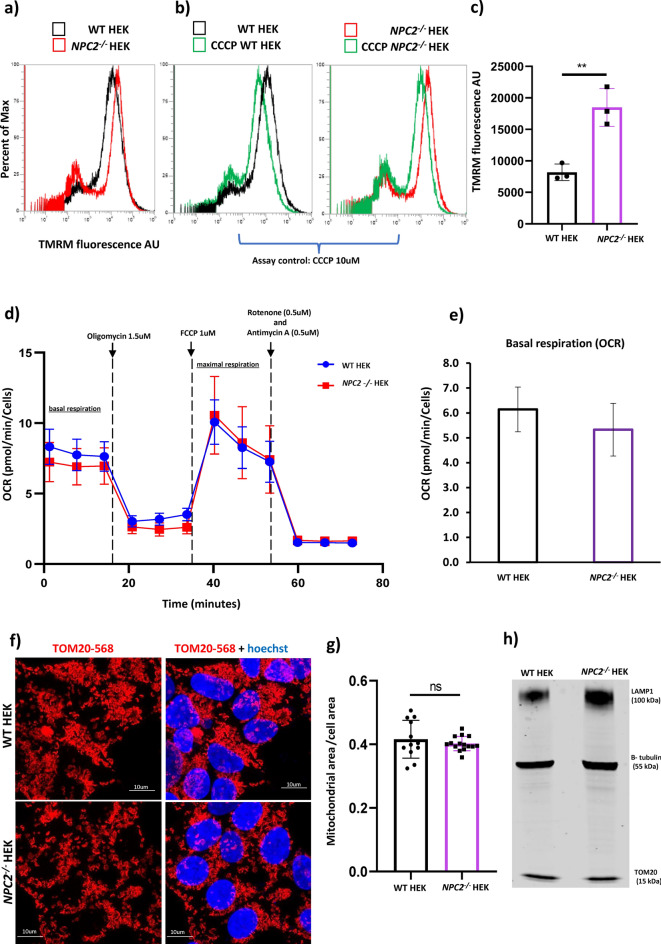
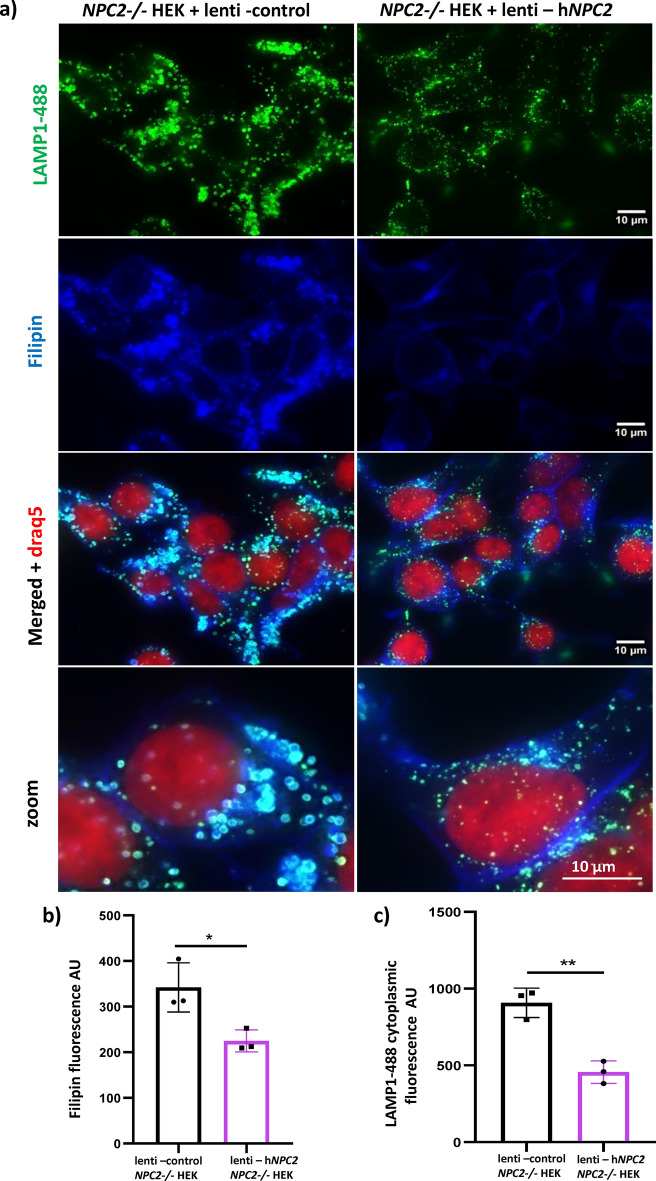
Dysfunction of the endo-lysosomal intracellular Cholesterol transporter 2 protein (NPC2) leads to the onset of Niemann-Pick Disease Type C (NPC), a lysosomal storage disorder. Metabolic and homeostatic mechanisms are disrupted in lysosomal storage disorders (LSDs) hence we characterized a cellular model of NPC2 knock out, to assess alterations in organellar function and inter-organellar crosstalk between mitochondria and lysosomes. We performed characterization of lipid alterations and confirmed altered lysosomal morphology, but no overt changes in oxidative stress markers. Using several techniques, we demonstrated that contacts between mitochondria and late endosomes/lysosomes are reduced in NPC2-/- HEK cells, we observed that the acidic compartments are swollen and lipid dense. Quantification of endogenous lipids in HEKNPC2-/- cells by mass spectrometry reveals accumulation of lipid species indicative of sphingolipid metabolic dysregulation within the lysosome. Specifically, HEK NPC2-/- cells exhibit marked elevation of glucosylsphingosine and glucosylceramides, substrates of beta glucocerebroside (GBA), as well as accumulation of sphingosine and sphingomyelins. Our studies suggest an involvement of NPC2 in the formation of contact sites between mitochondria and lysosomes and support the hypothesis of a role for NPC2 in the endo-lysosomal trafficking pathway and dynamic organellar crosstalk.


Conflict of interest statement

Declarations. Competing interests: Authors are employees of Merck Sharp & Dohme Corp., a subsidiary of Merck & Co., Inc., Kenilworth, NJ, USA and may hold stocks and/or stock options in Merck & Co., Inc., Kenilworth, NJ, USA.

Figures

Fig. 1
Fig. 1
Morphology of late endosomes/lysosomes in WT and NPC2−/− HEK cell lines. a dSTORM (direct Stochastic Optical Reconstruction Microscopy) images of 4% PFA fixed WT and NPC2−/− HEK cells co-stained with antibodies against endogenous TOM20 (red; outer mitochondrial membrane) and LAMP1 (green; lysosomal membrane). Images were acquired with the ONI microscope. For each cell line, WT HEK and NPC2−/− HEK, the mitochondrial and late endosomal/lysosomal networks are represented. Scale bar = 10 µm. The insets (bottom row) show contact sites between the lysosomal and the outer mitochondrial membranes with more overlap in the WT cells. Scale bar = 500 nm. b TEM representative images of late endosomes/lysosomes in WT HEK (top row) and NPC2−/− HEK (bottom row). Scale bar = 400 nm.
Fig. 2
Fig. 2
Lipid dyshomeostasis in NPC2−/− HEKs. a Representative epifluorescence images of untreated WT HEKs, NPC2−/− HEKs and HP-β-cyclodextrin treated NPC2−/− HEKs, labelled with the fluorescent probe filipin (blue) to mark free cholesterol, DRAQ5-647 (red) to stain the nucleus and an antibody to LAMP1 to mark the late endosomal/lysosomal membrane (green). Insets (bottom row) show late endosomes of the NPC2−/− HEKs co-stained with LAMP1 and filipin (unesterified cholesterol) whereas no filipin is detectable in late endosomes of WT HEK. b Quantification of the filipin fluorescence intensity (unesterified cholesterol) detected in WT andNPC2−/− HEKs. AU = arbitrary units cg Mass spectrometry quantitation of the levels of: c Sphingosine (Sph d18:1); d Glucosylsphingosine (GlcSph d18:1); e Total Glucosylceramide (sum of GlcCer chain length species d16:0, d18:0, d20:0, d22:0, d24:0, d24:1); f Total Sphingomyelin (sum of SM chain length species d16:0, d18:0, d20:0, d22:0, d24:0, d24:1) and g Total Ceramide (sum of Cer chain length species d16:0, d18:0, d20:0, d22:0, d24:0, d24:1) in WT and NPC2−/− HEKs. Mass- spec data are reported as pg/cell and expressed as mean +/- standard deviation (SD). ****p < 0.0001; **p < 0.01; ns = not significant. p values were calculated with the Student’s T test. Each dot of the graphs indicates a technical replicate (10) replicates used.
Fig. 3
Fig. 3
Study of the membrane contact sites between mitochondria and late endosomes/lysosomes in WT HEK and NPC2−/− HEK. a representative confocal images of fluorescent Proximity Ligation Assay (PLA) performed on WT HEK and NPC2−/− HEK cells labelled with primary antibodies against LAMP1 (late endosomes/lysosomes) and TOM20 (outer mitochondrial membrane). Red dots = fluorescent TOM20-LAMP1 PLA signal membrane contact sites between mitochondria and lysosomes. Nuclei were stained with Hoechst (blue). Scale bar = 10 µm. b High content analysis of the cytoplasmic TOM20-LAMP1 PLA signal intensity detected in WT HEK and NPC2−/− HEK. AU = arbitrary units. Data are expressed as mean per well (each dot of the bar graph indicates one well of a 96 well plate) + /- SD. ****p < 0.0001. p value was calculated with the Student’s T test. c Transmission Electron microscopy (TEM) panel displaying representative micrographs of WT HEK and NPC2−/− HEK cells. L = late endosome/lysosome; M = mitochondrion; scale bar = 400 nm. Micrographs’ insets (right column) depict contact sites between the outer mitochondrial and the lysosomal membranes in both cell lines. MCSs = membrane contact sites; mito-lyso (mitochondria-late endosomes/lysosomes). d Confocal microscopy images of WT HEK and NPC2−/− HEK cell lines co-stained with an antibody to LAMP1 (λEx = 488 nm, green) and an antibody to TOM20 (λ Ex = 568 nm, red). Nuclei were stained with Hoechst (blue). e High content quantification of the late endosomal /lysosomal size performed in WT HEK and NPC2−/− HEK stained with an antibody to LAMP1. Each dot of the bar graph indicates the mean value per well of the LAMP1 spot area [µm2]/cell detected in one well of a 96 well plate. Data are expressed as mean +/− SD. ****p < 0.0001, calculated with the Student’s T test.
Fig. 4
Fig. 4
Characterization of the mitochondrial function in NPC2−/− HEK. a–d Tetramethylrhodamine ethyl ester (TMRM, red) assay performed by flow cytometry in WT HEK and NPC2−/− HEK cells under basal conditions and after treatment with 10µM carbonyl cyanide-m-chlorophenylhydrazone (CCCP) for 30 min at 37 °C, 5% CO2. CCCP treatment was used as a positive control for the functionality of the TMRM assay. a representative flow cytometry histogram of TMRM experiment carried out in untreated WT HEK and NPC2−/− HEK cells. b representative flow cytometry histogram of TMRM experiment carried out in WT HEK cells either left untreated or treated with 10 µM CCCP. c representative flow cytometry histogram of TMRM experiment carried out in NPC2−/− HEK cells either left untreated or treated with 10 µM CCCP. Percent of Max = percentage of cells stained with TMRM. d Quantification of the TMRM red fluorescence intensity (λEx = 568 nm) detected in WT HEK and NPC2−/−HEK under basal conditions. AU = arbitrary units. Data were collated from three independent experiments. Each dot the bar graph indicates an independent experiment with data expressed as median of the TMRM fluorescence intensity + /- SEM (Standard Error of the Mean); **p < 0.01. p value was calculated using the Student’s T test. e Oxygen Consumption Rate (OCR) determined by Seahorse assay in WT HEK and NPC2−/− HEK under basal conditions (basal mitochondrial respiration) and after treatment with pharmacological modulators of the Electron Transport Chain (ETC) such as 1.5 µM oligomycin, 1.0 µM carbonyl cyanide p-trifluoro methoxy phenylhydrazone FCCP (maximal respiration), 0.5 µM rotenone/0.5 µM antimycin. OCR data were expressed as pMol of oxygen consumed per minute, normalized to the number of cells per well of a XF 96 well plate. f Representative confocal microscopy images of WT HEK and NPC2−/− HEK stained with an antibody against TOM20 (λEx = 568nm, red) to label the mitochondrial network. g Quantification of the area occupied by the mitochondrial network (TOM20-568nm) detected by high content microscopy and depicted in panel f. Data are expressed as µm2 of TOM20-568 nm per cell. h Western blot image displaying the levels of LAMP1 (100kDa) and TOM20 (55 kDa) in WT HEK and NPC2−/− HEK. An antibody against β-tubulin was used as gel loading control.
Fig. 5
Fig. 5
Reconstitution of the NPC2 protein rescues the levels of unesterified cholesterol in the NPC2−/− HEK cells. a Representative epifluorescence images of NPC2−/− HEK cells transduced with lentiviral control particles or lentiviral particles encoding the human NPC2 gene (hNPC2). Cells were labelled with the fluorescent probe filipin (blue) to mark unesterified cholesterol, DRAQ5-647 (red) to stain the nucleus and an antibody to LAMP1 to mark the late endosomal/lysosomal membrane (green, LAMP1-488). b, c Quantification of the filipin fluorescence intensity (unesterified cholesterol) and of the LAMP1-488 cytoplasmic fluorescence intensity (endogenous expression of LAMP1) detected in the experiment described in panel (a). AU = arbitrary units. Data are expressed as mean per well (each dot of the bar graph indicates one well of a 96 well plate) + /− SD. *p < 0.05; **p < 0.01; p value was calculated with the Student’s T test.

Similar articles

References

    1. Vanier, M. T. Niemann–Pick disease type C. Orphanet J. Rare Dis.5, 16. 10.1186/1750-1172-5-16 (2010). - PMC - PubMed
    1. Platt, F. M., d’Azzo, A., Davidson, B. L., Neufeld, E. F. & Tifft, C. J. Lysosomal storage diseases. Nat. Rev. Disease Primers4, 27. 10.1038/s41572-018-0025-4 (2018). - PubMed
    1. Lim, C. Y. et al. ER-lysosome contacts enable cholesterol sensing by mTORC1 and drive aberrant growth signalling in Niemann–Pick type C. Nat. Cell Biol.21, 1206–1218. 10.1038/s41556-019-0391-5 (2019). - PMC - PubMed
    1. Höglinger, D. et al. NPC1 regulates ER contacts with endocytic organelles to mediate cholesterol egress. Nat. Commun.10, 4276. 10.1038/s41467-019-12152-2 (2019). - PMC - PubMed
    1. Kennedy, B. E., Charman, M. & Karten, B. Niemann–Pick Type C2 protein contributes to the transport of endosomal cholesterol to mitochondria without interacting with NPC1. J. Lipid Res.53, 2632–2642. 10.1194/jlr.M029942 (2012). - PMC - PubMed

LinkOut - more resources