. 2025 Jan 2;15(1):95.
doi: 10.1038/s41598-024-83862-x.

TILTomorrow today: dynamic factors predicting changes in intracranial pressure treatment intensity after traumatic brain injury

Collaborators, Affiliations

TILTomorrow today: dynamic factors predicting changes in intracranial pressure treatment intensity after traumatic brain injury

Shubhayu Bhattacharyay et al. Sci Rep. .

Abstract

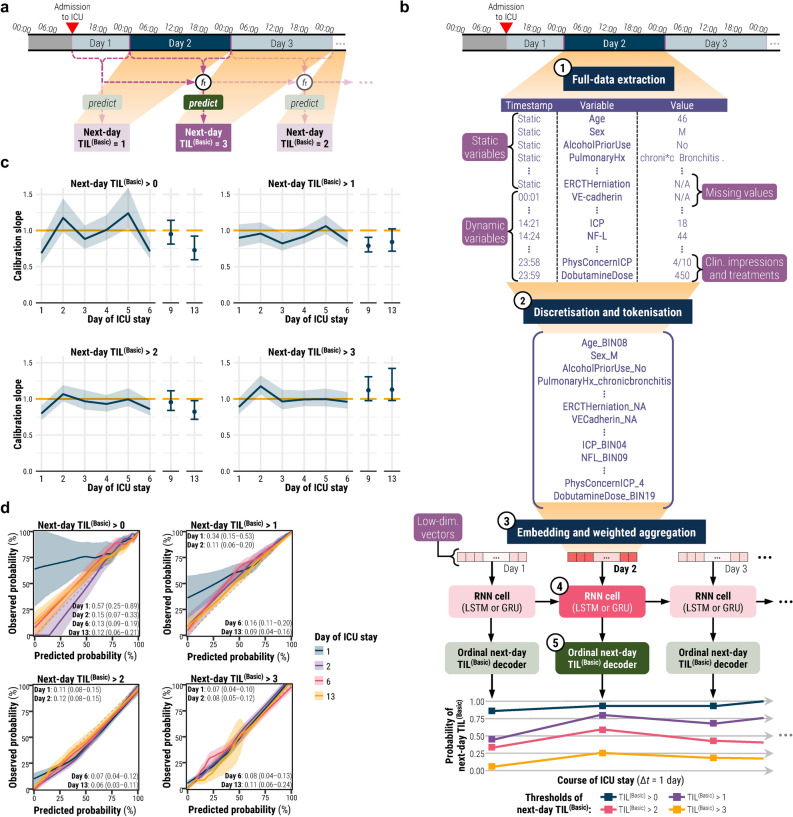
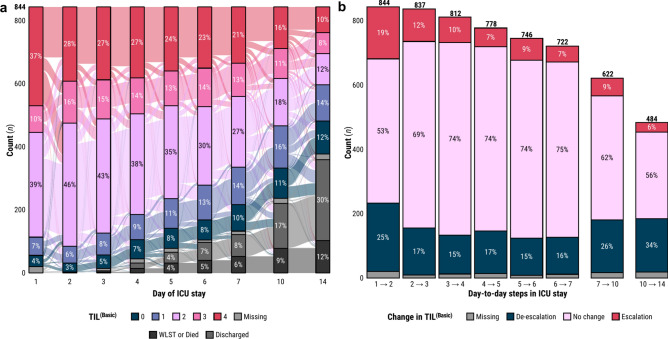
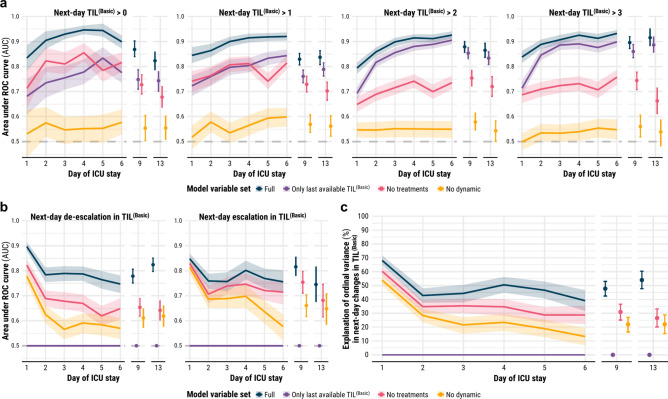
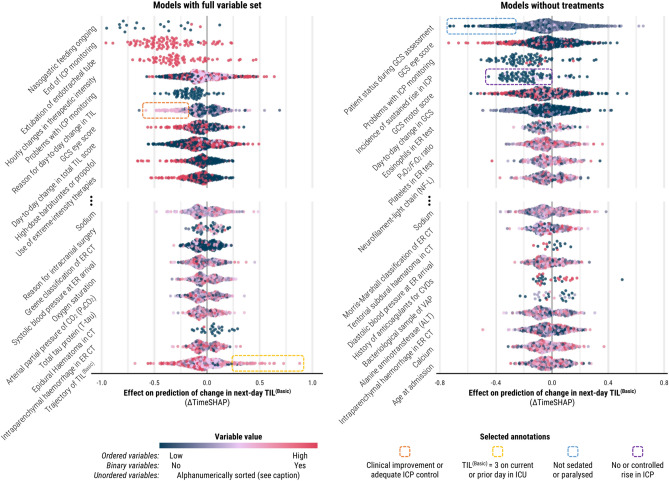
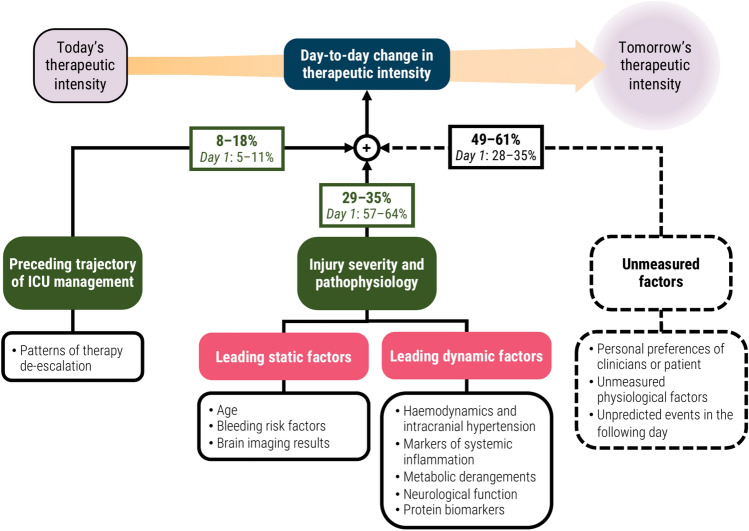
Practices for controlling intracranial pressure (ICP) in traumatic brain injury (TBI) patients admitted to the intensive care unit (ICU) vary considerably between centres. To help understand the rational basis for such variance in care, this study aims to identify the patient-level predictors of changes in ICP management. We extracted all heterogeneous data (2008 pre-ICU and ICU variables) collected from a prospective cohort (n = 844, 51 ICUs) of ICP-monitored TBI patients in the Collaborative European NeuroTrauma Effectiveness Research in TBI study. We developed the TILTomorrow modelling strategy, which leverages recurrent neural networks to map a token-embedded time series representation of all variables (including missing values) to an ordinal, dynamic prediction of the following day's five-category therapy intensity level (TIL(Basic)) score. With 20 repeats of fivefold cross-validation, we trained TILTomorrow on different variable sets and applied the TimeSHAP (temporal extension of SHapley Additive exPlanations) algorithm to estimate variable contributions towards predictions of next-day changes in TIL(Basic). Based on Somers' Dxy, the full range of variables explained 68% (95% CI 65-72%) of the ordinal variation in next-day changes in TIL(Basic) on day one and up to 51% (95% CI 45-56%) thereafter, when changes in TIL(Basic) became less frequent. Up to 81% (95% CI 78-85%) of this explanation could be derived from non-treatment variables (i.e., markers of pathophysiology and injury severity), but the prior trajectory of ICU management significantly improved prediction of future de-escalations in ICP-targeted treatment. Whilst there was no significant difference in the predictive discriminability (i.e., area under receiver operating characteristic curve) between next-day escalations (0.80 [95% CI 0.77-0.84]) and de-escalations (0.79 [95% CI 0.76-0.82]) in TIL(Basic) after day two, we found specific predictor effects to be more robust with de-escalations. The most important predictors of day-to-day changes in ICP management included preceding treatments, age, space-occupying lesions, ICP, metabolic derangements, and neurological function. Serial protein biomarkers were also important and may serve a useful role in the clinical armamentarium for assessing therapeutic needs. Approximately half of the ordinal variation in day-to-day changes in TIL(Basic) after day two remained unexplained, underscoring the significant contribution of unmeasured factors or clinicians' personal preferences in ICP treatment. At the same time, specific dynamic markers of pathophysiology associated strongly with changes in treatment intensity and, upon mechanistic investigation, may improve the timing and personalised targeting of future care.

Keywords: Data mining; Intensive care unit; Intracranial pressure; Machine learning; Therapy intensity level; Traumatic brain injury.


Conflict of interest statement

Declarations. Competing interests: The authors declare no competing interests.

Figures

Fig. 1
Fig. 1
TILTomorrow prediction task and modelling strategy. All shaded regions surrounding curves are 95% confidence intervals derived using bias-corrected bootstrapping (1000 resamples) to represent the variation across the patient population and across the 20 repeated five-fold cross-validation partitions. (a) Illustration of the TILTomorrow dynamic prediction task on a sample patient’s timeline of ICU stay. The objective of the task is to predict the next-day TIL(Basic) score at each calendar day of a patient’s ICU stay. The prediction is dynamic, updated for each calendar day, and must account for temporal variation of variables across all preceding days using a time-series model (ft). (b) Illustration of the TILTomorrow modelling strategy on a sample patient’s timeline of ICU stay. Each patient’s ICU stay is first discretised into non-overlapping time windows, one for each calendar day. From each time window, values for up to 979 dynamic variables were combined with values for up to 1029 static variables to form the variable set. The variable values were converted to tokens by discretising numerical values into 20-quantile bins from the training set and removing special formatting from text-based entries. Through an embedding layer, a vector was learned for each token encountered in the training set, and tokens were replaced with these vectors. A positive relevance weight, also learned for each token, was used to weight-average the vectors of each calendar day into a single, low-dimensional vector. The sequence of low-dimensional vectors representing a patient’s ICU stay were fed into a gated recurrent neural network (RNN). The RNN outputs were then decoded at each time window into an ordinal prognosis of next-day TIL(Basic) score. The highest-intensity treatments associated with each threshold of TIL(Basic) are decoded in Table 1. (c) Probability calibration slope, at each threshold of next-day TIL(Basic), for models trained on the full variable set. The ideal calibration slope of one is marked with a horizontal orange line. (d) Ordinal probability calibration curves at four different days after ICU admission. The diagonal dashed line represents the line of perfect calibration. The values in each panel correspond to the maximum absolute error (95% confidence interval) between the curve and the perfect calibration line. Abbreviations: CT = computerised tomography, ER = emergency room, ft = time-series model, GRU = gated recurrent unit, Hx = history, ICP = intracranial pressure, ICU = intensive care unit, LSTM = long short-term memory, N/A = not available, NF-L = neurofilament light chain, SES = socioeconomic status, TIL = Therapy intensity level, TIL(Basic) = condensed, five-category TIL scale as defined in Table 1, VE = vascular endothelial.
Fig. 2
Fig. 2
Distributions of TIL(Basic) and its day-to-day changes in the study population. (a) Alluvial diagram of the evolution of the TIL(Basic) distribution in the study population over the assessed days of ICU stay. Percentages which round to 2% or lower are not shown. (b) Distributions of day-to-day changes in TIL(Basic). The numbers above each bar represent the number of study patients remaining in the ICU after the corresponding day-to-day step. Percentages which round to 2% or lower are not shown. Abbreviations: ICU = intensive care unit, TIL = therapy intensity level, TIL(Basic) = condensed, five-category TIL scale as defined in Table 1, WLST = withdrawal of life-sustaining therapies.
Fig. 3
Fig. 3
Differential performance in discriminating and explaining next-day TIL(Basic). All shaded regions surrounding curves and error bars are 95% confidence intervals derived using bias-corrected bootstrapping (1000 resamples) to represent the variation across 20 repeated five-fold cross-validation partitions. (a) Discrimination performance in prediction of next-day TIL(Basic)—measured by AUC at each threshold of TIL(Basic)—by models trained on different variable sets. The violet line represents the performance achieved by simply carrying the last available TIL(Basic) forward to account for the effect of day-to-day stasis in TIL(Basic) on prediction. The horizontal dashed line (AUC = 0.5) represents the performance of uninformative prediction. (b) Discrimination performance in prediction of next-day de-escalation or escalation in TIL(Basic)—measured by AUC—by models trained on different variable sets. The horizontal dashed line (AUC = 0.5) represents the performance of uninformative prediction. (c) Explanation of ordinal variation in next-day changes in TIL(Basic)—measured by Somers’ Dxy—by models trained on different variable sets. Abbreviations: AUC = area under the receiver operating characteristic (ROC) curve, ICU = intensive care unit, TIL = therapy intensity level, TIL(Basic) = condensed, five-category TIL scale as defined in Table 1.
Fig. 4
Fig. 4
Population-level variable contributions to prediction of changes in next-day TIL(Basic) at days directly preceding a change in TIL(Basic). The ΔTimeSHAP values on the left panel are from the models trained on the full variable set whilst the ΔTimeSHAP values on the right panel are from the models trained without clinician impressions or treatments. ΔTimeSHAP values are interpreted as the relative contributions of variables towards the difference in model prediction of next-day TIL(Basic) over the two days directly preceding the change in TIL(Basic) (Supplementary Methods S5). Therefore, the study population represented in this figure is limited to patients who experienced a change in TIL(Basic) after day two of ICU stay (n = 575). A positive ΔTimeSHAP value signifies association with an increased likelihood of escalation in next-day TIL(Basic), whereas a negative ΔTimeSHAP value signifies association with an increased likelihood of de-escalation. The variables were selected by first identifying the ten variables with non-missing value tokens with the most negative median ΔTimeSHAP values across the population (above the ellipses) and then, amongst the remaining variables, selecting the ten with non-missing value tokens with the most positive median ΔTimeSHAP values (below the ellipses). Each point represents the mean ΔTimeSHAP value, taken across all 20 repeated cross-validation partitions, for a token preceding an individual patient’s change in TIL(Basic). The number of points for each variable, therefore, indicates the relative occurrence of that variable before changes in TIL(Basic) in the study population. The colour of the point represents the relative ordered value of a token within a variable, and for unordered variables (e.g., patient status during GCS assessment), tokens were sorted alphanumerically (the sort index per possible unordered variable token is provided in the CENTER-TBI data dictionary). Abbreviations: CVDs = cardiovascular diseases, ER = emergency room, FIO2 = fraction of inspired oxygen, GCS = Glasgow coma scale, ICP = intracranial pressure, PaO2 = partial pressure of oxygen, TIL = therapy intensity level, TIL(Basic) = condensed, five-category TIL scale as defined in Table 1, VAP = ventilator-associated pneumonia.
Fig. 5
Fig. 5
Conceptual diagram of factors explaining day-to-day changes in therapeutic intensity. The percentage values represent the differential explanation of ordinal variation in next-day changes in TIL(Basic) as measured by Somers’ Dxy. The bolded percentage values represent the 95% confidence interval of Somers’ Dxy from days 2–6 of ICU stay, whilst the percentage values below them represent the 95% confidence interval of Somers’ Dxy from day 1 of ICU stay (Fig. 3c). The 95% confidence intervals were derived using bias-corrected bootstrapping (1000 resamples) to represent the variation across 20 repeated five-fold cross-validation partitions. The leading static and dynamic pathophysiological factors were determined by qualitative categorisation of the variables with the highest contribution to next-day changes in TIL(Basic) based on ΔTimeSHAP values (Fig. 4). Abbreviations: TIL = therapy intensity Level, TIL(Basic) = condensed, five-category TIL scale as defined in Table 1.

Similar articles

References

    1. Meyfroidt, G. et al. Management of moderate to severe traumatic brain injury: an update for the intensivist. Intensive Care Med.48, 649–666 (2022). - PubMed
    1. Maas, A. I. R. et al. Traumatic brain injury: Integrated approaches to improve prevention, clinical care, and research. Lancet Neurol.16, 987–1048 (2017). - PubMed
    1. Maas, A. I. R. et al. Traumatic brain injury: Progress and challenges in prevention, clinical care, and research. Lancet Neurol.21, 1004–1060 (2022). - PMC - PubMed
    1. Hawryluk, G. W. J. et al. A management algorithm for patients with intracranial pressure monitoring: The Seattle International severe traumatic brain injury consensus conference (SIBICC). Intensive Care Med.45, 1783–1794 (2019). - PMC - PubMed
    1. Carney, N. et al. Guidelines for the management of severe traumatic brain injury, fourth edition. Neurosurgery80, 6 (2017). - PubMed

Publication types