

Validation of musculoskeletal segmentation model with uncertainty estimation for bone and muscle assessment in hip-to-knee clinical CT images
- PMID: 39747203
- PMCID: PMC11696574
- DOI: 10.1038/s41598-024-83793-7
Validation of musculoskeletal segmentation model with uncertainty estimation for bone and muscle assessment in hip-to-knee clinical CT images
Abstract
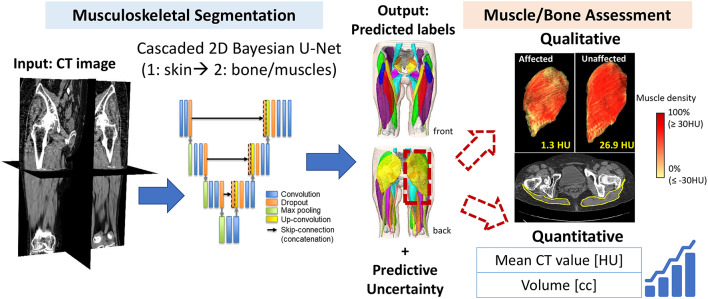
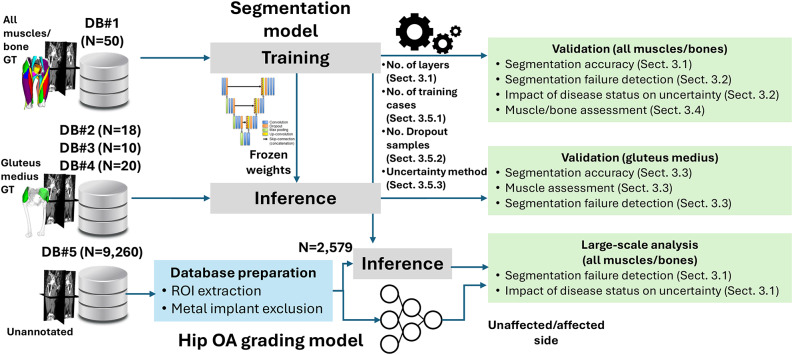
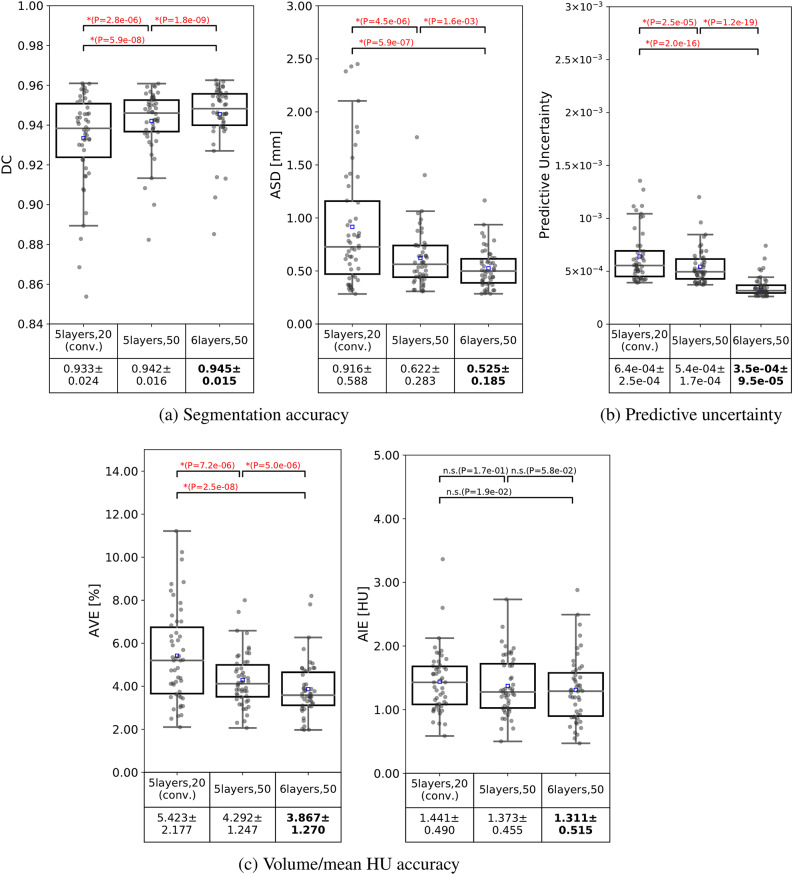
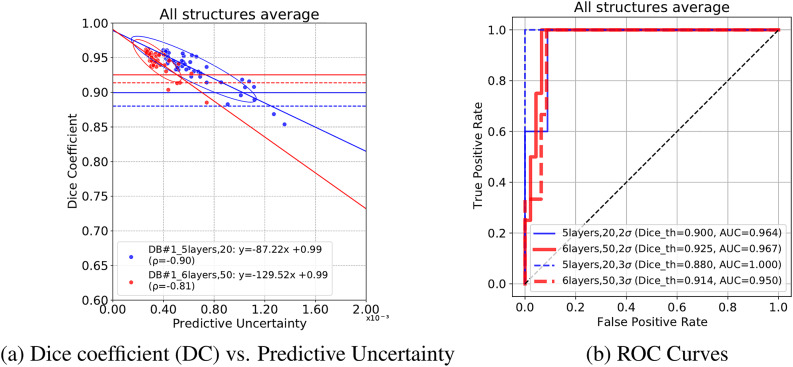
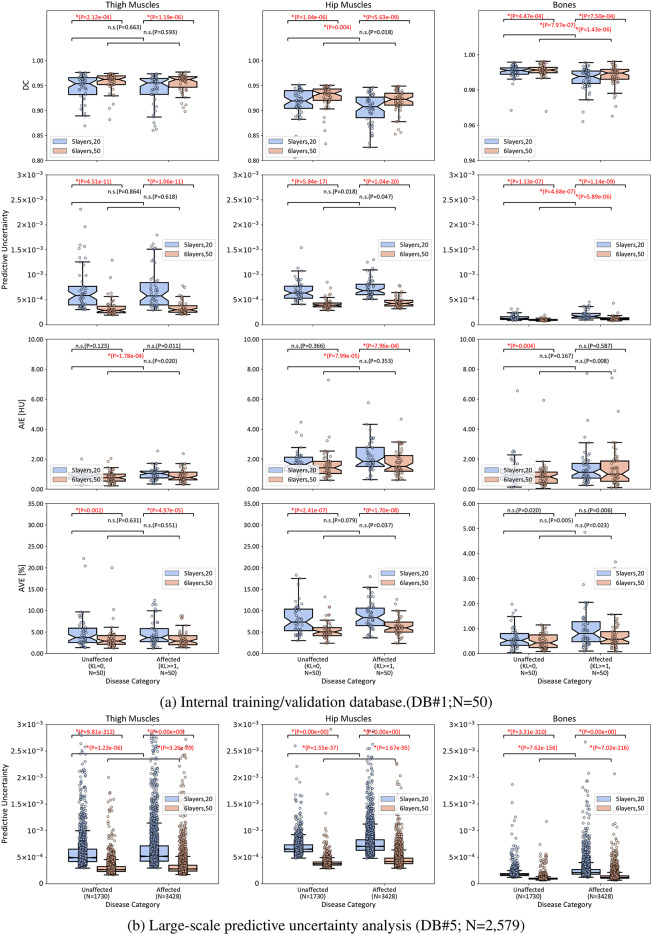
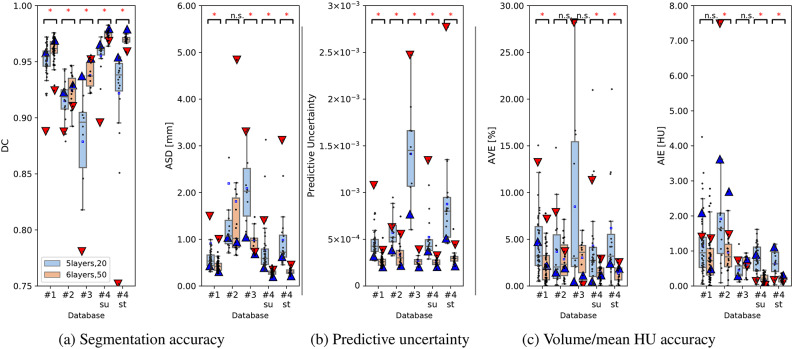
Deep learning-based image segmentation has allowed for the fully automated, accurate, and rapid analysis of musculoskeletal (MSK) structures from medical images. However, current approaches were either applied only to 2D cross-sectional images, addressed few structures, or were validated on small datasets, which limit the application in large-scale databases. This study aimed to validate an improved deep learning model for volumetric MSK segmentation of the hip and thigh with uncertainty estimation from clinical computed tomography (CT) images. Databases of CT images from multiple manufacturers/scanners, disease status, and patient positioning were used. The segmentation accuracy, and accuracy in estimating the structures volume and density, i.e., mean HU, were evaluated. An approach for segmentation failure detection based on predictive uncertainty was also investigated. The model has improved all segmentation accuracy and structure volume/density evaluation metrics compared to a shallower baseline model with a smaller training database (N = 20). The predictive uncertainty yielded large areas under the receiver operating characteristic (AUROC) curves (AUROCs ≥ .95) in detecting inaccurate and failed segmentations. Furthermore, the study has shown an impact of the disease severity status on the model's predictive uncertainties when applied to a large-scale database. The high segmentation and muscle volume/density estimation accuracy and the high accuracy in failure detection based on the predictive uncertainty exhibited the model's reliability for analyzing individual MSK structures in large-scale CT databases.
© 2024. The Author(s).
Conflict of interest statement
Decalarations. Competing interests: Masahiro Jinzaki received a grant from Canon Medical Systems. However, Canon Medical Systems was not involved in the design and conduct of the study; in the collection, analysis, and interpretation of the data; or in the preparation, review, and approval of the manuscript. The remaining authors have no conflicts of interest to declare. Ethics approval: Ethics approval Ethical approval was obtained from the Institutional Review Boards (IRBs) of the institutions participating in this study (IRB approval numbers: 21115 for Osaka University Hospital, 2023-28 for Hitachi Health Care Center, 2020-M-7 for Nara Institute of Science and Technology, and jRCTs032180267 for Keio University.)
Figures

Similar articles
-
Automated Muscle Segmentation from Clinical CT Using Bayesian U-Net for Personalized Musculoskeletal Modeling.IEEE Trans Med Imaging. 2020 Apr;39(4):1030-1040. doi: 10.1109/TMI.2019.2940555. Epub 2019 Sep 10. IEEE Trans Med Imaging. 2020. PMID: 31514128
-
Two-stage deep learning model for fully automated pancreas segmentation on computed tomography: Comparison with intra-reader and inter-reader reliability at full and reduced radiation dose on an external dataset.Med Phys. 2021 May;48(5):2468-2481. doi: 10.1002/mp.14782. Epub 2021 Mar 16. Med Phys. 2021. PMID: 33595105
-
Development and Validation of a Deep Learning System for Segmentation of Abdominal Muscle and Fat on Computed Tomography.Korean J Radiol. 2020 Jan;21(1):88-100. doi: 10.3348/kjr.2019.0470. Korean J Radiol. 2020. PMID: 31920032 Free PMC article.
-
Automatic Segmentation of Multiple Organs on 3D CT Images by Using Deep Learning Approaches.Adv Exp Med Biol. 2020;1213:135-147. doi: 10.1007/978-3-030-33128-3_9. Adv Exp Med Biol. 2020. PMID: 32030668 Review.
-
Deep Learning Technique for Musculoskeletal Analysis.Adv Exp Med Biol. 2020;1213:165-176. doi: 10.1007/978-3-030-33128-3_11. Adv Exp Med Biol. 2020. PMID: 32030670 Review.
Cited by
-
Evaluating upper leg muscle volume : the reliability of thigh circumference measurement 10 cm above the patella.Bone Joint Res. 2025 Aug 1;14(8):666-673. doi: 10.1302/2046-3758.148.BJR-2024-0216.R2. Bone Joint Res. 2025. PMID: 40744446 Free PMC article.
References
-
- Islam, S. et al. Fully automated deep-learning section-based muscle segmentation from ct images for sarcopenia assessment. Clin. Radiol.77, e363–e371 (2022). - PubMed
-
- Yokota, F. et al. Automated ct segmentation of diseased hip using hierarchical and conditional statistical shape models. In Mori, K., Sakuma, I., Sato, Y., Barillot, C., Navab, N. (eds) Medical Image Computing and Computer-Assisted Intervention MICCAI 2013, vol. 8150 ofLecture Notes in Computer Science, 10.1007/978-3-642-40763-5 24 (Springer, Berlin, Heidelberg, 2013). - PubMed
Publication types
MeSH terms
LinkOut - more resources
Full Text Sources
Medical
