. 2025 Jan 2;16(1):205.
doi: 10.1038/s41467-024-55647-3.

NHSL3 controls single and collective cell migration through two distinct mechanisms

Affiliations

NHSL3 controls single and collective cell migration through two distinct mechanisms

Nikita M Novikov et al. Nat Commun. .

Abstract

The molecular mechanisms underlying cell migration remain incompletely understood. Here, we show that knock-out cells for NHSL3, the most recently identified member of the Nance-Horan Syndrome family, are more persistent than parental cells in single cell migration, but that, in wound healing, follower cells are impaired in their ability to follow leader cells. The NHSL3 locus encodes several isoforms. We identify the partner repertoire of each isoform using proteomics and predict direct partners and their binding sites using an AlphaFold2-based pipeline. Rescue with specific isoforms, and lack of rescue when relevant binding sites are mutated, establish that the interaction of a long isoform with MENA/VASP proteins is critical at cell-cell junctions for collective migration, while the interaction of a short one with 14-3-3θ in lamellipodia is critical for single cell migration. Taken together, these results demonstrate that NHSL3 regulates single and collective cell migration through distinct mechanisms.


Conflict of interest statement

Competing interests: The authors declare no competing interests.

Figures
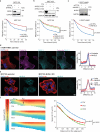
Fig. 1
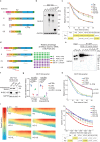
Fig. 1. NHSL3 regulates single and collective cell migration.
a MCF10A cells are transfected with pools of control (CTRL) or NHSL3 siRNAs and analysed by Western blots using NHSL3 and GAPDH antibodies. Cells are tracked for 6.5 h and migration persistence is extracted from trajectories of single cells. n  =  60 cells, mean ± SEM. b NHSL3 KO clones or parental MCF10A cells are analysed by Western blots using NHSL3 and GAPDH antibodies. Cells are tracked for 6.5 h and migration persistence is extracted from trajectories of single cells. n  =  60 cells. c hTERT-HME1 cells are transfected with pools of control (CTRL) or NHSL3 siRNAs and analysed by Western blots. Cells are tracked for 8 h and migration persistence is extracted from trajectories of single cells. n  =  60 cells, mean ± SEM. d hTERT-HME1 cells are stained with DAPI (nuclear DNA), phalloidin (filamentous actin) and antibodies targeting cortactin or NHSL3. Single confocal section, scale bar: 20 μm. Overlap of cortactin and NHSL3 over multiple line scans registered to the cell edge. Data are shown as mean ± SEM, n  =  15 line scans. e Parental MCF10A (Par) and NHSL3 KO cells are stained with DAPI, phalloidin and NHSL3 antibodies. Single confocal section, scale bar: 10 μm. Overlap of actin and NHSL3 over multiple line scans registered to the cell-cell junction. Data are shown as mean ± SEM, n  =  15 line scans. f Migration of monolayers into the wound that is created by lifting an insert is imaged by phase contrast over time and analysed by Particle Image Velocimetry (PIV). Heat maps of the speed of collective parental MCF10A or NHSL3 KO cells display the front edge at the top and time of insert lifting at the left and its evolution over time and space (average of 12 measures, i.e. 3 biological replicates each containing 4 fields of view). Quantification of cell speed across the monolayer at 8 h. Statistical significance is calculated using custom-made R programmes for single cell migration and one-way ANOVA for collective migration. p-values are indicated. Three biological repeats for each experiment gave similar results. Source data are provided as a Source Data file.
Fig. 2
Fig. 2. Different NHSL3 isoforms are involved in single and collective cell migration.
a Scheme of NHSL3 isoforms expressed in MCF10A cells. Exons 5 and 6 are omitted in a short isoform. Three transcriptional start sites account for different exons 1, labelled E1, E1’ and E1”. Locations of the gRNA used for KO and siRNAs targeting specifically short and long isoforms are indicated. b MCF10A NHSL3 KO cells are stably transfected with plasmids expressing Flag-GFP or Flag-GFP tagged NHSL3 isoforms and analysed by Western blots using NHSL3 and GAPDH antibodies. Red stars indicate the location of NHSL3 isoforms. c Cells are tracked for 6.5 h and migration persistence is extracted from trajectories of single cells. n  =  60 cells, mean ± SEM. i3S is the only isoform that rescues the increased persistence of NHSL3 KO cells. d Quantification of different NHSL3 mRNAs in MCF10A cells using qRT-PCR and representation of their respective abundance. Proportions of NHSL3 isoforms are deduced from the PCR amplicons labelled a to e in the scheme, mean ± SEM. e Quantification of long and short isoforms at the protein level. The different isoforms are labelled at their C-terminus by knocking in GFP-Flag in exon 7 (KI). Lysates from parental MCF10A and KI cells are subjected to GFP immunoprecipitation. Lysates, immunoprecipitates and dilution thereof are subjected to NHSL3 Western blot. The short isoform is about 100-fold less abundant than long isoforms. f MCF10A cells stably expressing i3S are transfected with siRNAs targeting short or long isoforms and analysed by Western blots. g qRT-PCR of short and long isoforms in MCF10A cells transfected with siRNAs, n = 3, mean ± SEM. h Migration persistence of single MCF10A cells transfected with siRNAs. Tracking 6.5 h, n  =  60 cells, mean ± SEM. i Collective migration of NHSL3 KO cells stably expressing the different NHSL3 isoforms, assessed as in Fig. 1f. i2 is the only isoform that significantly rescues the decreased speed of follower cells in NHSL3 KO cells. Statistical significance is calculated with custom-made R programmes for single cell migration or with Kruskal-Wallis test for collective migration. Significant p-values are highlighted in yellow in the tables. Three biological repeats of each experiment gave similar results. Source data are provided as a Source Data file.
Fig. 3
Fig. 3. NHSL3 regulates single cell migration through a mechanism distinct from the one of NHSL1.
a MCF10A cells are transfected with siRNA pools targeting NHSL1 and NHSL3 and analysed by Western blots. Migration persistence of single cells. Tracking 6.5 h, n  =  60 cells, mean ± SEM. Statistical significance is calculated using custom-made R programmes for single cell migration and p-values are indicated. b The 3 N-terminal regions of NHSL3 depicted in the scheme are cloned into a plasmid expressing fusion proteins with Flag-GFP and compared with the corresponding WAVE Homology Domain (WHD) of NHSL1. Lysates of MCF10A cells stably expressing the various fusion proteins are subjected to GFP immunoprecipitations. Lysates and immunoprecipitates are analysed by Western blots using antibodies targeting GFP, WAVE complex subunits or GAPDH as a negative control. NHSL1 with a functional WHD forms a WAVE shell complex containing all WAVE complex subunits, except WAVE2 that it replaces. None of the NHSL3 N-terminal domains forms a similar WAVE shell complex. L1 refers to NHSL1, L3-i1 to NHSL3 i1, L3-i2 to NHSL3 i2, L3-i3 to NHSL3 i3. Three biological repeats of both experiments gave similar results. Source data are provided as a Source Data file.
Fig. 4
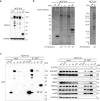
Fig. 4. Identification of NHSL3 partners.
a MCF10A cells are stably transfected with plasmids expressing either Flag-GFP or Flag-GFP tagged NHSL3 isoforms and analysed by Western blots. b FLAG-GFP tagged NHSL3 isoforms, or FLAG-GFP as a control, from stable MCF10A clones or GFP-Flag knock-in (KI) MCF10A cells are subjected to Tandem Affinity Purification (TAP). Proteins are resolved by SDS–PAGE and silver stained. The number of proteins identified by mass spectrometry is indicated below each lane. c GFP immunoprecipitates from MCF10A cells stably expressing NHSL3 isoforms are analysed by Western blots for the presence of partners involved in actin polymerisation, namely WAVE complex subunits, IRSp53 and MENA/VASP proteins. Red stars indicate the position of tagged isoforms of NHSL3. Three biological repeats of each experiment gave similar results.
Fig. 5
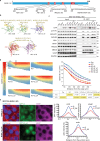
Fig. 5. NHSL3 i2 regulates the speed of follower cells in collective migration through its interaction with MENA/VASP family proteins.
a Predicted binding sites on NHSL3 for ABI1, IRSp53 and MENA/VASP are deleted in isoform 2, as indicated (Δ1 to Δ4). b AlphaFold2-generated models of interactions between NHSL3 and partners. Confidence of the interaction is indicated as the AF2 score. c GFP immunoprecipitates from stable rescued KO lines are analysed by Western blots. Two biological repeats with similar results. d Collective migration of NHSL3 KO cells stably expressing the different NHSL3 i2 mutant forms, assessed as in Fig. 1b (average of 12 measures, i.e. 3 biological replicates each containing 4 fields of view). Statistical significance is calculated with Kruskal-Wallis test and p-values are indicated. e MCF10A NHSL3 KO cells stably expressing NHSL3 i2 or NHSL3 i2_Δ4 are allowed to migrate collectively into the wound for 8 h and monolayers are stained with DAPI, phalloidin and VASP antibodies. Scale bar: 10 μm. Intensity of GFP fluorescence, VASP immunofluorescence and phalloidin is plotted as percentages from -2.5 to 2.5 µm across the cell-cell junction (mean ± SEM of 45 measures, i.e. 3 biological replicates each containing 15 line scans). The three biological repeats of all displayed experiments gave similar results. Source data are provided as a Source Data file.
Fig. 6
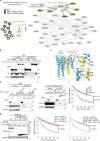
Fig. 6. The short isoform of NHSL3 regulates migration persistence of single cells through its interaction with 14-3-3θ.
a Prediction of direct partners of NHSL3 i3S using an AlphaFold2-based pipeline that decomposes tested proteins into evolutionary conserved domains. Partners bound to the unique C-terminal domain of i3S are shown. YWHAQ encoding 14-3-3θ displays the highest confidence score. Grey connections indicate protein-protein interaction reported in Biogrid. b 293 T cells are transiently co-transfected with plasmids expressing GFP-tagged NHSL3 i3S and PC-tagged 14-3-3 family proteins. Lysates and GFP immunoprecipitates are analysed by Western blots. c AlphaFold2-generated model of the interaction between NHSL3 i3S and 14-3-3θ. i3S residues that are critical for the interaction are displayed in full. d 293 T cells are transiently co-transfected with plasmids expressing the PC-tagged 14-3-3θ and the GFP-tagged i3S containing the indicated mutations. Lysates and GFP immunoprecipitates are analysed by Western blots. e Lysates from NHSL3 KO and NHSL3 KO stably expressing GFP or GFP-tagged NHSL3 i3S or the R135D derivative thereof are subjected to GFP immunoprecipitation and analysed by Western blots. f Migration persistence extracted from single cell trajectories of the same cell lines. Tracking 6.5 h, n  =  60 cells. g Parental MCF10A, NHSL3 KO and KO cells stably expressing i3S or the R135D derivative are transfected with control or 14-3-3θ targeting siRNAs. Migration persistence is extracted from single cell trajectories and lysates from siRNA-transfected cells are analysed by Western blots. Tracking 6.5 h, n  =  60 cells. Data are shown as mean ± SEM. Statistical significance is calculated with custom-made R programmes for single cell migration and p-values are indicated. Three biological repeats of each experiment gave similar results. Source data are provided as a Source Data file.
Fig. 7
Fig. 7. The short isoform of NHSL3 recruits 14-3-3θ to lamellipodia.
hTERT-HME1 cells are transfected with siRNAs targeting all NHSL3 forms (a) or specifically long and short isoforms (b). Cells are subjected to immunofluorescence with DAPI, phalloidin and antibodies recognising 14-3-3θ or cortactin. Enrichment of 14-3-3θ and cortactin at the lamellipodial edge is measured and plotted as the fold increase compared with signal intensity of a similar region of interest beneath the plasma membrane, mean ± SEM. Scale bars: 10 µm. n = 57 cells for (a) and n = 60 cells for (b). Statistical significance is calculated with two-sided Mann-Whitney test (a) or Kruskal-Wallis test (b) and p-values are indicated. Three biological repeats of both experiments gave similar results. Source data are provided as a Source Data file.
Fig. 8
Fig. 8. Model.
NHSL3 regulates single and collective cell migration through two distinct mechanisms. The long isoform i2 regulates speed of follower cells in collective migration by recruiting a pool of MENA/VASP proteins to cell-cell contacts in migrating monolayers. The short isoform i3S regulates migration persistence of single cells by recruiting 14-3-3θ to the lamellipodium.

References

    1. Ridley, A. J. Life at the leading edge. Cell145, 1012–1022 (2011). - PubMed
    1. Petrie, R. J., Doyle, A. D. & Yamada, K. M. Random versus directionally persistent cell migration. Nat. Rev. Mol. Cell Biol.10, 538–549 (2009). - PMC - PubMed
    1. Krause, M. & Gautreau, A. Steering cell migration: lamellipodium dynamics and the regulation of directional persistence. Nat. Rev. Mol. Cell Biol.15, 577–590 (2014). - PubMed
    1. Friedl, P. & Mayor, R. Tuning collective cell migration by cell–cell junction regulation. Cold Spring Harb. Perspect. Biol.9, a029199 (2017). - PMC - PubMed
    1. Brieher, W. M. & Yap, A. S. Cadherin junctions and their cytoskeleton(s). Curr. Opin. Cell Biol.25, 39–46 (2013). - PubMed

Publication types

LinkOut - more resources