. 2025 Jan 2;16(1):340.
doi: 10.1038/s41467-024-55659-z.

Multiparametric MRI along with machine learning predicts prognosis and treatment response in pediatric low-grade glioma

Affiliations

Multiparametric MRI along with machine learning predicts prognosis and treatment response in pediatric low-grade glioma

Anahita Fathi Kazerooni et al. Nat Commun. .

Abstract

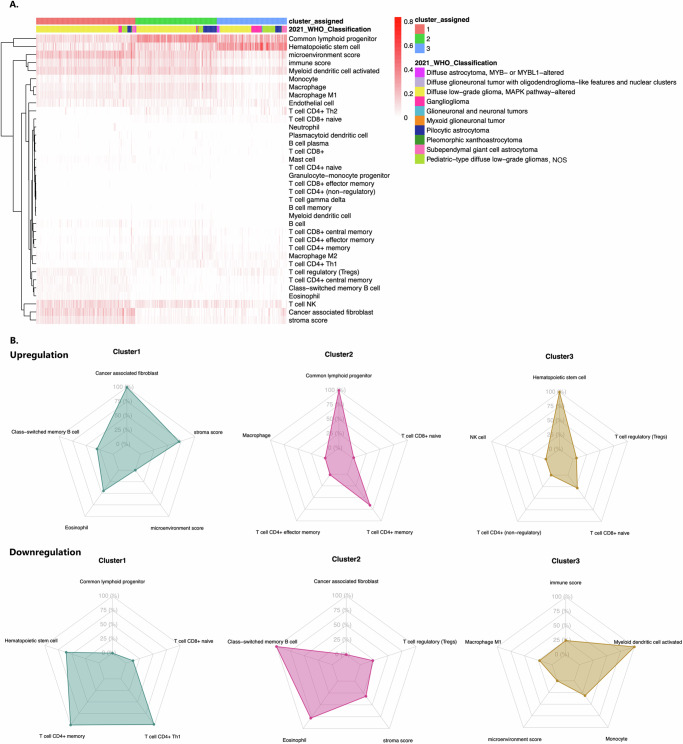
Pediatric low-grade gliomas (pLGGs) exhibit heterogeneous prognoses and variable responses to treatment, leading to tumor progression and adverse outcomes in cases where complete resection is unachievable. Early prediction of treatment responsiveness and suitability for immunotherapy has the potential to improve clinical management and outcomes. Here, we present a radiogenomic analysis of pLGGs, integrating MRI and RNA sequencing data. We identify three immunologically distinct clusters, with one group characterized by increased immune activity and poorer prognosis, indicating potential benefit from immunotherapies. We develop a radiomic signature that predicts these immune profiles with over 80% accuracy. Furthermore, our clinicoradiomic model predicts progression-free survival and correlates with treatment response. We also identify genetic variants and transcriptomic pathways associated with progression risk, highlighting links to tumor growth and immune response. This radiogenomic study in pLGGs provides a framework for the identification of high-risk patients who may benefit from targeted therapies.


Conflict of interest statement

Competing interests: The authors declare no competing interests.

Figures

Fig. 1
Fig. 1. Graphical description of the primary analyses in this study.
A Overview of the imaging, transcriptomic, and multi-modal (combination of imaging and transcriptomic) cohorts. DNA and MRI icons are created by Freepik (DNA: https://www.flaticon.com/free-icons/dna; MRI: https://www.flaticon.com/free-icons/mri). B Identification of the immunological clusters within pLGG. C Generating a radioimmunomic signature to predict immunological clusters. D Developing a clinicoradiomic model that incorporates radiomic features and clinical data to predict progression-free survival in pLGG and thereby, patients’ risk of progression, stratify risk, and analyze the biological and immune pathways linked to clinicoradiomic risk. [Abbreviations: pLGG pediatric low-grade glioma].
Fig. 2
Fig. 2. Immunological clustering.
A Heatmap indicating the expression levels of immune cells across different patients in the three identified immunological profiles using xCell method (indicated above the heatmap as “cluster assigned”, along with the pLGG molecular subtypes for this cohort of subjects. Color bar represents the xCell enrichment score. B Radar plots indicating the upregulated and downregulated set of cell types in each of the immunological clusters. Source data for this figure are provided as a Source Data file. [Abbreviations: pLGG: pediatric low-grade glioma]. Source data for this figure are provided as a Source Data file.
Fig. 3
Fig. 3. Prognostic, clinical, molecular, and immune biomarker associations with immunological clusters.
A Kaplan-Meier curves representing the probability of PFS across different immunological clusters, suggesting a statistically significant difference (log-rank test, p = 1.1e-05) between the clusters based on log-rank comparison. The 95% confidence interval of the Kaplan-Meier survival function estimate is provided for each cluster. B Forest plot from Cox regression analysis illustrating the effects of immunological cluster assignment, molecular subtypes, age, and sex on PFS, where N corresponds to the number of study participants. Error bars represent the 95% confidence interval of the coefficient point estimate from the Cox regression model. Nominal p-values for the coefficients derived from the two-sided Wald test are reported. C The heatmap of TIS as a composite of 18 genes. The association with the molecular subtypes and xCell clusters is indicated at the top of the heatmap plot (Cluster 1: n = 188, Cluster 2: n = 163, Cluster 3: n = 137). Color bar represents the z-scores of the TIS scores. D, E Violin plots representing the distribution of the values for TIS and TMB, respectively, across the three immunological clusters (Cluster 1: n = 188, Cluster 2: n = 163, Cluster 3: n = 137). The width of each violin represents the density of TMB values for each cluster, highlighting the distribution’s shape. The thick black line in the center of each violin represents the median, and the box around it indicates the interquartile range (IQR, from the 25th to 75th percentile). The whiskers are represented with thin black lines extending to the smallest and largest values within 1.5 times the IQR from the lower and upper quartiles. Outliers are shown as individual points outside this range. Statistical comparisons between clusters are displayed above the plot, with the two-sided Kruskal-Wallis test indicating significant differences (p < 2.2e-16 and p = 9.e-06). F Correspondence analysis of Pearson residuals derived from Poisson GLM illustrating associations across immune clusters and 2021 WHO CNS tumor entities. [Abbreviations: PFS progression-free survival, TIS tumor inflammation signature, TMB tumor mutational burden, IQR interquartile range, GLM generalized linear model, WHO World Health Organization, CNS central nervous system]. Source data for this figure are provided as a Source Data file.
Fig. 4
Fig. 4. Imaging characteristics associated with immunological clusters.
A Box-and-Whisker plots indicating radioimmunomic signatures generated for classification of Immune Cluster 2 (n = 47, blue) versus Clusters 1 and 3 (n = 103, red), based on conventional MRI features, as well as conventional MRI + ADC features (Cluster 2, n = 22, blue; Clusters 1 and 3, n = 69, red). The center line represents the median, the box bounds represent the interquartile range (IQR, from the 25th to 75th percentile). The whiskers extend to the smallest and largest values within 1.5 times the IQR from the lower and upper quartiles, with outliers represented as individual points outside this range. B Histograms of image intensities within various tumorous subregions for the tumors in immunological clusters 1 (n = 71, green), 2 (n = 47, blue), 3 (n = 32, red). [Abbreviations: T1-Gd post-contrast T1-weighted imaging, ADC apparent diffusion coefficient, CC cystic component, ED edema]. Source data for this figure are provided as a Source Data file.
Fig. 5
Fig. 5. Clinicoradiomic risk stratification and its association with treatment response and transcriptomic pathways.
A Kaplan-Meier Curves for the PFS Probability of Clinicoradiomic Risk Scores in the Discovery (n = 160, log-rank test, p = 2.69e-11) and Replication (n = 41, log-rank test, p = 0.0049) cohorts. B Box-and-Whisker plots indicating the distribution of risk scores in the patients that received one or no “systemic” treatments (low-risk, n = 31) (see section 2.3.1 in the manuscript for the definition of the two treatment risk categories), compared to those who received more than one treatment (high-risk, n = 30) over the course of 5 years (Student’s t-test, p = 0.001). The center line represents the median, the box bounds represent the interquartile range (IQR, from the 25th to 75th percentile). The whiskers extend to the smallest and largest values within 1.5 times the IQR from the lower and upper quartiles, with outliers represented as individual points outside this range. C Association plot of standardized residuals for the relationship between the clinicoradiomic and the treatment risk categories (the numbers within each circle in the association plot represent the standardized residuals from the chi-square test of independence). Plots B-C only present the data for the subjects that had progression over a course of 5 years (n = 61). D Sankey plot illustrating the association between the Clinicoradiomic risk groups and the immunological clusters. E Bar plot of GLM coefficients derived from an elastic net regression model illustrating pathways associated with the predicted clinicoradiomic risk. [Abbreviations: PFS progression-free survival, IQR interquartile range, GLM generalized linear model]. Source data for this figure are provided as a Source Data file.

Similar articles

Cited by

References

    1. Ostrom, Q. T. et al. CBTRUS statistical report: pediatric brain tumor foundation childhood and adolescent primary brain and other central nervous system tumors diagnosed in the United States in 2014–2018. Neuro Oncol.24, iii1–iii38 (2022). - PMC - PubMed
    1. Louis, D. N. et al. The 2021 WHO classification of tumors of the central nervous system: a summary. Neuro Oncol.23, 1231–1251 (2021). - PMC - PubMed
    1. Ryall, S., Tabori, U. & Hawkins, C. Pediatric low-grade glioma in the era of molecular diagnostics. Acta Neuropathol. Commun.8, 1–22 (2020). - PMC - PubMed
    1. Manoharan, N., Liu, K. X., Mueller, S., Haas-Kogan, D. A. & Bandopadhayay, P. Pediatric low-grade glioma: targeted therapeutics and clinical trials in the molecular era. Neoplasia36, 100857 (2023). - PMC - PubMed
    1. Jones, D. T. et al. Pediatric low-grade gliomas: next biologically driven steps. Neuro Oncol.20, 160–173 (2018). - PMC - PubMed

Publication types

MeSH terms

LinkOut - more resources