. 2025 Jan 2;16(1):336.
doi: 10.1038/s41467-024-55644-6.

Dopaminergic signaling to ventral striatum neurons initiates sniffing behavior

Affiliations

Dopaminergic signaling to ventral striatum neurons initiates sniffing behavior

Natalie L Johnson et al. Nat Commun. .

Abstract

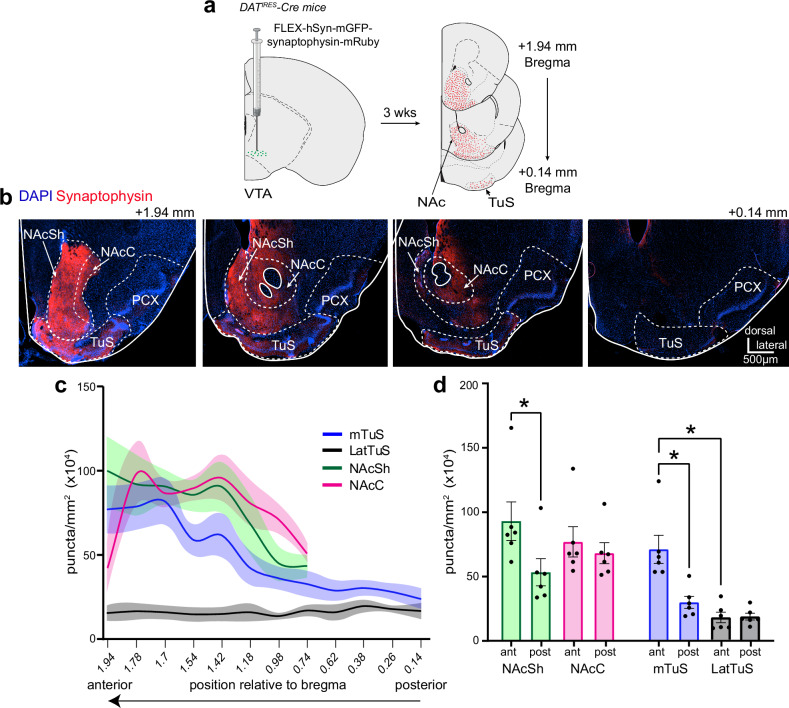
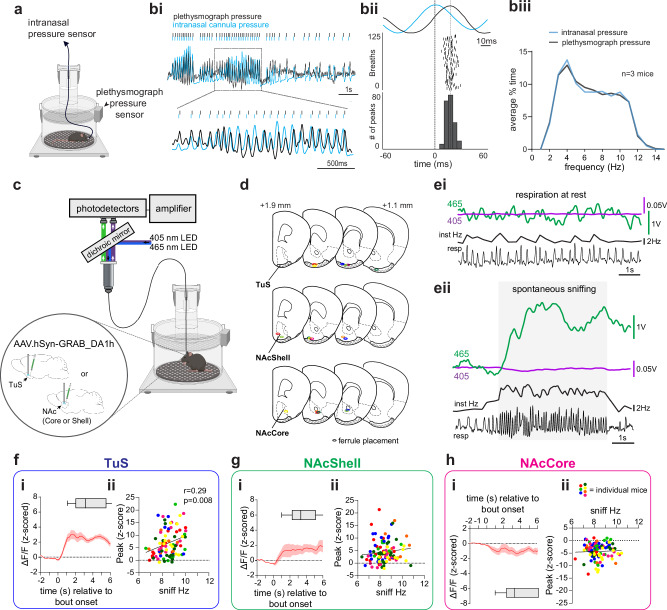
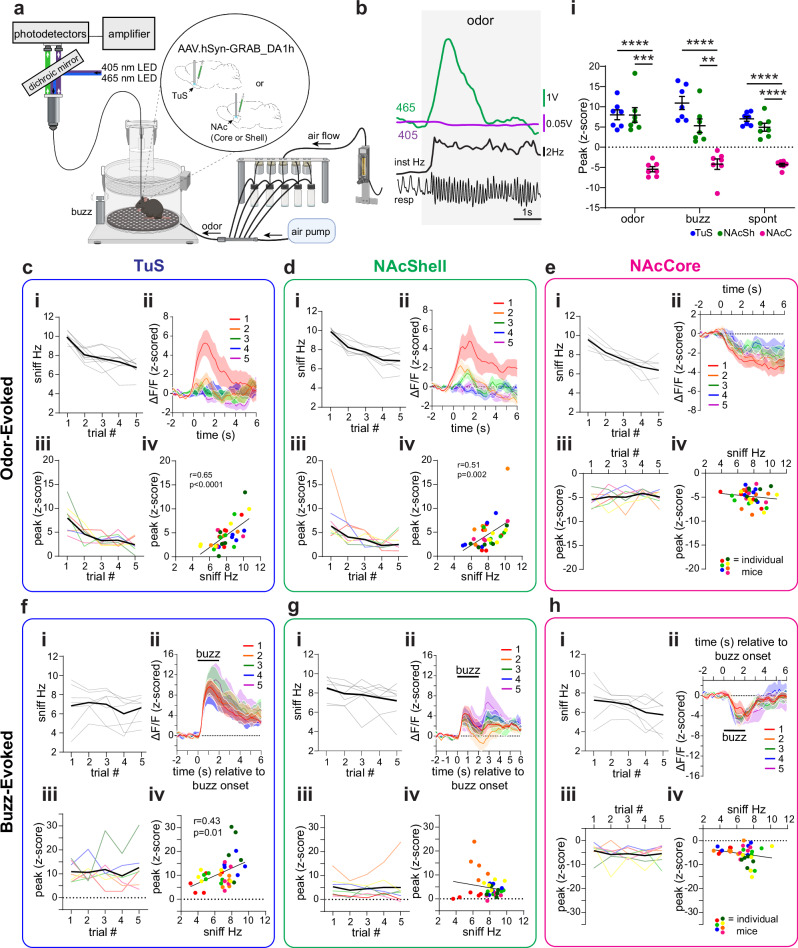
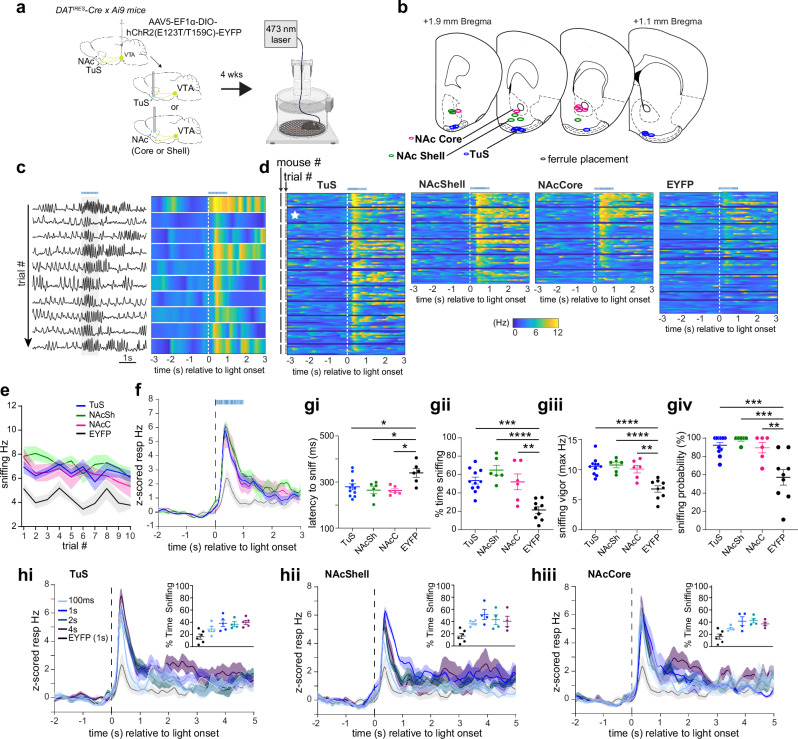
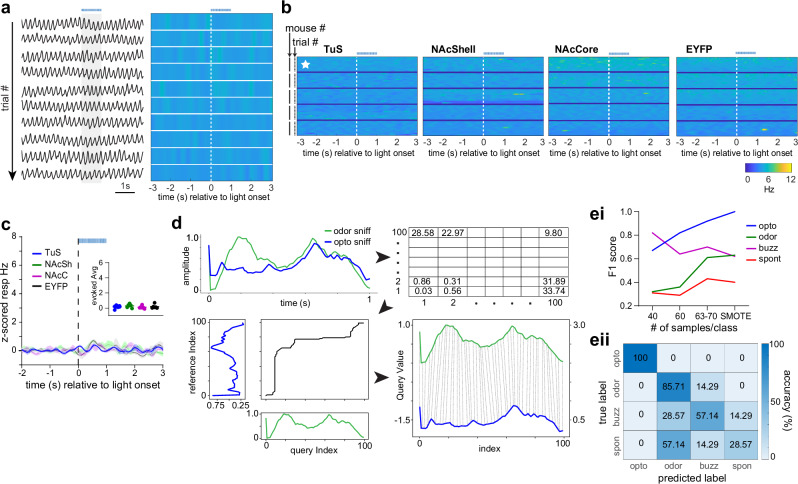
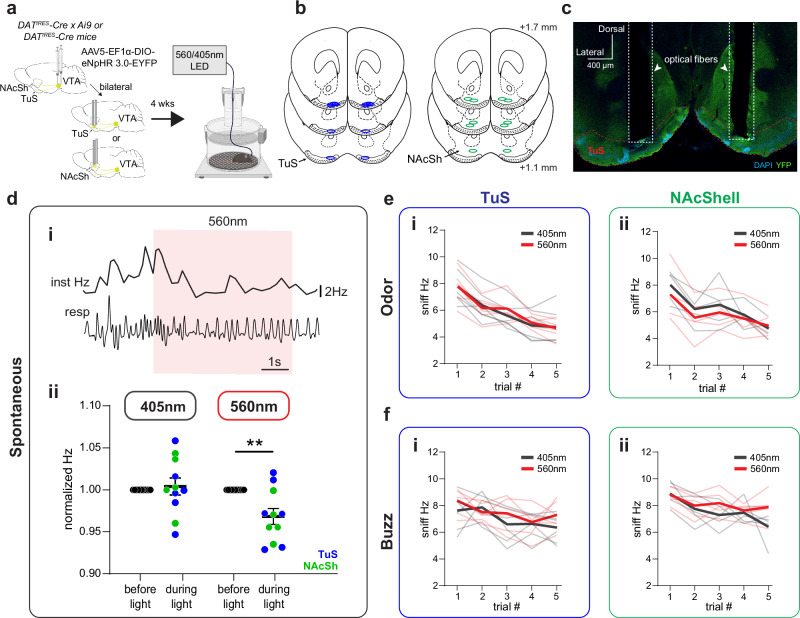
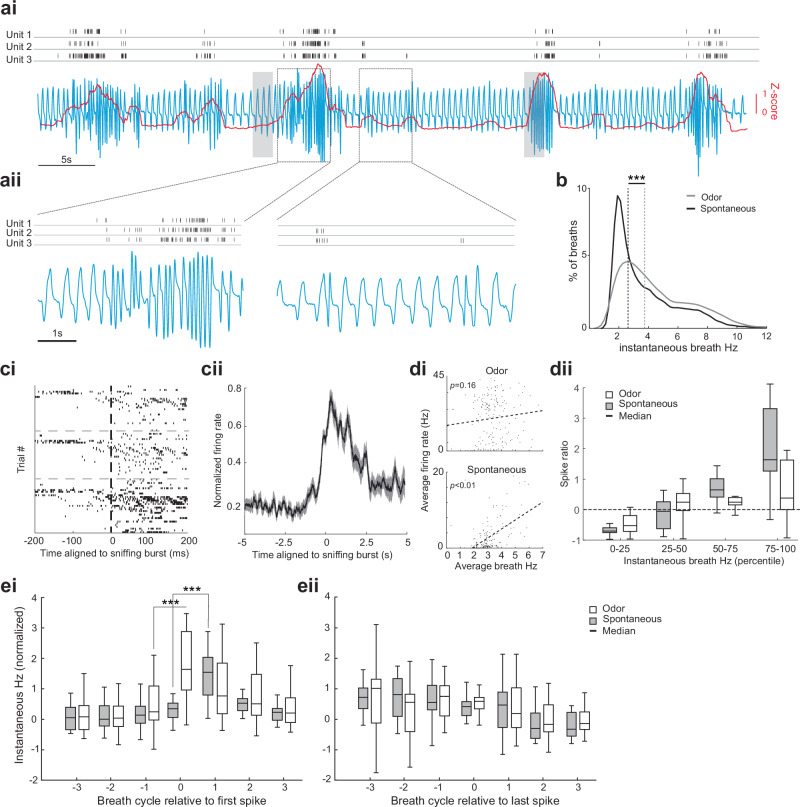
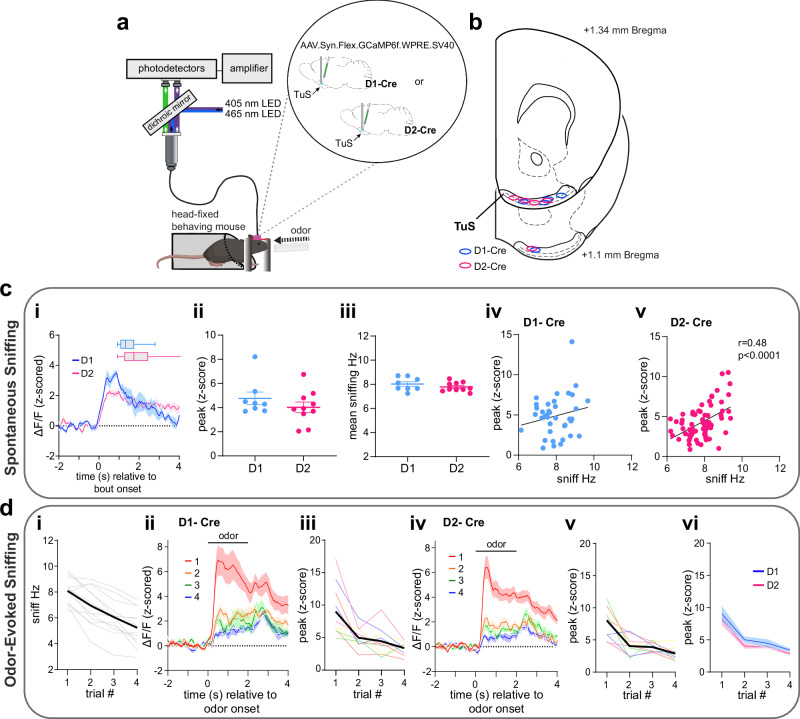
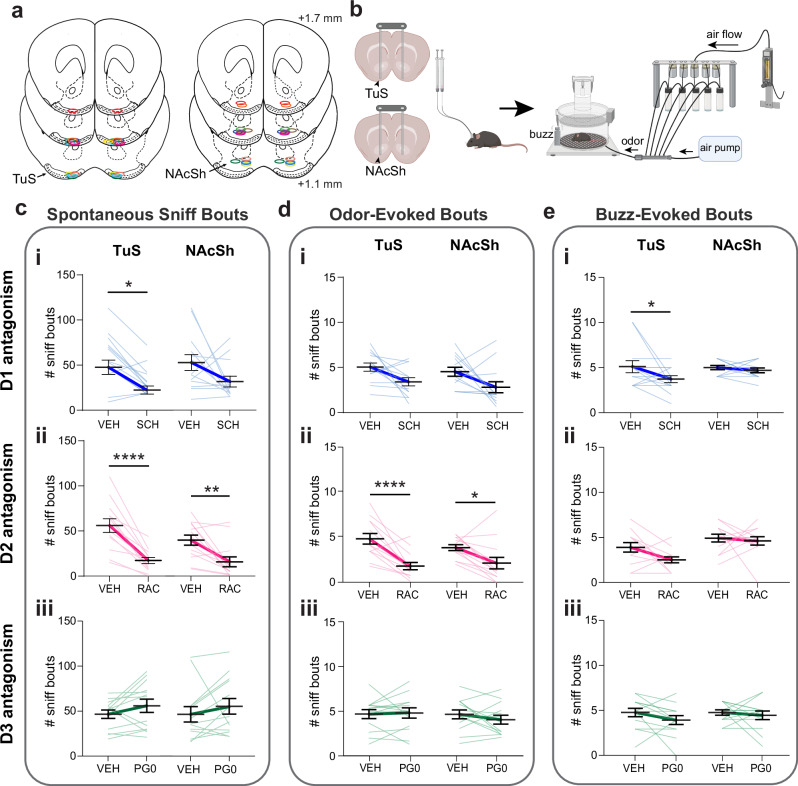
Sniffing is a motivated behavior displayed by nearly all terrestrial vertebrates. While sniffing is associated with acquiring and processing odors, sniffing is also intertwined with affective and motivated states. The systems which influence the display of sniffing are unclear. Here, we report that dopamine release into the ventral striatum in mice is coupled with bouts of sniffing and that stimulation of dopaminergic terminals in these regions drives increases in respiratory rate to initiate sniffing whereas inhibition of these terminals reduces respiratory rate. Both the firing of individual neurons and the activity of post-synaptic D1 and D2 dopamine receptor-expressing neurons are coupled with sniffing and local antagonism of D1 and D2 receptors squelches sniffing. Together, these results support a model whereby sniffing can be initiated by dopamine's actions upon ventral striatum neurons. The nature of sniffing being integral to both olfaction and motivated behaviors implicates this circuit in a wide array of functions.


Conflict of interest statement

Competing interests: Authors declare that they have no competing interests.

Figures

Fig. 1
Fig. 1. Organization of midbrain dopamine input into the tubular striatum and nucleus accumbens.
a Schematic of tracing paradigm. DATIRES -Cre mice were injected into their VTA with AAV.FLEX.hSyn.mGFP.synaptophysin.mRuby allowing for mGFP expression in DAT+ cell bodies and synaptophysin.mRuby+ puncta in the terminals of DAT+ cells. Approximately 3 weeks later, coronal sections throughout the ventral striatum were collected for later fluorescence imaging and quantification of synaptophysin.mRuby+ puncta. Some aspects created in BioRender. Wesson, D. (2024) https://BioRender.com/g16b141. b Example of synaptophysin.mRuby expression throughout the ventral striatum in one mouse, with key regions of interest outlined by dashed lines. c Quantification of synaptophysin+ puncta throughout the anterior-posterior spans of regions of interest (n = 6 mice). Data are mean ± SEM and smoothed for visualization purposes only. d Histograms representing data in (c) with regions of interest segregated into their most anterior and posterior aspects (anterior most half vs. posterior most half, with the anterior or posterior-most 200 µm used for quantification of these regions. Points = individual mice. *p < 0.05 (ANOVA with multiple comparison corrections; see Results for absolute p values). abbreviations: VTA (ventral tegmental area), NAcSh (nucleus accumbens shell), NAcC (nucleus accumbens core), mTuS (medial aspect of the tubular striatum), LatTuS (lateral aspect of the tubular striatum), PCX (piriform cortex). Source data are provided as a Source Data file.
Fig. 2
Fig. 2. Self-motivated spontaneous sniffing is associated with DA levels.
a Setup for measurement of respiration by both whole-body plethysmography and intranasal pressure. bi Respiration acquired by both modalities in an awake mouse, with a zoomed in inset. bii Example latency during a sniffing bout (n = 125 respiratory cycles). Respiratory traces (top) show an intranasal pressure peaks aligned to time 0, and a plethysmograph peak detected < 60 ms later in one mouse. biii Respiratory frequencies from the approach in (a). c Schematic of fiber photometry and plethysmograph system to record GRABDA signals and sniffing by plethysmograph. d Fiber implant locations (n = 7 mice/group) with the color corresponding to that in Figs. 2f–h and 3c–h. e Example 465 nm GRABDA and 405 nm UV signals in the TuS during resting/quiescent behavioral state (ei) and upon a spontaneous sniff bout (eii). resp = respiration. f, g, and h show averaged GRABDA relative to sniff bout onset and also scatterplots of the relationship between GRABDA levels (peak z-score) and average sniff frequency in mice from the TuS (f; r = 0.29, p = 0.008; tests in f, g, h are Pearson correlations)), NAcSh (g; r = 0.12, p = 0.249), or NAcC (h; r = 0.038, p = 0.703). Abbreviations: resp (respiration), Inst Hz (instantaneous frequency). Data in (fi), (gi), and (hi) are mean ± SEM (n = 7 mice/group) and are smoothed for visualization only, with box plots displaying average sniffing bout duration (mean ± 25th and 75th percentiles, with whiskers as minima and maxima). Source data are provided as a Source Data file. Panels (a and c) were created in BioRender. Wesson, D. (2024) https://BioRender.com/q02t194.
Fig. 3
Fig. 3. Bidirectional DA dynamics upon sensory-driven sniffing.
a Setup for measurement of respiration during GRABDA photometry. Some aspects created in BioRender. Wesson, D. (2024) https://BioRender.com/w71o057. b Example 465 nm GRABDA and 405 nm UV signals recorded in the TuS upon odor delivery. resp = respiration. ce Odor-evoked sniffing and GRABDA in the TuS (c), NAcSh (d), and NAcC (e). Sniffing frequency of TuS (ci), NAcSh (di), and NAcC (ei) implanted mice across repeated odors. Mean shown in black, individual mice in light gray. Averaged GRABDA in TuS (cii), NAcSh (dii), and NAcC (eii). Averaged peak of z-scored GRABDA in the TuS (ciii), NAcSh (diii), and NAcC (eiii). Mean shown in black with individual mice across trials colored as in Fig. 2d. Correlations between GRABDA and average sniff frequency during bout in TuS, (r = 0.65, p < 0.0001, civ) and NAcSh (r = 0.51, p = 0.002, div) but not in NAcC (r = −0.14, p = 0.414, eiv; Pearson correlations). fh Buzz-evoked sniffing and GRABDA from same mice in TuS (f), NAcSh (g), and NAcC (h). Data in (fh) organized as in ce. Correlation between GRABDA and sniffing in the TuS, (r = 0.43, p = 0.011, fiv), but not NAcSh (during buzz: r = −0.17, p = 0.316; upon buzz offset: r = −0.074, p = 0.673, giv) or NAcC (r = −0.22, p = 0.194, hiv; Pearson correlations). i Comparison of evoked GRABDA in TuS, NAcSh, and NAcC. Data are mean ± SEM. Individual points = individual mice. ****p < 0.0001, ***p < 0.001, **p < 0.01. Data shown in (cii), (dii), (eii), (fii), (gii), and (hii) are smoothed for visualization. Source data are provided as a Source Data file.
Fig. 4
Fig. 4. Initiation of sniffing by DA release into the ventral striatum.
a Schematic of optogenetically-evoked sniffing paradigm. Control mice received AAV-Ef1α-DIO-EYFP. Some aspects created in BioRender. Wesson, D. (2024) https://BioRender.com/j05r121. b Optic fiber locations. c Respiration from a mouse across repeated trials of optogenetic stimulation in TuS (1 s long, 25 Hz, blue horizonal line). Raw is on left, with corresponding across-trial data on right. d 2-dimensional histograms across all mice tested (n = 11 TuS, 6 NAcSh and NAcC, 9 EYFP), showing individual trial data within mice. Example data from (c) denoted by the white star. e Mean Hz ± SEM during photostimulation. f Mean frequency ± SEM of photostimulation-evoked sniffing. Group colors as in (e). g Outcomes of optogenetically-evoked sniffing during 1 s photostimulation. All data presented as mean ± SEM, points = individual mice. ****p < 0.0001, ***p < 0.001, **p < 0.01 (ANOVA with multiple comparison correction, see Results for actual p values). gi Mean latency with animals that failed to reach 6 Hz on > 40% of trials excluded from the EYFP group. gii Mean percentage of time spent sniffing. giii Max sniffing frequency. giv Mean probability that photostimulation evoked sniffing. h Mean respiratory frequency during different photostimulation durations (100 ms, 1 s, 2 s, 4 s) compared to that of controls stimulated for 1 s in the TuS (hi), NAcSh (hii), and NAcC (hiii). Insets = percentage of time across all groups, calculated in a 4 s window. In all panels when depicting a singular bar with whiskers, data are mean ± SEM. Individual data points = individual mice. Source data are provided as a Source Data file.
Fig. 5
Fig. 5. State-dependence of a unique DA-evoked sniffing pattern.
a Respiration from a urethane-anesthetized mouse across repeated trials of optogenetic stimulation in TuS (1 s long, 25 Hz, blue horizonal line). Raw is on left, with corresponding across-trial frequency on right. b 2-dimensional histograms across all mice tested within each group (n = 5/group) showing individual trial data within mice. Example data from (a) denoted by the white star. c Averaged z-scored respiratory frequency (n = 5 mice/group). Stimulation onset is denoted by a vertical dotted black line and duration by a horizontal blue dotted line. Inset shows the evoked z-scored average across all groups during light stimulation. Data are mean ± SEM. d Overview of machine learning applied to respiratory traces starting with dynamic time warping (DTW) between a 1 s odor-evoked sniff bout and 1 s opto-evoked sniff bout. Bin size=10 ms. 1s-long respiratory traces (100 Hz) were converted to instantaneous frequency traces (also 1 s long) and subjected to DTW to assess distance in proximal time-points. Subsequently, a model was trained on experimenter-identified traces from either buzz-, odor-, spontaneous-, or photostimulation-evoked respiration that were also previously subjected to DTW (see “Methods”). ei F1 score (single metric of model performance) for sniff types based on number of samples used per class. SMOTE = 70 samples. eii Confusion matrix from SMOTE analyzed data displaying the classifier accuracy in predicting optogenetic-, odor-, buzz-, or spontaneously-evoked sniffing bouts. Classifier was trained on 80% of samples and tested on remaining 20%. Source data are provided as a Source Data file.
Fig. 6
Fig. 6. Inhibition of DA release into the ventral striatum and sniffing.
a Schematic of optogenetically-inhibited sniffing paradigm. 560 nm light was used to activate eNpHR and 405 nm light was used for controls. Some aspects created in BioRender. Wesson, D. (2024) https://BioRender.com/j05r121. b Bilateral optic fiber implant locations in the TuS (n = 6) and NAcSh (n = 5). c Representative bilateral implant in the TuS from a single mouse. di Example of respiration during photoinhibition periods. Raw respiratory trace (resp) is shown with interpolated instantaneous frequency above (Inst Hz). 560 nm LED duration indicated by red shaded box. dii. Normalized respiratory frequency during the 3 s before light stimulation compared to respiratory frequency during 5 s light stimulation (405 nm stimulation—left, 560 nm stimulation—right). Blue dots indicate TuS implanted mice, green dots indicate NAcSh implanted mice. **p < 0.01. (ANOVA, see Results for actual p value; n = 6 TuS mice, 5 NAc mice). Data are mean ± SEM. e Average instantaneous sniffing frequency of TuS (ei) and NAcSh (eii) implanted mice across repeated odor presentations with concurrent delivery of 560 nm or 405 nm light. Mean during 560 nm concurrent light delivery shown in red, with individual mouse data across trials shown in light red. Mean during 405 nm concurrent light delivery shown in gray, with individual mouse data across trials shown in light gray. f Average instantaneous sniffing frequency of TuS (fi) and NacSh (fii) implanted mice across repeated buzz presentations with concurrent delivery of 560 nm (red) or 405 nm (gray) light. Source data are provided as a Source Data file.
Fig. 7
Fig. 7. Ventral striatum neuron activity is coupled with sniffing.
ai Continuous recording of intranasal respiration (blue, inhale = upward deflection) along with single-unit activity from three example units in the TuS (aii = magnified inset). Shaded boxes = non-novel odor delivery. Red line = z-scored root mean square (RMS) of the respiration. b Distribution of respiratory frequencies from the mice (n = 3) during both spontaneous and odor-delivery periods. ci Spike raster plots from the three units in (a). cii Averaged peri-stimulus time histogram of all units aligned to sniffing (n = 19, mean ± SEM; 50 ms bins). di The relationship between respiration and firing frequency for one unit (n = 167 trials, each data point was jittered between −0.25 to 0.25 on x-axis for visualization), with linear regression. dii Boxplot showing that more spikes occur (n = 19 units, across 3 mice) during high versus low frequency respiration, and that this was greater when animals spontaneously transitioned into sniffing during the inter-trial interval than when sniffing during an odor. ei and eii Normalized instantaneous respiratory frequency relative to either the first spike or final spike of all units (n = 19 single units obtained from the three mice, ei or eii, respectively). ***= (repeated measure ANOVA, p < 0.0001, pairwise comparison, p < 0.05; see Results). The boxplot displays the median, the first and third quartiles (edges of the box), and the whiskers, which represent the data extremes. All statistical tests are two-sided. Source data are provided as a Source Data file.
Fig. 8
Fig. 8. Sniffing is associated with recruitment of D1 and D2 spiny projection neurons.
a Fiber photometry schematic in head-fixed mice. Aspects created in BioRender. Wesson, D. (2024) https://BioRender.com/v60o506. b Optic fiber implant locations. c Activity of D1 and D2 neurons in the TuS during spontaneous sniffing. ci Mean D1 and D2 neuron activity aligned to spontaneous sniff bout onset (D1, n = 4, D2, n = 5 mice). Box plots = average bout duration (including mean line, a box of 25th-75th percentiles, and whiskers showing min to max values). cii Average peak of GCaMP (D1, n = 4, 2 points/mouse. D2, n = 5, 2points/mouse). ciii Mean sniffing instantaneous frequency (same samples as in Cii). While there was no correlation between GCaMP signal in D1 neurons (peak z-score during a bout) and average sniff frequency during the bout, p > 0.05), there was in D2 neurons (cv, p < 0.0001, Person’s correlation, see Results for absolute p values). d Activity of D1 and D2 TuS neurons during odor-evoked sniffing. di Average sniffing frequency of both D1-cre (n = 4, 2 sessions/mouse) and D2-cre (n = 5, 2 sessions/mouse) mice across repeated odors (individual mice = light gray). GCaMP responses across odor presentations in D1-(dii and diii) and D2-mice (div and dv) with both groups compared in (dvi). Data in (ci), (dii) and (div) smoothed for visualization purposes. In all panels when depicting a singular bar with whiskers, data are mean ± SEM. Source data are provided as a Source Data file.
Fig. 9
Fig. 9. DA binding to D1 and D2 ventral striatum receptors contributes to sniffing.
a Drug infusion cannulae implant locations. Position relative to bregma. b Diagram of pharmacological manipulation and behavioral paradigm. Aspects created in BioRender. Wesson, D. (2024) https://BioRender.com/p44g816. c Impact of selective antagonism of D1- (ci), D2- (cii), and D3-receptors (ciii) on spontaneous sniffing. D3 antagonism had no effect on spontaneous sniffing in the TuS or NAcSh (ciii, p > 0.05). d Impact of selective antagonism of D1- (di), D2- (dii), and D3-receptors d(diii) on odor-evoked sniffing. D1 and D3 antagonism had no effect on odor-evoked sniffing in the TuS or NAc (di & diii, p > 0.05). e Impact of selective antagonism of D1- (ei), D2- (eii), and D3-receptors (eiii) on buzz-evoked sniffing. D2 and D3 antagonism had no effect on buzz-evoked sniffing in the TuS or NAc (eii & eiii, p > 0.05). Data are mean (dark bolded line) ± SEM, lighter lines = individual mice. Abbreviations: SCH (D1 antagonist SCH23390), RAC (D2 antagonist raclopride), PG0 (D3 antagonist PG010370), VEH (vehicle). ****p < 0.0001, **p < 0.01, *p < 0.05 (All tests are ANOVA, see Results for absolute p-values). For ce, n = 13 mice in TuS, 13 in NAcSh. Source data are provided as a Source Data file.

Update of

References

    1. Wachowiak, M. All in a sniff: olfaction as a model for active sensing. Neuron71, 962–973 (2011). - PMC - PubMed
    1. Uchida, N., Kepecs, A. & Mainen, Z. F. Seeing at a glance, smelling in a whiff: rapid forms of perceptual decision making. Nat. Rev. Neurosci.7, 485–491 (2006). - PubMed
    1. Welker, W. I. Analysis of sniffing in the albino rat. Behavior22, 223–244 (1964).
    1. Youngentob, S. L., Mozell, M. M., Sheehe, P. R. & Hornung, D. E. A quantitative analysis of sniffing strategies in rats performing odor discrimination tasks. Physiol. Behav.41, 59–69 (1987). - PubMed
    1. Kepecs, A., Uchida, N. & Mainen, Z. F. Rapid and precise control of sniffing during olfactory discrimination in rats. J. Neurophysiol.98, 205–213 (2007). - PubMed

Publication types

Grants and funding

LinkOut - more resources