

Metabolomic profiling of saliva from cystic fibrosis patients
- PMID: 39747338
- PMCID: PMC11696459
- DOI: 10.1038/s41598-024-84191-9
Metabolomic profiling of saliva from cystic fibrosis patients
Abstract
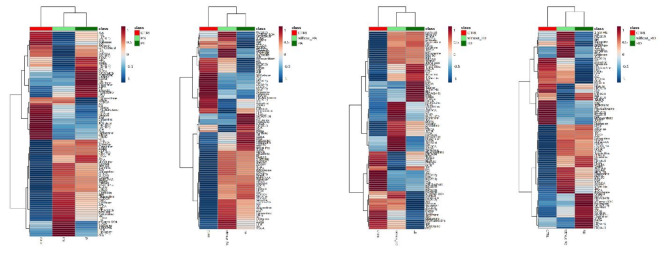
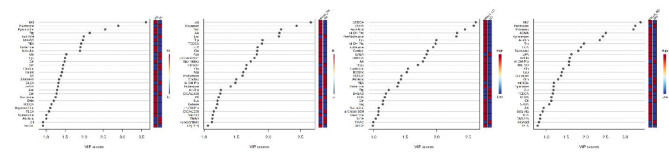
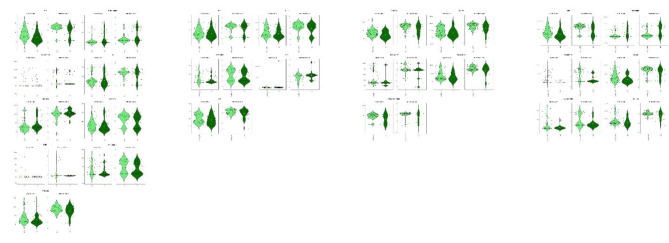
The development of targeted therapies that correct the effect of mutations in patients with cystic fibrosis (CF) and the relevant heterogeneity of the clinical expression of the disease require biomarkers correlated to the severity of the disease useful for monitoring the therapeutic effects. We applied a targeted metabolomic approach by LC-MS/MS on saliva samples from 70 adult CF patients and 63 age/sex-matched controls to investigate alterations in metabolic pathways related to pancreatic insufficiency (PI), Pseudomonas aeruginosa (PA) colonization, CF liver disease (CFLD), and CF related diabetes (CFRD). Sixty salivary metabolites were differentially expressed, with 11 being less abundant and 49 more abundant in CF patients. Among these, the most relevant alterations involved salivary ADMA, N-acetylornithine, methionine and methionine sulfoxide levels. Furthermore, methionine was significantly lower in CF patients with PI and salivary histamine levels were significantly lower in patients colonized by PA. Moreover, ADMA as well as N-acetylornithine and methionine were significantly lower in CF patients with CFRD than in patients without CFRD. Finally, the levels of DOPA resulted significantly lower in saliva from patients with liver disease. Our study revealed an imbalance in arginine methylation and tryptophan pathway related to CFRD and PI as well as alterations in dopaminergic pathway and Krebs cycle related to CFLD. This study also highlights different salivary metabolites as new potential biomarkers in a non-invasive sample that could represent a useful tool for the stratification and management of CF patients.
Keywords: Pseudomonas aeruginosa colonization; CF liver disease; CF related diabetes; Cystic fibrosis; Metabolomics; Pancreatic insufficiency.
© 2024. The Author(s).
Conflict of interest statement
Declarations. Competing interests: The authors declare no competing interests. Ethics approval and consent to participate: The study was conducted in accordance with the Declaration of Helsinki and approved by CF regional Centre of Campania (Ethics Committee number 77/2021). The participants provided their written informed consent to participate in this study.
Figures


Similar articles
-
Distinctive metabolic profiles between Cystic Fibrosis mutational subclasses and lung function.Metabolomics. 2021 Jan 4;17(1):4. doi: 10.1007/s11306-020-01760-5. Metabolomics. 2021. PMID: 33394183
-
Altered carbohydrate composition of salivary mucins from patients with cystic fibrosis and the adhesion of Pseudomonas aeruginosa.Am J Respir Cell Mol Biol. 1993 Sep;9(3):323-34. doi: 10.1165/ajrcmb/9.3.323. Am J Respir Cell Mol Biol. 1993. PMID: 8398170
-
Serum metabolomics indicate altered cellular energy metabolism in children with cystic fibrosis.Pediatr Pulmonol. 2014 May;49(5):463-72. doi: 10.1002/ppul.22859. Epub 2013 Jul 12. Pediatr Pulmonol. 2014. PMID: 23847148
-
Metabolomics Panel Associated with Cystic Fibrosis-Related Diabetes toward Biomarker Discovery.ACS Omega. 2024 Jul 17;9(30):32873-32880. doi: 10.1021/acsomega.4c03626. eCollection 2024 Jul 30. ACS Omega. 2024. PMID: 39100315 Free PMC article.
-
Cystic Fibrosis-Related Diabetes Workshop: Research Priorities Spanning Disease Pathophysiology, Diagnosis, and Outcomes.Diabetes. 2023 Jun 1;72(6):677-689. doi: 10.2337/db22-0949. Diabetes. 2023. PMID: 37125945 Free PMC article. Review.
Cited by
-
Photoaffinity Ligand of Cystic Fibrosis Corrector VX-445 Identifies SCCPDH as an Off-Target.ACS Chem Biol. 2025 Jul 18;20(7):1560-1573. doi: 10.1021/acschembio.5c00157. Epub 2025 Jun 20. ACS Chem Biol. 2025. PMID: 40539870 Free PMC article.
References
Publication types
MeSH terms
Substances
Grants and funding
LinkOut - more resources
Full Text Sources
Medical
Research Materials
Miscellaneous
