. 2025 Jan 2;15(1):174.
doi: 10.1038/s41598-024-83740-6.

Constitutive activation of the Src-family kinases Fgr and Hck enhances the tumor burden of acute myeloid leukemia cells in immunocompromised mice

Affiliations

Constitutive activation of the Src-family kinases Fgr and Hck enhances the tumor burden of acute myeloid leukemia cells in immunocompromised mice

Sherry T Shu et al. Sci Rep. .

Abstract

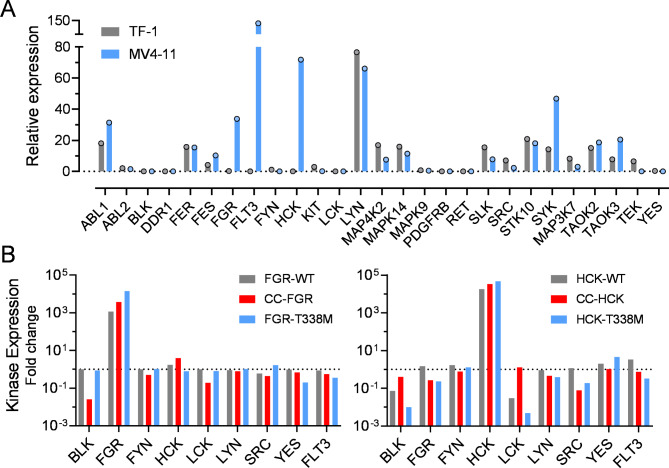
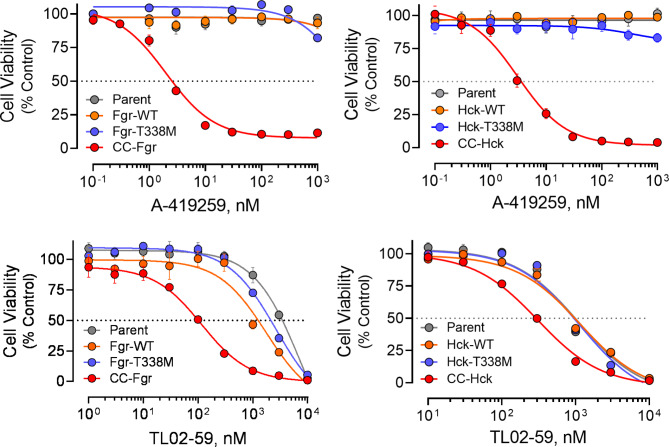
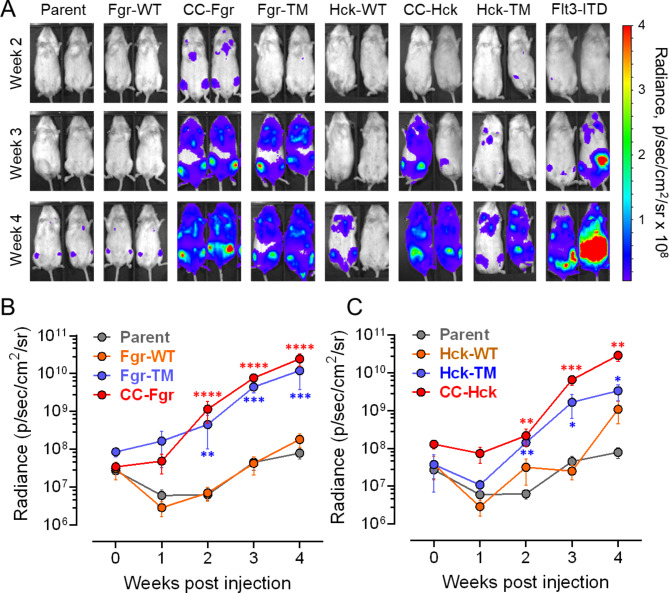
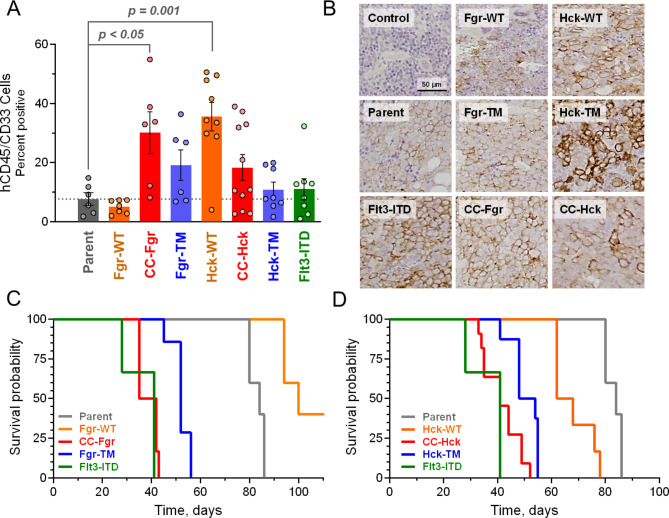
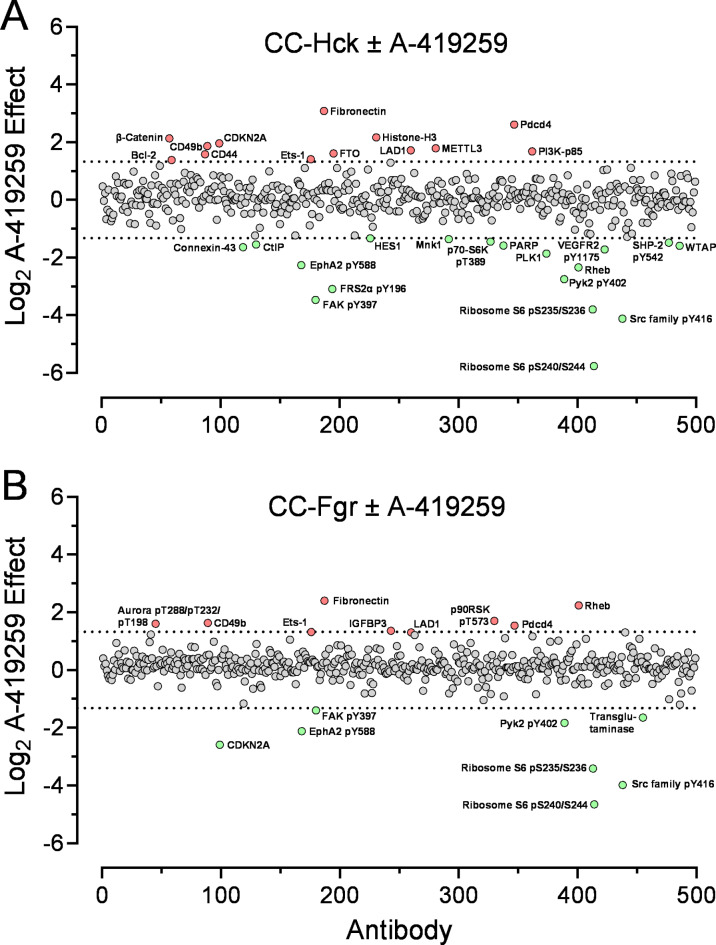
Overexpression of the myeloid Src-family kinases Fgr and Hck has been linked to the development of acute myeloid leukemia (AML). Here we characterized the contribution of active forms of these kinases to AML cell cytokine dependence, inhibitor sensitivity, and AML cell engraftment in vivo. The human TF-1 erythroleukemia cell line was used as a model system as it does not express endogenous Hck or Fgr. To induce constitutive kinase activity, Hck and Fgr were fused to the coiled-coil (CC) oligomerization domain of the breakpoint cluster region protein associated with the Bcr-Abl tyrosine kinase in chronic myeloid leukemia. Expression of CC-Hck or CC-Fgr transformed TF-1 cells to a granulocyte-macrophage colony-stimulating factor (GM-CSF)-independent phenotype that correlated with enhanced phosphorylation of the kinase domain activation loop. Both CC-Hck and CC-Fgr cell populations became sensitized to growth arrest by Src-family kinase inhibitors previously shown to suppress the growth of bone marrow cells from AML patients in vitro and decrease AML cell engraftment in immunocompromised mice. Methionine substitution of the 'gatekeeper' residue (Thr338) also stimulated Hck and Fgr kinase activity and transformed TF-1 cells to GM-CSF independence without CC fusion. TF-1 cells expressing either active form of Hck or Fgr engrafted immunocompromised mice faster and developed more extensive tumors compared to mice engrafted with the parent cell line, resulting in shorter survival. Expression of wild-type Hck also significantly enhanced bone marrow engraftment without an activating mutation. Reverse phase protein array analysis linked active Hck and Fgr to the mammalian target of rapamycin complex-1/p70 S6 ribosomal protein (mTORC-1/S6) kinase and focal adhesion kinase (Fak) signaling pathways. Combining Hck and Fgr inhibitors with existing mTORC-1/S6 kinase or Fak inhibitors may improve clinical responses and reduce the potential for acquired resistance.


Conflict of interest statement

Competing interests: The authors declare that they have no competing interests.

Figures

Fig. 1
Fig. 1
Transcription profiles of Src-family kinase expression in cell lines used in this study. (A) Relative mRNA expression profiles of A-419259 and TL02-59 target kinases previously identified by KINOMEscan analysis were determined for the AML cell lines TF-1 and MV4-11 by qPCR. ΔCt values for each kinase relative to GAPDH were determined first. To generate the expression profiles, the average ΔCt value for all kinases in each cell line was subtracted from each individual ΔCt value and the base 2 antilog of the resulting ΔΔCt values were plotted as shown. Each data point represents the average of three independent determinations. (B) Profiling of all eight Src-family kinases and Flt3 expression in TF-1 cell populations transduced with wild-type (WT), coiled-coil (CC) fusions, and gatekeeper mutants (T338M) of FGR (left) and HCK (right). Using the same qPCR primer–probe sets from panel A, ΔCt values for each kinase relative to GAPDH were determined for each of the indicated cell populations. The corresponding ΔCt value for parental TF-1 cells (from part A) was subtracted from each of these ΔCt values and the base 2 antilog of the resulting ΔΔCt values were plotted as fold change relative to the TF-1 parent cells. The dotted line indicates the basal expression level in the parental TF-1 cells. All experiments were performed in triplicate, and the bar height indicate the resulting mean values.
Fig. 2
Fig. 2
Molecular model of a CC-Fgr fusion protein and binding modes for the Src-family kinase inhibitors, A-419259 and TL02-59. (A) Hypothetical structural model of a Src-family kinase-coiled-coil (CC) fusion protein. The N-terminal 70 amino acid CC domain of BCR was fused to the N-terminal end of Fgr (shown) and Hck. Model is based on the X-ray crystal structure of near-full-length Fgr bound to the ATP-site inhibitor A-419259 (not shown in model). In this structure, Fgr forms a homodimer with the kinase domain activation loop of one monomer (kinase-2; green) engaging the active site of the other (kinase-1; grey). Also shown are the SH3 (red) and SH2 (blue) domains, the SH2-kinase linker (orange) and the negative regulatory tail (cyan). The unique domain is unstructured (dotted line). The model was produced using PyMol (Schrödinger) and the PDB coordinates for the BCR CC domain (PDB ID: 1K1F) and Fgr (PDB ID: 7UY0). (B, C) ATP-site inhibitors A-419259 and TL02-59 induce distinct conformations of the Fgr kinase domain. Overall kinase domain structures are shown at left, with close-up views of the binding sites at right. A-419259 induces outward rotation of the N-lobe αC-helix (blue), with the DFG motif (orange) flipped inward. TL02-59 causes inward rotation of αC-helix with the DFG motif flipped outward. In both cases, the gatekeeper residue (T338) makes direct contact with the inhibitor; both ligands also interact with hinge residues connecting the N- and C-lobes of the kinase domain (E339 and M341). Models produced with PyMol and crystal coordinates for near-full-length Fgr bound to A-419259 (PDB ID: 7UY0) or TL02-59 (PDB ID: 7UY3).
Fig. 3
Fig. 3
Active forms of Fgr and Hck induce cytokine-independent growth of TF-1 myeloid cells. The human erythroleukemia cell line TF-1 was transduced with recombinant retroviruses carrying wild-type (WT) full-length Fgr and Hck as well as coiled-coil (CC) fusions and kinase domain gatekeeper mutants (T338M). Cells transduced with Flt3-ITD were included as a positive control. Cell growth was monitored over four days using the Cell Titer-Blue cell viability assay (Promega). All time points were assayed in triplicate and the mean fluorescence value, corrected for background, is shown ± SE (in most cases the error bars are smaller than the data points).
Fig. 4
Fig. 4
Protein levels and autophosphorylation of Fgr and Hck following expression in TF-1 cells. TF-1 cells expressing wild-type (WT), CC fusion, or gatekeeper mutant (T338M) forms of Fgr or Hck were lysed and kinase proteins isolated by immunoprecipitation. Aliquots of each immunoprecipitate were resolved by SDS-PAGE, transferred to nitrocellulose membranes, and probed for kinase activation loop autophosphorylation (pTyr416) and kinase protein expression. Immunoreactive bands were quantified with secondary antibodies tagged with infrared dyes and imaged using the LI-COR Odyssey platform. Parent TF-1 cells were also analyzed as a negative control. Each condition includes at least four biological replicates. (A) Representative blot images, with molecular weight (MW) markers indicated in kDa. Uncropped images are provided in the Supplemental Information, Figure S1. (B) Ratios of pTyr416 to kinase expression band intensities were determined for each replicate and average ratio is shown as the bar height ± SE. The individual data points are also shown.
Fig. 5
Fig. 5
Coiled-coil fusion induces an open conformation of Fgr and Hck. A biotinylated SH3 domain capture peptide (VSL12; amino acid sequence VSLARRPLPPLP) was immobilized on streptavidin-coated magnetic beads and incubated with clarified cell lysates from each of the TF-1 cell populations shown. Following incubation and washing, associated kinase proteins were detected by immunoblotting and quantified using the LICOR Odyssey imaging system. Aliquots of each lysate were included on the blots for normalization. Lysates were also incubated with the beads in the absence of the peptide to control for non-specific binding. (A) Representative immunoblots show the expression level in the lysate (Input), captured kinase proteins (VSL12), and non-specific binding to the beads (Control) for each of the six cell populations. Uncropped images are provided in the Supplemental Information, Figure S2. (B) Quantitation of the results from three (Hck) or four (Fgr) independent determinations. The fluorescence intensity of the captured kinases was corrected for non-specific binding and normalized to the intensity of the input protein in each case. Bar heights show the mean normalized intensity ± SE and statistical comparisons were performed by one-way ANOVA; *p < 0.05; ns, not significant.
Fig. 6
Fig. 6
Expression of CC-Fgr and CC-Hck sensitizes TF-1 cells to growth suppression by the Src-family kinase inhibitors, A-419259 and TL02-59. TF-1 cells expressing wild-type (WT), CC fusion, or gatekeeper mutant (T338M) forms of Fgr (left panels) or Hck (right panels), as well as the parent cell line, were treated with A-419259 (upper panels) or TL02-59 (lower panels) over the range of concentrations shown. Following 72 h incubation, cell viability was assessed with the Cell Titer-Blue assay (Promega). Data are expressed as percent viability of cells treated with the DMSO carrier solvent alone (0.1%). All conditions were measured at least in triplicate, and each data point indicates the mean value ± SE. Inhibitor IC50 values determined by non-linear regression analysis are presented in Table 1. Note that TF-1 parent cells, as well as cells expressing the wild-type kinases, are cultured in the presence of GM-CSF while cells expressing the active kinases (CC fusions and T338M gatekeeper mutants) are not.
Fig. 7
Fig. 7
Expression of active forms of Fgr and Hck accelerates AML engraftment in vivo. Immunocompromised (NSG) mice were injected with equal numbers of parental TF-1 cells (Parent) or cells expressing wild-type (WT), CC fusion, or gatekeeper mutant (TM) forms of Fgr or Hck (5 or 6 animals per group). Cells transformed with Flt3-ITD were included as a positive control. Each cell line was also tagged with luciferase to allow in vivo imaging of tumor growth. Mice were imaged immediately following cell injection and weekly for 4 weeks. (A) Representative images of two mice from each group. The radiance scale is shown on the right. (B, C) Quantitative analysis of tumor growth over time based on in vivo image analysis of luciferase activity (B, Fgr cells; C, Hck cells). Statistical comparisons were performed by one-way ANOVA following Log10 transformation of the radiance values. Significant differences were observed between the parent and active kinase-expressing cell populations at 2, 3, and 4 weeks (*p < 0.05; **p < 0.01; ***p < 0.001; ****p < 0.0001). The parent control values are the same on each graph.
Fig. 8
Fig. 8
Active forms of Fgr and Hck promote bone marrow engraftment and reduce survival of NSG mice. Immunocompromised (NSG) mice were injected with equal numbers of control TF-1 cells (Parent) or cells expressing wild-type (WT), CC fusion, or gatekeeper mutant (TM) forms of Fgr or Hck. Cells transformed with Flt3-ITD were included for comparison. Four weeks after cell injection, mice were sacrificed and spleen, bone marrow and peripheral blood were analyzed for the presence of TF-1 cells by flow cytometry with antibodies specific for human cell surface CD45 and CD33. (A) Flow cytometry result for bone marrow cells. Each dot represents one mouse. Bar heights indicate the average percentage of human cells present ± SE. The dotted line indicates the extent of engraftment of parent TF-1 cells. Statistical analysis between all groups was evaluated by one-way ANOVA. (B) Representative thin sections of bone marrow from the groups shown in part A. Human TF-1 cells were visualized by immunohistochemistry with an antibody specific for human CD45. (C, D) Kaplan-Meyer analysis of groups of mice injected with each cell line as indicated. Results from the control groups (Parent, Flt3-ITD) are shown on both panels for comparison. The study ended at 120 days.
Fig. 9
Fig. 9
Reverse phase protein array analysis of Hck and Fgr signaling in TF-1 cells. TF-1 cells expressing (A) CC-Hck or (B) CC-Fgr were treated with A-419259 (300 nM) for 16 h or left untreated. Cell lysates were prepared, spotted on replicate glass slides, and individual slides were probed with antibodies that recognize 499 distinct signaling proteins and phosphoproteins. Differences in immunoreactivity were quantified and plotted as Log2 of the ratio of the treated vs. untreated samples. Each dot represents the result from one antibody, and the results are shown in alphabetical order of each antibody name. The dotted lines correspond to changes greater than 2.5-fold, with points corresponding to decreases shown in green and increases shown in red.
Fig. 10
Fig. 10
Active forms of Hck and Fgr hijack p70 S6 kinase and Fak signaling in AML cells. (A) TF-1 cells expressing active coiled-coil fusions of Hck and Fgr were treated in the presence or absence of A-419259 (300 nM) overnight. Lysates were prepared from these cultures as well as the TF-1 parent and cells expressing wild-type Hck or Fgr. Proteins were separated by SDS-PAGE and transferred to nitrocellulose membranes for immunoblot analysis. Blots were probed for p70 S6 kinase (p70S6K) phosphorylation (pThr389), p70 S6K expression (S6 kinase), ribosomal protein S6 phosphorylation (pSer235/236), Fak phosphorylation (pTyr397) and Fak expression along with Actin. All immunoreactive bands were detected with secondary antibodies tagged with infrared dyes and imaged using the LI-COR Odyssey platform. The positions of the molecular weight markers (in kDa) are shown to the left of each panel. (B) Parental TF-1 cells and cells expressing wild-type Hck or Fgr (cultured in GM-CSF) were treated in the presence or absence of A-419259 (300 nM) overnight, and lysates were blotted with antibodies for p70 S6 kinase phosphorylation, expression, and ribosomal S6 protein phosphorylation as described for part A. Uncropped blot images are provided in the Supplemental Information, Figures S5 and S6 (p70S6 kinase) and S7 (Fak).

Similar articles

Cited by

References

    1. Janke, H. et al. Activating FLT3 mutants show distinct gain-of-function phenotypes in vitro and a characteristic signaling pathway profile associated with prognosis in acute myeloid leukemia. PLoS ONE9, e89560 (2014). - PMC - PubMed
    1. Smith, C. C. et al. Validation of ITD mutations in FLT3 as a therapeutic target in human acute myeloid leukaemia. Nature485, 260–263 (2012). - PMC - PubMed
    1. Griffith, J. et al. The structural basis for autoinhibition of FLT3 by the juxtamembrane domain. Mol. Cell13, 169–178 (2004). - PubMed
    1. Sudhindra, A. & Smith, C. C. FLT3 inhibitors in AML: are we there yet?. Curr. Hematol. Malig. Rep.9, 174–185 (2014). - PubMed
    1. Smith, C. C. et al. Characterizing and overriding the structural mechanism of the Quizartinib-resistant FLT3 “Gatekeeper” F691L mutation with PLX3397. Cancer Discov.5, 668–679 (2015). - PMC - PubMed

Publication types

MeSH terms

Substances