. 2025 Jan;4(1):45-63.
doi: 10.1038/s44161-024-00570-5. Epub 2025 Jan 2.

Direct specification of lymphatic endothelium from mesenchymal progenitors

Affiliations

Direct specification of lymphatic endothelium from mesenchymal progenitors

Irina-Elena Lupu et al. Nat Cardiovasc Res. 2025 Jan.

Abstract

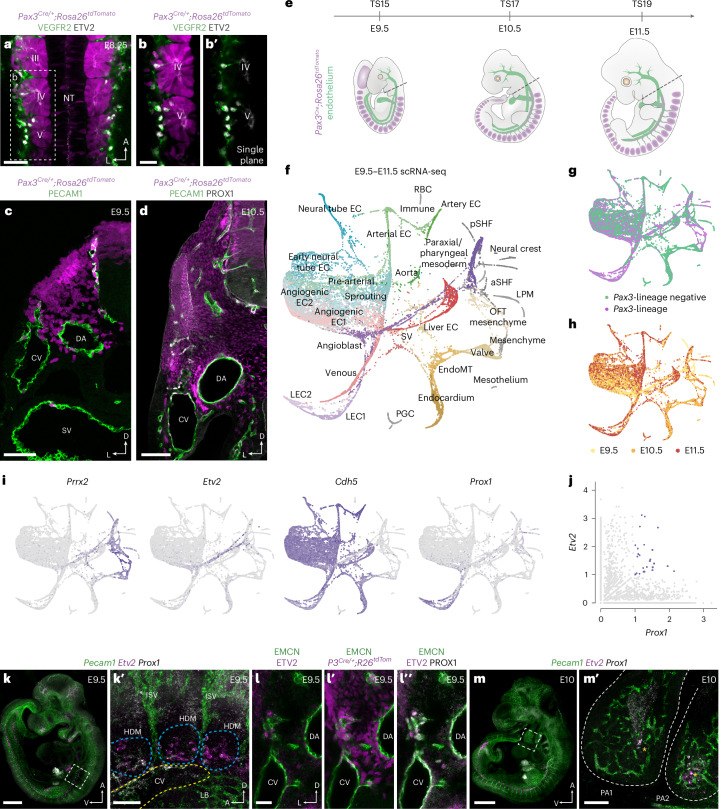
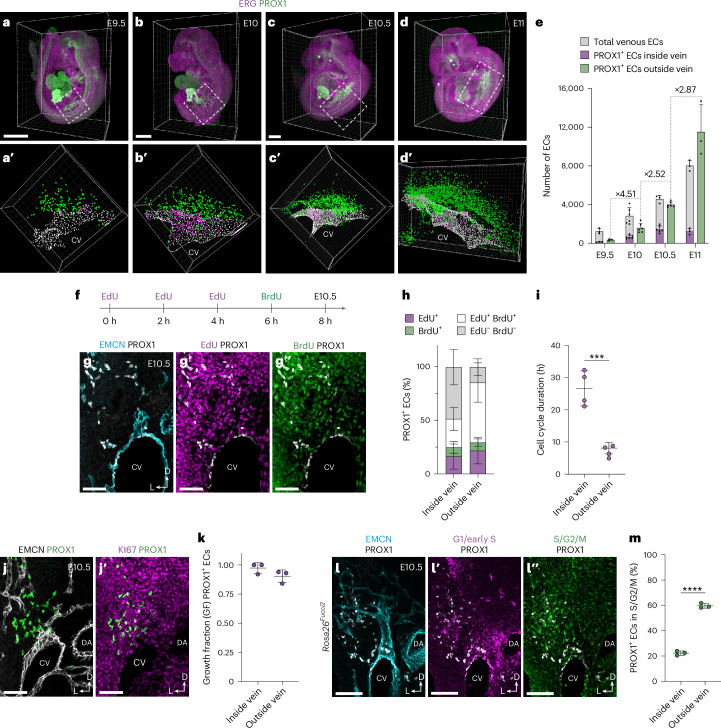
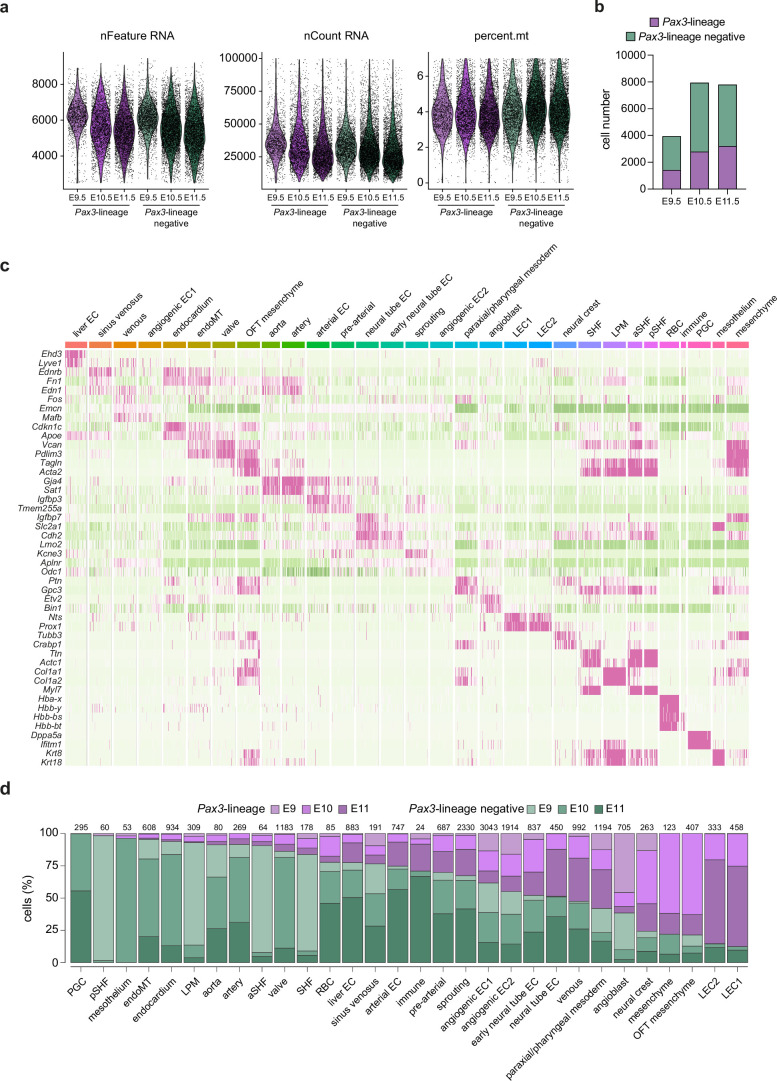
During embryogenesis, endothelial cells (ECs) are generally described to arise from a common pool of progenitors termed angioblasts, which diversify through iterative steps of differentiation to form functionally distinct subtypes of ECs. A key example is the formation of lymphatic ECs (LECs), which are thought to arise largely through transdifferentiation from venous endothelium. Opposing this model, here we show that the initial expansion of mammalian LECs is primarily driven by the in situ differentiation of mesenchymal progenitors and does not require transition through an intermediate venous state. Single-cell genomics and lineage-tracing experiments revealed a population of paraxial mesoderm-derived Etv2+Prox1+ progenitors that directly give rise to LECs. Morphometric analyses of early LEC proliferation and migration, and mutants that disrupt lymphatic development supported these findings. Collectively, this work establishes a cellular blueprint for LEC specification and indicates that discrete pools of mesenchymal progenitors can give rise to specialized subtypes of ECs.


Conflict of interest statement

Competing interests: The authors declare no competing interests.

Figures

Fig. 1
Fig. 1. Spatiotemporal analyses of EC specification.
a, Representative whole-mount immunofluorescence for tdTomato, VEGFR2 and ETV2 in an E8.25 Pax3Cre/+;Rosa26tdTomato embryo. Dorsal view at the level of somites III–V (n = 4). b,b′, High-magnification single confocal plane of boxed area in a, highlighting a population of VEGFR2+ETV2+ angioblasts emerging from the lineage-traced somite. c, Representative immunofluorescence for tdTomato and PECAM1 on a transverse cryosection from a Pax3Cre/+;Rosa26tdtomato embryo at E9.5 (n = 6). d, Representative immunofluorescence for tdTomato, PECAM1 and PROX1 on a transverse vibratome section from a Pax3Cre/+;Rosa26tdTomato embryo at E10.5 (n = 6). e, Schematic highlighting embryonic stages and dissection strategy (dashed line) for scRNA-seq analyses. f, ForceAtlas2 (FA) embedding of 19,699 cells based on PAGA, with each dot representing a single cell. Cellular states were manually annotated based on known gene expression patterns. g, FA embedding showing the relationship between cell lineage and cell state. h, FA embedding showing the relationship between embryonic stage and cell state. i, FA embedding showing gene expression of mesenchymal (Prrx2), angioblast (Etv2), pan-endothelial (Cdh5) and lymphatic endothelial (Prox1) markers. j, Scatterplot showing co-expression of Etv2 and Prox1 in single cells. k,k′, Representative whole-mount analysis of Pecam1, Etv2 and Prox1 expression at E9.5 using HCR shows Etv2 and Prox1 co-expressing cells in the hypaxial somite (n = 6). ll″, Representative immunofluorescence for EMCN, ETV2, PROX1 and tdTomato on transverse vibratome sections from a Pax3Cre/+;Rosa26tdtomato embryo at E9.5 (n = 6). m,m′, Representative whole-mount analysis of Pecam1, Etv2 and Prox1 expression at E10.0 using HCR shows Etv2 and Prox1 co-expressing cells in the pharyngeal arches (n = 6). TS, Thieler stage; aSHF, anterior second heart field; CCV, common cardinal vein; DA, dorsal aorta; HDM, hypaxial dermomyotome; ISV, intersegmental vessel; LB, limb bud; LPM, lateral plate mesoderm; NC mesenchyme, neural crest-derived mesenchyme; NT, neural tube; OFT, outflow tract; PA, Pharyngeal arch; PGC, primordial germ cell; pSHF, posterior second heart field; RBC, red blood cell; SHF, second heart field; SV, sinus venosus. Scale bars, 50 μm (a, c and ll″), 25 μm (b), 100 μm (d, k′ and m′), 500 μm (k), 1 mm (m).
Fig. 2
Fig. 2. Multiomic analysis of paraxial mesoderm-derived endothelium.
a, Weighted nearest neighbor UMAP (wnnUMAP) embedding of single-cell multiome analyses of 3,606 tdTomato+ VEGFR2+ PECAM1+ cells FACS-sorted from Pax3Cre/+;Rosa26tdtomato embryos at E9.5. Cellular states were manually annotated based on known gene expression patterns and downstream analyses. b, Violin plots showing expression of selected genes across each cellular state. c, Representative whole-mount analysis of Pecam1, Etv2 and Lbx1 expression at E9.5 using HCR (n = 6). c′, High-magnification image of boxed area in c highlighting a population of Etv2+ angioblasts emerging from the Lbx1+ hypaxial dermomyotome. d,d′, Representative immunofluorescence for tdTomato, PECAM1 and PROX1 on a transverse vibratome section from an Lbx1Cre/+;Rosa26tdTomato embryo at E10.5 (n = 4). e,e′, Representative immunofluorescence for tdTomato, PECAM1 and PROX1 on a transverse vibratome section from an Lbx1Cre/+;Rosa26tdTomato embryo at E12.5 (n = 4). f, Representative whole-mount analysis of Tll1 and Etv2 expression at E9.5 using HCR (n = 6). High-magnification images of boxed area in f highlighting Tll1 expression in CV ECs (f′) and C1ql2 expression in a subset of Etv2+ angioblasts (f″). g, Representative HCR analysis of Pecam1 and Tll1 on a vibratome section from an E10.5 embryo. g′,g″, High-magnification images of boxed area in g showing Pecam1, Tll1 and Prox1 expression (n = 4). CV, cardinal vein; DA, dorsal aorta; HDM, hypaxial dermomyotome; ISV, intersegmental vessel; pTD, primordial thoracic duct. Scale bars, 500 μm (c and f), 100 μm (c′, d′, e, f′ and g′), 200 μm (d and g), 50 μm (e′).
Fig. 3
Fig. 3. GRN analyses during LEC specification.
a, Weighted nearest neighbor UMAP (wnnUMAP) embedding of single-cell multiome analyses of 3,606 tdTomato+ VEGFR2+ PECAM1+ cells FACS-sorted from Pax3Cre/+;Rosa26tdtomato embryos at E9.5. b, Combined heatmap and dotplot showing TF expression of individual eRegulons and cell type specificity (regulon specificity score), respectively. Activation or repression of gene expression is indicated by (+) or (−). c, Violin plots showing expression of known transcriptional regulators of Prox1 across each cellular state. d, Chromatin profiles at the Prox1 genomic locus for E9.5 pseudobulk and E13.5 bulk ATAC-seq analyses. Pseudobulk profiles are derived from combining cells within each cellular state. e, Zoomed views of regions highlighted in d, including ETV2 ChIP-seq. f, Putative binding of ETS, SOXF, GATA, NFAT and FOX TFs identified with TOBIAS.
Fig. 4
Fig. 4. Temporal analysis of LEC specification from paraxial mesoderm.
Representative immunofluorescence images of tdTomato, PECAM1 and PROX1 on transverse vibratome sections from Pax3CreERT2/+;Rosa26tdTomato embryos at E10.5 after tamoxifen administration at E8 (a,a′) or E9 (b,b′). c, Quantification of percentage tdTomato labeling of PROX1+ ECs present inside or outside of the venous endothelium of Pax3CreERT2/+;Rosa26tdTomato embryos at E10.5, after tamoxifen administration at E8.0 (n = 5, three pregnant dams) or E9.0 (n = 6, three pregnant dams). Each symbol represents data from an individual embryo (*** P < 0.001). Representative immunofluorescence images of tdTomato and PECAM1 on transverse vibratome sections from Pax3CreERT2/+;Rosa26tdTomato embryos at E12.0 after tamoxifen administration at E8.0 (d,d′; n = 6) or E9.0 (e,e′; n = 6). Representative immunofluorescence images of tdTomato, PECAM1 and PROX1 on transverse vibratome sections from Pax3CreERT2/+;Rosa26tdTomato embryos at E12.0 after tamoxifen administration at E8.0 (ff″; n = 6), E9.0 (gg″; n = 6) or E10.0 (hh″; n = 6). i,i′, Representative immunofluorescence image of tdTomato, PECAM1 and PROX1 on a sagittal vibratome section from a Pax3CreERT2/+;Rosa26tdTomato embryo at E13 after tamoxifen administration at E9 (n = 4). jj″, Representative immunofluorescence images of tdTomato, NRP2 and PROX1 on whole-mount skin from Pax3CreERT2/+;Rosa26tdTomato embryos after tamoxifen administration at E9 (n = 5). CV, cardinal vein; DA, dorsal aorta; LS, lymph sac; NT, neural tube; pTD, primordial thoracic duct. Scale bars, 100 μm (a,a′, b,b′, d,d′, e,e′, f′,f″, g′,g″, h′,h″ and i,i′), 200 μm (f, g and h), 250 μm (j), 50 μm (j′,j″). Statistical analyses were performed using unpaired Student’s t-test. Data are presented as mean ± s.d. Source data
Fig. 5
Fig. 5. Quantitative analysis of LEC expansion.
Representative whole-mount immunofluorescence for ERG and PROX1 in E9.5 (a,a′), E10 (b,b′), E10.5 (c,c′) and E11.0 (d,d′) embryos. 3D projections of regions of interest were segmented (a′d′) for temporal quantification of ERG+PROX1 ECs within the venous endothelium, ERG+PROX1+ ECs within the venous endothelium and ERG+PROX1+ ECs outside of the venous endothelium. e, Quantification of total ECs and PROX1+ ECs inside and outside of the venous endothelium between E9.5 and E11.0 (E9.5, n = 3; E10, n = 6; E10.5, n = 6; E11, n = 3). f, Schematic representation of the dual-pulse labeling strategy for analysis of cell cycle dynamics. gg″, Representative immunofluorescence for EMCN, PROX1, EdU and BrdU on a transverse vibratome section from an E10.5 embryo. h, Quantification of labeling of PROX1+ ECs inside and outside of the venous endothelium with EdU and/or BrdU (n = 4). i, Quantification of cell cycle duration inside and outside of the venous endothelium at E10.5 (n = 4, *** P < 0.001). j,j′, Representative immunofluorescence for EMCN, PROX1 and KI67 on a transverse vibratome section from an E10.5 embryo. k, Quantification of growth fraction for PROX1+ ECs present inside or outside of the venous endothelium (n = 3). ll″, Representative immunofluorescence for EMCN, PROX1, mCherry (G1/early S) and mVenus (S/G2/M) on a transverse vibratome section from an E10.5 Rosa26Fucci2 embryo. m, Quantification of PROX1+ ECs in S/G2/M phases of the cell cycle inside or outside of the venous endothelium (n = 3, **** P < 0.001). DA, dorsal aorta. Scale bars, 500 μm (ad), 50 μm (gg″), 100 μm (j,j′ and ll″). Statistical analyses were performed using unpaired Student’s t-test. Data are presented as mean ± s.d. Source data
Fig. 6
Fig. 6. Temporal analyses of LEC morphogenesis.
a, Representative confocal image of Kdr, Flt4 and Etv2 expression in a whole-mount E9.5 embryo using HCR (n = 6). b, Transverse vibratome section showing Kdr, Flt4 and Etv2 expression at the level of dashed line in a (n = 4). b′,b″, High-magnification images of boxed area in b showing Kdr, Flt4 and Etv2 expression. Arrow indicates a Kdr+ cell, arrowhead indicates a Kdr+Etv2+ cell. c, Representative confocal image of Flt4, Prox1 and Etv2 expression in a whole-mount E9.5 embryo using HCR (n = 6). d, Transverse vibratome section showing Flt4, Prox1 and Etv2 expression at the level of dashed line in c (n = 4). d′,d″, High-magnification images of boxed area in d showing Flt4, Prox1 and Etv2 expression. Arrowhead indicates a Flt4+Prox1+Etv2+ cell. Representative whole-mount immunofluorescence for PROX1 and ETV2 and image segmentation in Vegfc+/+ (e,e′) and VegfcLacZ/LacZ (f,f′) embryos at E9.75 (n = 3). Combined in situ hybridization for Ccbe1 and Vegfc and immunofluorescence for PECAM1 (g) or PROX1 (h). i, Immunofluorescence for GM130 and PROX1 on a transverse vibratome section from an E10.5 embryo. Segmentation of GM130+ Golgi and PROX1+ EC nuclei (i′) and vectorization of Golgi orientation for quantification (n = 8) (i″). j, Rose diagram illustrating Golgi orientation in PROX1+ ECs inside and outside of the venous endothelium. Proposed model of LEC differentiation through in situ specification from ETV2+PROX1+ paraxial mesoderm-derived lymphangioblasts in WT (k) and Vegfc−/− (l) embryos; colored circles represent individual cells expressing the indicated genes. DA, dorsal aorta; NT, neural tube. Scale bars, 500 μm (a and c), 100 μm (b, d, g and h), 25 μm (b′ and d′), 200 μm (e and f), 50 μm (i).
Extended Data Fig. 1
Extended Data Fig. 1. Contribution of Pax3-lineage cells to the developing vasculature.
(a) Representative whole mount immunofluorescence for tdTomato and VEGFR2 in a Pax3Cre/+;Rosa26tdTomato embryo at E8.75. Lateral view at the level of somites II-V (n = 4). (b) Representative whole mount immunofluorescence for ERG and tdTomato at the level of the sinus venosus in a Pax3Cre/+;Rosa26tdTomato embryo at E9.25 (n = 4). (b′) High magnification view of boxed area in b. (c) Representative immunofluorescence for PECAM1 and tdTomato on transverse cryosections spanning anterior (i) to posterior (ix) regions of an individual Pax3Cre/+;Rosa26tdTomato embryo at E9.25 (n = 3). (ISV, intersegmental vessel; CCV, common cardinal vein; SV, sinus venosus; CV, cardinal vein; DA, dorsal aorta; UV, umbilical vein; VV, vitelline vein. Scale bars - 50 μm (a,c), 100 μm (b)).
Extended Data Fig. 2
Extended Data Fig. 2. Flow cytometry and FACS sorting strategies.
(a) Flow cytometry analysis of tdTomato labelling of LECs and BECs in Pax3Cre/+;Rosa26tdTomato embryos at E13.5. (b) Flow cytometry analysis of tdTomato labelling of blood endothelial cell (BEC) and lymphatic endothelial cell (LEC) populations in Pax3Cre/+;Rosa26tdTomato embryos at E13.5. Gating strategy to sort individual cells from Pax3Cre/+;Rosa26tdTomato embryos for scRNA-seq at (c) E9.5, (d) E10.5 and (e) E11.5.
Extended Data Fig. 3
Extended Data Fig. 3. scRNA-seq Quality Control.
(a) Quality control (QC) plots showing RNA features, counts and percentage of mitochondrial reads per cell. Cells with less than 2500 detected features (genes), more than 100,000 UMIs (counts) and 7% of mitochondrial reads were excluded from downstream analyses. (b) Histogram showing the number of single cells from each lineage and stage that passed QC. (c) Heatmap showing normalized expression of two diagnostic markers for each cell state. (d) Histogram showing the number and percentage of single cells from each lineage and stage assigned to each cell state. (EC, endothelial cell; OFT, outflow tract; LEC, lymphatic endothelial cell; SHF, second heart field; LPM, lateral plate mesoderm; NC mesenchyme, neural crest derived mesenchyme; aSHF, anterior second heart field; pSHF, posterior second heart field; RBC, red blood cell; PGC, primordial germ cell).
Extended Data Fig. 4
Extended Data Fig. 4. scRNA-seq gene expression analyses.
(a) ForceAtlas2 (FA) embedding showing expression of somitic paraxial mesoderm (Pax3, Lbx1), angioblast/early EC (Tal1), endothelial (Pecam1, Emcn), venous (Nr2f2, Dab2), large vessel (Vwf, Procr), arterial (Dll4, Gja5, Bmx), angiogenic EC (Apln, Kcne3), neural tube EC (Foxq1), lymphatic EC (Prox1, Pdpn, Lyve1) and sinus venosus/liver EC (Oit3, Stab2) markers. (b) Violin plots showing expression of selected genes in Pax3-lineage negative and Pax3-lineage positive cells across indicated cellular states.
Extended Data Fig. 5
Extended Data Fig. 5. Gene expression and trajectory analyses.
Representative immunofluorescence images of PECAM1 and PROX1 (a,b) or VWF and PROX1 (a′,b′) on a transverse vibratome section from an E10.5 embryo (b-b′ - high magnification images of boxed areas in a-a′) (n = 4). In situ hybridization for Cdh5 and Lyve1 (c,d) or Prox1 and Lyve1 (c′d′) on a transverse vibratome section from an E10.5 embryo (d-d′ - high magnification images of boxed areas in c-c′) (n = 4). (e) Partition-based graph abstraction (PAGA) inference of developmental trajectories on 19,699 cells. Cellular states were manually annotated based on known gene expression patterns. FA embedding showing Waddington-OT-based optimal transport analysis of (f) descendants of E9.5 venous cells, (g) descendants of E10.5 venous cells, (h) descendants of E9.5 angioblasts, (i) descendants of E10.5 angioblasts, (j) ancestors of E10.5 LEC progenitors and (k) ancestors of E10.5 LECs. (l-m′) Representative whole mount imaging of Pecam1, Etv2 and Prox1 expression at E9.0 using hybridization chain reaction (n = 6). (n-o′) Representative whole mount imaging of Pecam1, Etv2 and Prox1 expression at E10.0 using hybridization chain reaction (n = 6). (CV, cardinal vein; DA, dorsal aorta; He, heart; LB, liver bud; EC, endothelial cell; LEC, lymphatic endothelial cell; SV, sinus venosus; SHF, second heart field; PXM, paraxial mesoderm; LPM, lateral plate mesoderm; aSHF, anterior second heart field; pSHF, posterior second heart field; RBC, red blood cell; PGC, primordial germ cell; Scale bars - 100 μm (a-a′, c-c′), 50 μm (b-b′, d-d′), 1 mm (l-o′)).
Extended Data Fig. 6
Extended Data Fig. 6. scMultiome Quality Control and gene regulatory network analysis.
(a) Gating strategy to sort individual cells from Pax3Cre/+;Rosa26tdTomato embryos for scRNA-seq at E9.5. (b) Quality control (QC) plots showing RNA features, counts and percentage of mitochondrial reads per cell. (c) Quality control (QC) plots showing ATAC counts, transcription start site (TSS) and percentage nucleosome signal per cell. (d) Weighted nearest neighbour Uniform Manifold Approximation and Projection (wnnUMAP) embedding of single cell multiome sequencing of 3,801 tdTomato+ VEGFR2+ PECAM1+ cells FACS-sorted from Pax3Cre/+;Rosa26tdtomato embryos at E9.5. (e) Heatmap showing normalized expression of two diagnostic markers for each cell state on the subset of 3,606 cells in Fig. 2a. (f) Violin plots showing expression of Pax3, Tal1, Lmo2, Cdh5, Gata4 and Gja5 across each cellular state. (g) Violin plots showing expression of Ebf1 and Ebf2 across each cellular state. (h) Visualisation of the eGRN formed by ETV2, FLI1, ERG, ETS1 and ETS2. The network consists of selected transcription factors and the top 300 most variable regions and genes. (i) Visualisation of the eGRN formed by ETV2, ERG, EBF1 and EBF2. The network consists of selected transcription factors and the regions and genes with the 30 highest triplet scores for each of the chosen eRegulons.
Extended Data Fig. 7
Extended Data Fig. 7. Spatiotemporal analyses of LEC lineage.
Representative immunofluorescence image of VEGFR2 and CreERT2 (detected with an ESR1 antibody) (a, b) or PECAM1 and CreERT2 (a′, b′) on a transverse vibratome section from an E9.5 Pax3CreERT2/+ embryo (b-b′ - high magnification image of boxed area in a-a′) (n = 4). (c-c′) Representative immunofluorescence image of tdTomato, PECAM1 and CreERT2 on a transverse vibratome section from a Pax3CreERT2/+;Rosa26tdTomato embryo at E10.5 following tamoxifen administration at E9 (n = 4). (d-d′) High magnification image of boxed area in c-c′. (e) Quantification of tdTomato labelling of BECs and LECs by flow cytometry in Pax3Cre/+;Rosa26tdTomato and Pax3CreERT2/+;Rosa26tdTomato embryos at E13.5. Tamoxifen was administered to Pax3CreERT2/+;Rosa26tdTomato animals at E7 (n = 3, 1 pregnant dam), E8.0 (n = 4, 2 pregnant dams), E9.0 (n = 5, 3 pregnant dams) or E10.0 (n = 3, 2 pregnant dams). Representative immunofluorescence images of tdTomato, PECAM1 and PROX1 on transverse vibratome sections from (f) Pax3Cre/+;Rosa26tdTomato (n = 3) or (g) Myf5Cre/+;Rosa26tdTomato (n = 4) embryos at E10.5. (h) Quantification of percentage tdTomato labelling of PROX1+ ECs present inside or outside of the venous endothelium in Pax3Cre/+;Rosa26tdTomato or Myf5Cre/+;Rosa26tdTomato embryos at E10.5. (i-i″) Representative immunofluorescence image of tdTomato, PECAM1 and PROX1 on a sagittal vibratome section from a Pax3CreERT2/+;Rosa26tdTomato embryo at E13 following tamoxifen administration at E9 (n = 4). (j-j′) Representative immunofluorescence image of tdTomato, NRP2 and PROX1 on a whole mount heart from a Pax3CreERT2/+;Rosa26tdTomato embryo at E16.0 following tamoxifen administration at E9 (n = 4). (k-k″) Representative immunofluorescence image of tdTomato, PECAM1 and PROX1 on a sagittal vibratome section from a Pax3Cre/+;Rosa26tdTomato embryo (n = 4). (l-l′) Representative immunofluorescence image of tdTomato, NRP2 and PROX1 on a whole mount heart from a Pax3Cre/+;Rosa26tdTomato embryo at E16.0 (n = 4). (DM, dermomyotome; CV, cardinal vein; DA, dorsal aorta; pTD, primordial thoracic duct; LS, lymph sac; Scale bars - 50 μm (a-a′, f, g), 100 μm (c-c′, i′-i″), 200 μm (j-k′), 500 μm (i); Data are presented as mean ± s.d. (error bars)). Source data
Extended Data Fig. 8
Extended Data Fig. 8. Reassessment of the venous origin of lymphatic endothelium.
(a) Violin plots showing expression of Tek in angioblasts at E9.5. (b) Immunofluorescence for tdRFP and PROX1 on a whole mount Tg(Tek-Cre)5326Sato;Rosa26tdRFP embryo at E9.5 (n = 3). Representative immunofluorescence images of tdRFP, PECAM1 and PROX1 on transverse vibratome sections from Tg(Tek-Cre)5326Sato;Rosa26tdRFP embryos at (c-c′) E10.5, (d) E11.5 and (e-e′) E12.5 (n = 3). (f) Quantification of the percentage of lineage traced PROX1+ ECs in Tg(Tek-Cre)5326Sato;Rosa26tdRFP embryos at E9.5-E12.5 (n = 3 per stage). (g-g′) Representative immunofluorescence image of tdTomato, PECAM1 and PROX1 from a transverse vibratome section of a Tg(Tek-Cre)12Flv/J;Rosa26tdRFP embryo at E10.5 (n = 3). Immunofluorescence for EMCN, LYVE1 and PROX1 on transverse vibratome sections from (h-h′) Tg(Tek-Cre)12Flv/J;Prox1+/+ and (i-i′) Tg(Tek-Cre)12Flv/J;Prox1fl/fl embryos at E13.5. (CV, cardinal vein; DA, dorsal aorta; pTD, primordial thoracic duct; LS, lymph sac; Scale bars - 25 μm (c-c′), 50 μm (d, g-g′), 200μm (e, h, i), 100μm (h′, i′); Data are presented as mean ± s.d. (error bars)). Source data
Extended Data Fig. 9
Extended Data Fig. 9. Analysis of LEC proliferation.
(a) ForceAtlas2 (FA) embedding of 19,699 cells based on partition-based graph abstraction (PAGA), with each dot representing a single cell. (b) FA embedding showing cell cycle phase in each cellular state. (c) Expression of selected cell cycle-related genes in single cells in angioblast, venous, LEC progenitor and lymphatic states. (d) Dual-pulse labelling strategy for analysis of cell proliferation. (e) Representative immunofluorescence image of ERG and KI67 expression in a transverse vibratome section from an E10.5 embryo (n = 3). (f) Quantification of growth fraction for ECs present inside the CV or DA. (CV, cardinal vein; DA, dorsal aorta; Scale bars - 25 μm (d); Data are presented as mean ± s.d. (error bars)). Source data
Extended Data Fig. 10
Extended Data Fig. 10. Expression and regulation of Vegf ligands and receptors.
(a) Weighted nearest neighbour Uniform Manifold Approximation and Projection (wnnUMAP) embedding of single cell multiome analyses of 3,606 tdTomato+ VEGFR2+ PECAM1+ cells FACS-sorted from Pax3Cre/+;Rosa26tdtomato embryos at E9.5. (b) Violin plots showing expression of Vegf ligands and receptors across each cellular state. (c) Chromatin profiles at the Flt4 genomic locus for E9.5 pseudobulk and E13.5 bulk ATAC-seq analyses. (d) Representative confocal image of Kdr, Vegfa and Etv2 expression in a whole mount E9.5 embryo using hybridization chain reaction (n = 6). (e) Transverse vibratome section showing Kdr, Vegfa and Etv2 expression at the level of dashed line in d (n = 4). (e′-e″) High magnification images of boxed area in f showing Kdr, Vegfa and Etv2 expression. (f) Representative confocal image of Flt4, Vegfc and Etv2 expression in a whole mount E9.5 embryo using hybridization chain reaction (n = 6). (g) Transverse vibratome section showing Flt4, Vegfc and Etv2 expression at the level of dashed line in f (n = 4). (g′-g″) High magnification images of boxed area in g showing Flt4, Vegfc and Etv2 expression. Arrowhead highlighting Etv2/Vegfc double positive cell. (CV, cardinal vein; DA, dorsal aorta; NT, neural tube; DM, dermomyotome. Scale bars - 500 μm (c, e), 100 μm (d, f), 25 μm (d′, f′).

Similar articles

Cited by

References

    1. Oliver, G., Kipnis, J., Randolph, G. J. & Harvey, N. L. The lymphatic vasculature in the 21st century: novel functional roles in homeostasis and disease. Cell182, 270–296 (2020). - PMC - PubMed
    1. Mortimer, P. S. & Rockson, S. G. New developments in clinical aspects of lymphatic disease. J. Clin. Invest.124, 915–921 (2014). - PMC - PubMed
    1. Liu, X. et al. Lymphoangiocrine signals promote cardiac growth and repair. Nature588, 705–711 (2020). - PMC - PubMed
    1. Zhang, F. et al. Lacteal junction zippering protects against diet-induced obesity. Science361, 599–603 (2018). - PMC - PubMed
    1. Huntington, G. S. M. & McClure, C. F. W. The anatomy and development of the jugular lymph sacs in the domestic cat (Felis domestica). Am. J. Anat.10, 177–312 (1910).

MeSH terms