Comparative Study
. 2025 Jan;4(1):64-82.
doi: 10.1038/s44161-024-00588-9. Epub 2025 Jan 2.

Cross-species comparison reveals that Hmga1 reduces H3K27me3 levels to promote cardiomyocyte proliferation and cardiac regeneration

Affiliations
Comparative Study

Cross-species comparison reveals that Hmga1 reduces H3K27me3 levels to promote cardiomyocyte proliferation and cardiac regeneration

Mara Bouwman et al. Nat Cardiovasc Res. 2025 Jan.

Abstract

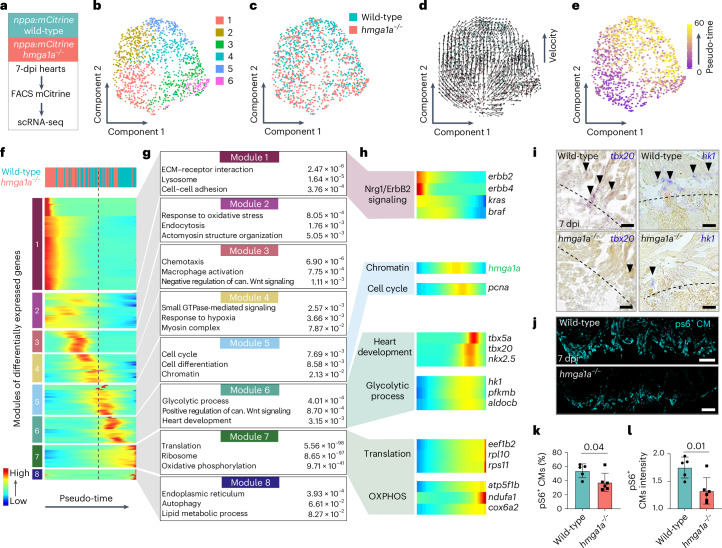
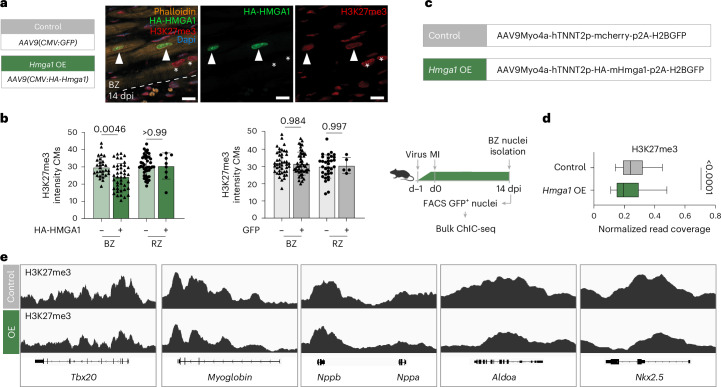
In contrast to adult mammalian hearts, the adult zebrafish heart efficiently replaces cardiomyocytes lost after injury. Here we reveal shared and species-specific injury response pathways and a correlation between Hmga1, an architectural non-histone protein, and regenerative capacity, as Hmga1 is required and sufficient to induce cardiomyocyte proliferation and required for heart regeneration. In addition, Hmga1 was shown to reactivate developmentally silenced genes, likely through modulation of H3K27me3 levels, poising them for a pro-regenerative gene program. Furthermore, AAV-mediated Hmga1 expression in injured adult mouse hearts led to controlled cardiomyocyte proliferation in the border zone and enhanced heart function, without cardiomegaly and adverse remodeling. Histone modification mapping in mouse border zone cardiomyocytes revealed a similar modulation of H3K27me3 marks, consistent with findings in zebrafish. Our study demonstrates that Hmga1 mediates chromatin remodeling and drives a regenerative program, positioning it as a promising therapeutic target to enhance cardiac regeneration after injury.


Conflict of interest statement

Competing interests: D.E.M.d.B. and J.B. are co-inventors on a patent application associated with this study: patent no. PCT/NL2022/050553, ‘Mammalian heart regeneration’. J.B. is co-founder of Myogene Therapeutics. The other authors declare no competing interests.

Figures

Fig. 1
Fig. 1. TOMO-seq reveals transcriptionally distinct regions in the injured mouse heart.
a, Schematic overview of TOMO-seq workflow on injured mouse hearts. b, Three-dpi, 7-dpi and 14-dpi heatmaps showing hierarchical clustering for genes with a clear expression peak (z-score > 1 in more than four consecutive sections). Genes are on the y axis, and section numbers are on the x axis. Each section represents 100 μm of tissue. IA, BZ and RZ indicate consecutive sections with distinct gene profiles, separated by yellow dotted lines. c, Seven-dpi TOMO-seq plots with paired ISH images showing three representative genes for each zone. A total of n = 3 hearts were analyzed per staining. Red dashed lines in TOMO-seq plots indicate borders between IA, BZ and RZ, and black dashed lines in images indicate the border of the IA. Scale bar, 200 μm, which is the same for all ISH images.
Fig. 2
Fig. 2. Interspecies comparison identifies Hmga1a, which spatially and temporally correlates with cardiac regenerative capacity.
a, Schematic overview of the spatially resolved transcriptomic comparison of injured zebrafish and mouse BZs. b, Scatterplot analysis comparing BZ expression as logFC for homologous gene pairs. Gene pairs were selected based on the following criteria: only up in zebrafish (upper left quadrant); zebrafish logFC > 0.5, P < 0.05, and mouse logFC < 0; up in zebrafish and mouse (upper right quadrant); zebrafish logFC > 0.5, P < 0.05, and mouse logFC > 0.5, P < 0.05; down in zebrafish and mouse (lower left quadrant); zebrafish logFC < −0.5, P < 0.05, and mouse logFC < −0.5, P < 0.05; and only up in mouse (lower right quadrant); zebrafish logFC < 0 and mouse: logFC > 0.5, P < 0.05. Statistics were obtained using the R package edgeR, which uses GLMs and empirical Bayes methods to identify differentially expressed genes. NS, not significant. c, Representative images of AFOG staining on 90-dpi wild-type and hmga1a−/− zebrafish hearts, showing muscle in orange, fibrin in red and collagen in blue. Scale bars, 100 μm. d, Quantification of scar size in wild-type (n = 13) and hmga1a−/− (n = 16) hearts at 90 dpi. Datapoints represent individual hearts. Error bars indicate mean ± s.d. Statistics were performed by two-tailed unpaired t-test (P = 0.02). e, Representative images of immunofluorescent staining against Mef2 and PCNA on 7-dpi wild-type and hmga1a−/− zebrafish hearts. Dashed line indicates border with the injury. Overview scale bars, 100 μm; zoom-in scale bars, 20 μm. f, Quantification of proliferating BZ CMs in wild-type (n = 8) and hmga1a−/− (n = 10) hearts at 7 dpi. Datapoints represent individual hearts. Error bars indicate mean ± s.d. Statistics were performed by two-tailed unpaired t-test (P = 0.01). g, Representative images of ISH against hmga1a in uninjured, 1-dpi, 3-dpi and 7-dpi zebrafish hearts. n = 3 hearts were analyzed per condition. Scale bars, 100 μm in overviews and 25 μm in zoom-ins. Dashed line indicates border with the injury. Source data
Fig. 3
Fig. 3. Hmga1 correlates with regenerative capacity of the mammalian heart.
a, Representative ISH for Hmga1 in left ventricular tissue of injured adult mouse hearts (left panel) and in uninjured neonatal P1 mouse hearts (right panel). n = 3 hearts were analyzed per condition. Scale bars, 0.5 mm in the overview and 50 μm in the zoom-ins. Dashed line in the left panel indicates the injury border. b, Representative ISH images of HMGA1 expression in intraventricular septum tissue of an injured adult human heart (left panel) and in an uninjured neonatal human heart (right panel). n = 1 heart was analyzed per condition. Scale bars, 3 mm in the overview and 250 μm in the zoom-ins. Dashed line in the left panel indicates the infarct border. c, qPCR results for Hmga1 on cDNA libraries from whole mouse hearts at different postnatal timepoints. GAPDH was used as a reference gene. Five biological replicates were used per timepoint. Datapoints represent individual biological replicates. Error bars indicate mean ± s.d. Statistics were performed using a one-way ANOVA followed by Dunnett’s multiple comparison test. One-way ANOVA analysis indicates a significant difference in Hmga1 expression between different timepoints (P = 0.0002). Dunnett’s multiple comparison test shows that P7 (P = 0.0022), P14 (P = 0.0049), P24 (P = 0.0003) and P56 (P = 0.002) significantly differ from the P1 timepoint, whereas P3 does not (P = 0.1727). d, Western blot for HMGA1 on protein lysate from 14-dpi ventricles (n = 3) and sham ventricles (n = 3) compared to a P3 ventricle (n = 1). TUBULIN was used as a control protein. Ratios were calculated using TUBULIN. Error bars indicate mean ± s.d. Statistics were performed using a one-way ANOVA followed by Tukey’s multiple comparisons test and show that both 14-dpi samples (P < 0.0001) and sham samples (P < 0.001) significantly differ from the P3 sample. Fourteen-dpi samples and sham samples do not significantly differ from each other (P = 0.021). Source data
Fig. 4
Fig. 4. Hmga1a regulates progression of the regeneration program in BZ CMs.
a, scRNA-seq workflow on nppa:mCitrine+ cells from 7-dpi wild-type (n = 12) and hmga1a−/− (n = 12) hearts. b, UMAP representation of scRNA-seq data after unsupervised clustering by Seurat. c, Distribution of wild-type and hmga1a−/− cells over UMAP. d, RNA velocity plotted on UMAP. Arrows are vectors that indicate the present and future position of a cell in the UMAP based on the ratio of spliced and unspliced reads. e, Pseudo-temporal ordering of cells performed using Monocle 2 represented on UMAP. Scale from 0 to 60 (purple-yellow). f, Self-organizing heatmap of gene modules co-expressed over pseudo-time. Each line represents a single gene. Cells ordered based on pseudo-time are divided in 100 bins. Legend on the top shows the predominant genotype present in each bin. Dashed line indicates the beginning of module 5, containing hmga1a. g, Three representative GO terms and their P value (obtained using DAVID online GO analysis tool) are shown for genes in modules 1–8 of f. can., canonical. h, Heatmaps over pseudo-time of individual genes of interest from modules 1, 5, 6 and 7. Linked biological processes are indicated on the left of the heatmaps; gene names are indicated on the right. i, Representative images from ISH against tbx20 (left) and hk1 (right) showing part of the BZ of wild-type and hmga1a−/− hearts at 7 dpi. n = 3 hearts were analyzed per condition. Dashed line indicates the injury border. Arrowheads indicate tbx20/hk1-expressing CMs. Scale bars, 50 μm. j, Representative images from immunofluorescent staining showing myocardial pS6 in the BZ of wild-type and hmga1a−/− zebrafish hearts at 7 dpi. Scale bars, 100 μm. k,l, Quantification of myocardial pS6 signal in wild-type (n = 5) versus hmga1a−/− (n = 6) 7-dpi BZ. Datapoints represent individual hearts. Error bars indicate mean ± s.d. Statistics were performed by two-tailed unpaired t-test and show a significant difference in percentage of pS6+ area relative to tropomyosin+ area (k) (P = 0.04) and in intensity of pS6 signal relative to tropomyosin signal (l) (P = 0.01). Source data
Fig. 5
Fig. 5. hmga1a OE stimulates CM proliferation resulting in myocardial expansion without pathological remodeling.
a, Workflow of tamoxifen treatment for 14 days of hmga1a OE used in bd. b, Representative images of immunofluorescent staining for GFP, α-actinin and DAPI on a Tg(ubi:Loxp-stop-Loxp-hmga1a-eGFP, myl7:CreERT2) heart at 14 dpT. n = 6 hearts were analyzed. CM-specific nuclear Hmga1a–eGFP can be observed in most CMs. Scale bars, 20 μm. c, Representative images of immunofluorescent staining against Mef2, PCNA and Hmga1a–eGFP on 14-dpT control and hmga1a OE hearts. Arrowheads indicate proliferating CMs. Overview scale bars, 100 μm; zoom-in scale bars, 20 μm. d, Quantification of proliferating CMs in control (n = 5) and hmga1a OE (n = 6) hearts at 14 dpT. Datapoints represent individual hearts. Error bars indicate mean ± s.d. Statistics were performed by two-tailed unpaired t-test and show a significant difference between control and hmga1a OE (P = 0.0009). e, Workflow of tamoxifen treatment for long-term hmga1a OE used in fk. dpf, days post fertilization; 4OH, 4-hydroxytamoxifen. fj, Quantification of differences between control (n = 8) and hmga1a OE (n = 9) hearts, including myocardium-covered surface area (P = 0.0288) (f), total heart surface (myocardium + lumen) (P = 0.1721) (g), the percentage of total heart surface covered with myocardium (P < 0.001) (h), the percentage of proliferating CMs (P = 0.024) (i) and the density of cardiomyocyte nuclei (P = 0.2175) (j). Datapoints represent individual hearts. Error bars indicate mean ± s.d. Statistics were performed using two-tailed unpaired t-tests. k,l, Representative images of AFOG staining on a 1-year control and hmga1a OE zebrafish heart (k) and a 5-month nrg1 OE Tg(β-actin2:loxPmTagBFP-STOP-loxP-Nrg1) heart (l) showing muscle in orange, fibrin in red and collagen in blue. n = 8 control, n = 9 hmga1a OE and n = 1 nrg1 OE hearts were analyzed. Scale bars, 100 μm in the overviews and 50 μm in the zoom-ins. Source data
Fig. 6
Fig. 6. Reduction of repressive H3K27me3 marks by hmga1a OE in zebrafish CMs.
a, Schematic overview for bulk sortChIC (control n = 10, hmga1a OE n = 10) and RNA-seq (control n = 14, hmga1a OE n = 14). b, Heatmap showing read distribution of RNA expression and levels of H3K27me3 and H3K4me3 in control and hmga1a OE CMs. TSS, transcription start site; TES, transcription end site; −1 and +1 indicate the kilobase distance from TSS or TES. c, Quantification of histone mark levels on all genes, comparing normalized read coverage in control versus hmga1a OE CMs. H3K27me3 levels (peak data on n = 21,440 genes) are significantly reduced on gene bodies (P < 0.001), and H3K4me3 levels (peak data on n = 21,843 genes) are significantly increased on promoter regions in hmga1a OE CMs (P < 0.001). Center line indicates median; whiskers indicate 10th/90th percentiles. Statistics were performed using two-tailed unpaired t-tests. d, Representative images of immunofluorescent staining for H3K27me3, tropomyosin (Tpm), Hmga1a–eGFP and DAPI on 14-dpT control and hmga1a OE hearts. Arrowheads indicate Hmga1a–eGFP+ CMs with low H3K27me3. Scale bars, 5 μm. e, Quantification of H3K27me3 signal intensity in single CMs of 14-dpT control (n = 8) versus hmga1a OE (n = 8) hearts. Datapoints represent single CM nuclei measured. Error bars indicate mean ± s.d. Statistics were performed using a one-way ANOVA followed by Tukey’s multiple comparisons test and show a significant difference (P < 0.0001). f, Quantification of H3K27me3 levels on genes upregulated in hmga1a OE CMs (peak data on n = 1,141 genes) and genes downregulated in hmga1a OE CMs (peak data on n = 1,001 genes), comparing normalized read coverage in control versus hmga1a OE CMs. H3K27me3 levels were significantly reduced on gene bodies (P < 0.001) of genes upregulated in hmga1a OE CMs but not significantly different between control and hmga1a OE CMs on gene bodies of genes downregulated upon hmga1a OE. Center line indicates median; whiskers indicate 10th/90th percentiles. Statistics were performed using two-tailed unpaired t-tests. g, Genome tracks of example genes that were significantly upregulated in 14-dpT hmga1a OE CMs and were found downstream of Hmga1a (modules 5–8 in the scRNA-seq). Source data
Fig. 7
Fig. 7. HMGA1 promotes CM proliferation and cardiac regeneration in injured adult mice.
a, Schematic overview for experiments in be. b, Representative image of immunofluorescent staining against PCM-1, HA and EdU. Dashed line indicates the injury border. Arrowheads indicate HMGA1-HA+EdU+ CMs. Scale bars, 100 μm in overview and 20 μm in zoom-in. ce, Quantification of EdU+ (c), Ki67+ (d) and Aurora B+ (e) CMs within the BZ and RZ of hearts transduced with HA-HMGA1. n = 4 hearts were analyzed for EdU and n = 6 for Ki67/Aurora B quantification. Datapoints represent individual hearts. Error bars indicate mean ± s.d. Statistics were performed using a one-way ANOVA followed by Tukey’s multiple comparisons test and show significant differences for % EdU+/Ki67+/AuroraB+ CMs in HMGA1-HA+ BZ CMs compared to HA BZ CMs and RZ HA+/− CMs (P < 0.0001 for all). No significant difference was found between RZ HA and HA+ cells for % EdU+ CMs (P > 0.99), % Ki67+ CMs (P = 0.6972) and % AuroraB+ CMs (P > 0.99). f, Workflow for mouse experiments in gj. g, Representative images of control and Hmga1 OE hearts at 42 dpi stained with Masson’s trichrome. Distance between sections is 400 μm. Scale bars, 1 mm. h, Quantification of scar size in control (n = 10) and Hmga1 OE (n = 9) hearts at 42 dpi showing average % MI length/midline LV length. Error bars indicate mean ± s.d. Statistics were performed by two-tailed unpaired t-test and show no significant difference (P = 0.06). i, Quantification of EF at 14 dpi and 42 dpi of control (n = 13) and Hmga1 OE (n = 13) hearts. Error bars indicate mean ± s.d. Statistics were performed using a two-way ANOVA followed by Sidak’s multiple comparisons test and show a significant difference (P = 0.016). j, Quantification of EF at 42 dpi of sham (n = 13 control, n = 13 Hmga1 OE) and MI (n = 13 control, n = 12 Hmga1 OE) hearts. Datapoints represent individual hearts. Error bars indicate mean ± s.d. Statistics were performed using a one-way ANOVA followed by Tukey’s multiple comparisons test and show a significant difference between control sham/MI hearts (P < 0.0001), between Hmga1 OE sham/MI hearts (P < 0.0001) and between control and Hmga1 OE MI hearts (P = 0.01) but not between control and Hmga1 OE sham hearts (P = 0.6974). Source data
Fig. 8
Fig. 8. Reduction of repressive H3K27me3 marks by HMGA1 in mouse BZ CMs.
a, Schematic overview of experiments (a,b) and representative image of immunofluorescent staining against H3K27me3, HMGA1-HA, phalloidin and DAPI on 14-dpi mouse hearts transduced with AAV9(CMV:HA-Hmga1). Dashed line indicates the injury border. Arrowheads indicate HMGA1-HA transduced CMs; asterisks indicate non-transduced CMs. Scale bar, 5 μm. b, Quantification of H3K27me3 signal intensity in single CMs in the BZ and RZ of 14-dpi Hmga1 (n = 4) and GFP (n = 4) virus transduced hearts. Datapoints represent single CM nuclei measured. Error bars indicate mean ± s.d. Statistics were performed using a one-way ANOVA followed by Tukey’s multiple comparisons test and show a significant difference between HA+ BZ CMs and HA BZ CMs (P = 0.0046). c, Schematic overview for bulk sortChIC on Hmga1 OE CMs (ce). d, Quantification of H3K27me3 levels on all genes, comparing normalized read coverage in control versus Hmga1 OE BZ CMs. H3K27me3 levels (peak data on n = 21,937 genes) are significantly reduced on gene bodies (P < 0.0001) in Hmga1 OE BZ CMs. Center line indicates median; whiskers indicate 10th/90th percentiles. Statistics were performed using a two-tailed unpaired t-test. e, Genome tracks of orthologs to example genes in Fig. 6g that are significantly upregulated in 14-dpT hmga1a OE CMs and were found downstream of Hmga1a (modules 5–8 in the scRNA-seq). Tracks show reduced H3K27me3 levels on genes in Hmga1 OE BZ CMs. Source data
Extended Data Fig. 1
Extended Data Fig. 1. Interspecies comparison of BZ transcriptional profiles.
(a-d) Gene ontologies on BZ transcriptomes shown in Fig. 2b. P-values obtained with DAVID online GO analysis which uses the EASE score, a modified fishers exact p-value. (e) Venn diagram displaying the overlap between genes overexpressed (p < 0.01) in the BZ of the mouse and zebrafish, as defined by the TOMO-seq analysis, as well as with human BZ genes characterized by Kuppe et al., using genes identified in at least two out of three BZ gene lists created (dataset IDs: AKK003_157777, AKK002_157781, AKK001_157785). Human and zebrafish gene names were translated to mouse gene names prior to the intersect analysis. Overlap significance was calculated using the R package Phyper to run a hypergeometric test, showing significance between zebrafish and mouse (p = 1.55e-51), zebrafish and human (p = 4.76e-7 and mouse with human (p = 9.13e-26). (f) Histological validation of BZ genes shared between zebrafish, mouse and humans, using in situ hybridization. n = 3 hearts were analyzed per zebrafish and mouse staining, n = 1 for human. Results for mouse and human BZ genes were described previously. Scale bars represent 100μm in zebrafish heart images, 500μm in mouse heart images and 1000μm in human heart images.
Extended Data Fig. 2
Extended Data Fig. 2. Candidate gene selection and generation of the hmga1a mutant line.
(a) Overview of candidate gene selection starting with TOMO-seq identified zebrafish specific border zone genes. (b) Representative images of in situ hybridization on 7dpi zebrafish hearts against the remaining three candidate genes: hmga1a, khdrbs1a and znfx1. n = 3 hearts were analysed per staining. Scale bars represent 50μm. (c) Normalized expression for Hmga1, Khdrbs1 and Znfx1 obtained by quantitative PCR on cDNA libraries from isolated border zone (BZ) and remote myocardial (RZ) tissue of injured mouse hearts 3 (n = 4), 7 (n = 4) or 14 (n = 6) days post MI. Gene expression was corrected for the geomean of reference genes Hprt and Eefe1e expression from the same sample. Datapoints indicate individual hearts. Error bars indicate mean ± SD. Statistics were performed using two-way ANOVA followed by Tukey’s multiple comparisons test. No differences between the BZ and RZ at 3, 7 or 14dpi was observed for Hmga1 (p = 0.95, p = 0.36, p > 0.99), Khdrbs1 (p > 0.99, p = 0.99, p > 0.99) and Znfx1 (p = 0.99, p = 0.99, p > 0.99). (d) Quantification of proliferating border zone cardiomyocytes based on immunofluorescent staining of Mef2 and PCNA on wildtype (n = 6) and znfx1-/- (n = 5) hearts at 7dpi. Datapoints represent individual hearts. Error bars indicate mean ± SD. Statistics were performed by two-tailed unpaired t-test and shows no significant difference (p = 0.61). (e) Quantification of scar size based on AFOG staining on wildtype (n = 7) and znfx1-/- (n = 9) hearts at 30dpi. Datapoints represent individual hearts. Error bars indicate mean ± SD. Statistics were performed by two-tailed unpaired t-test and shows no significant difference (p = 0.86). (f) Hmga1a protein structure, including 3 AT-hook DNA binding domains and a C-terminal acidic tail. (g) hmga1a-/- zebrafish were generated using a TALEN-based -8bp deletion behind the start codon (green) causing a frameshift leading to an early stop codon (red). (h, i) Representative images of in situ hybridization against (h) hmga1a or (i) hmga1b in wildtype or hmga1a-/- hearts. n = 3 hearts were analysed per condition. Dashed line indicates the injury border. Scale bars represent 100μm. Source data
Extended Data Fig. 3
Extended Data Fig. 3. scRNA-seq on 7dpi border zone cardiomyocytes from wildtype and hmga1a-/- shows heterogeneous genotype distribution over clusters.
(a-c) UMAP representation of Log2 transformed read counts for the cardiomyocyte gene myl7 (a), border zone gene desma (b) and border zone gene nppa (c). (d) Contribution of Seurat clusters to genotype represented as a percentage of the whole. Total number of cells per group are indicated below pie chart. (e) Contribution of wildtype and hmga1a-/- cells to the individual Seurat clusters. Total number of cells per group are indicated below pie chart.
Extended Data Fig. 4
Extended Data Fig. 4. hmga1a acts downstream of Nrg1/ErbB2 signaling to promote CM proliferation.
(a) Schematic of workflow for results in (B). (b) Quantitative PCR analysis for hmga1a expression in border zone CMs treated with the ErbB2 inhibitor AG1478 or DMSO. Normalization was performed using reference gene eef1g. Datapoints represent technical replicates of pooled hearts (n = 5). Error bars indicate mean ± SD. Statistics were performed using a two-tailed unpaired t-test and show a significant difference (p < 0.0001). (c) Schematic of workflow for panels D and E. (d) Representative image of in situ hybridization against hmga1a in hearts of PBS or NRG1 injected zebrafish. Per condition, n = 6 hearts were analysed. Arrowheads indicate hmga1a expressing cardiomyocytes. Overview scale bars represent 100μm, zoom-in scale bars 20μm. (e) Quantification of proliferating cardiomyocytes based on immunofluorescent staining of Mef2 and PCNA in the ventricle of PBS (-) or NRG1 (+) injected zebrafish hearts, either in hmga1a-/- (n = 8 PBS, n = 8 NRG1) or wildtype sibling (n = 8 PBS, n = 8 NRG1) hearts. Data points represent individual hearts. Error bars indicate mean ± SD. Statistics were performed using a one-way ANOVA followed by Tukey’s multiple comparisons test and show a near significant difference between wildtype NRG1- and NRG1+ (p = 0.056), a significant difference between wildtype NRG1+ and hmga1a-/- NRG1+ (p = 0.02), and no significant difference between hmga1a-/- NRG1- and NRG1+ (p = 0.82). Source data
Extended Data Fig. 5
Extended Data Fig. 5. RNA-seq reveals hmga1a OE induces a BZ-like gene expression program in cardiomyocytes.
(a) Volcano plot showing differential gene expression analysis based on RNA-seq of pooled 14dpT control (CMs from n = 14 hearts) and hmga1a OE (from n = 14 hearts) CMs. Grey bars indicate cut offs at Pval <0.05 and LogFC >1 / LogFC <1. Statistics were obtained using the R package EdgeR, which uses generalized linear models (GLMs) and empirical Bayes methods to identify differentially expressed genes.(b,c) Venn diagrams comparing pooled gene lists of genes in module 1 to 4 of the scRNA-seq from Fig. 2 (upstream of Hmga1a) and genes in module 5 to 8 (downstream of Hmga1a) with genes significantly upregulated (b) or downregulated (c) in hmga1a OE CMs. (d,e) Venn diagrams comparing a list of previously identified border zone genes with genes significantly upregulated (d) or downregulated (e) in hmga1a OE CMs.
Extended Data Fig. 6
Extended Data Fig. 6. Nuclear localization and chromatin binding of Hmga1 in zebrafish and mouse CMs.
(a) Ex vivo time lapse imaging on vibratome sections from a zebrafish ventricle showing a dividing cardiomyocyte nucleus of a 14dpT Tg(ubi:Loxp-stop-Loxp-hmga1a-eGFP, myl7:NucDsRed) zebrafish. Note retention of Hmga1a-eGFP at the chromatin after nuclear envelope breakdown (t = 40). n = 1 heart was imaged. Scale bar represents 5μm.(b) Representative image of immunofluorescent staining against PCM-1, HA, Hmga1 and Dapi, showing a border zone zoom in of a 14dpi mouse heart transduced with AAV9(CMV:HA-Hmga1). n = 4 hearts were analyzed. Arrowheads indicate colocalization of Dapi, HA and Hmga1 within nuclei. Scale bar represents 5μm.
Extended Data Fig. 7
Extended Data Fig. 7. ChICseq on zebrafish cardiomyocytes maps expected coverage of H3K4me3, H3K9me3 and H3K27me3 marks.
(a) Pie charts showing percentages of genomic locations at which peaks are found in the sortChIC data for H3K4me3 marks, H3K9me3 marks and H3K27me3 marks in control and hmga1a OE CMs. H3K4me3 is enriched at promoter regions, while H3K9me3 and H3K27me3 are enriched on intergenic regions and gene bodies respectively. (b) Heatmap showing read distribution the levels of H3K9me3 in control and hmga1a OE CMs. (c) Zebrafish genome tracks showing hox cluster genes hoxb10a, hoxb8a, hoxb3a, hoxa13a, hoxa4a and hoxa3a that have no mRNA reads, no changes in H3K4me3 levels and no changes in H3K27me3 levels upon hmga1a OE.
Extended Data Fig. 8
Extended Data Fig. 8. Hmga1 stimulates cell cycle re-entry in neonatal rat cardiomyocytes and does not induce an aberrant inflammatory response in mouse.
(a) Workflow of Hmga1-eGFP overexpression in neonatal rat cardiomyocytes (NRVMs) used in (b-c). (b,c) Quantification of EdU+ (b) and Ki67+ (c) cardiomyocytes in NRVMs transfected with (EF1a:GFP) (n = 3 biological replicates) or EF1a:Hmga1-eGFP) (n = 3 biological replicates). Datapoints represent individual samples. Error bars indicate mean ± SD. Statistics were performed using a two-tailed unpaired t-test and show a significant difference for % EdU+ CMs (p = 0.038), and for % Ki67+ CMs (p = 0.047). (d) Quantification of % of transduced cells that are PCM1 + , in the BZ and RZ of Control (n = 5) and Hmga1 OE (n = 4) hearts. Datapoints represent individual hearts. Error bars indicate mean ± SD. (e) Quantification of cardiomyocyte transduction efficiency of Control (n = 7) and Hmga1 OE (n = 6) virus in BZ and RZ. Datapoints represent individual hearts. Error bars indicate mean ± SD. (f) Representative images of immunofluorescent staining against GFP/HA-HMGA1, CD45, CD68 and Dapi, showing BZ zoom ins of 14dpi Control and Hmga1 OE hearts. Dashed line indicates border between injury and CMs. Scale bars represent 30μm. (g,h) Quantifications of CD45+ (g) and CD68+ (h) cells per mm2 injury area in 14dpi (n = 3 Control, n = 3 Hmga1 OE) and 42dpi (n = 4 Control, n = 4 Hmga1 OE) control and Hmga1 OE hearts. Statistics were performed using a one-way ANOVA followed by Tukey’s multiple comparisons test and show no significant differences between Control and Hmga1 OE at 14dpi (p = 0.99) or 42dpi (p = 0.99) for CD45, and no significant differences between Control and Hmga1 OE at 14dpi (p = 0.48) or 42dpi (p > 0.99) for CD68. Source data
Extended Data Fig. 9
Extended Data Fig. 9. Hmga1 OE stimulates mammalian heart regeneration.
(a,b) Representative image of immunofluorescent staining against PCM-1, HA and Ki67 (a) or Aurora B (b). Dashed line indicates injury border. Arrowheads indicate HMGA1-HA+ Ki67 + /Aurora B+ CMs. Scale bars represent 100μm in the overview and 20μm in the zoom ins. (c-e) Quantification of EdU+ (c), Ki67+ (d) and Aurora B+ (e) cardiomyocytes within the border zone (BZ) and remote zone (RZ) of Control hearts. n = 5 for EdU, n = 7 for Ki67 and n = 7 for Aurora B quantification. Datapoints represent individual hearts. Error bars indicate mean ± SD. Statistics were performed using a one-way ANOVA followed by Tukey’s multiple comparisons test and show no significant differences except for %Ki67+ CMs comparing GFP + BZ CMs with GFP + RZ CMs (p = 0.038). (f,g) Quantifications of Ki67+ cardiomyocytes in Sham operated Control (n = 8) (f) and Hmga1 OE (n = 6) (g) hearts. Datapoints represent individual hearts. Error bars indicate mean ± SD. Statistics were performed using a two-tailed unpaired t-test and show no significant difference in Control (p = 0.56) or Hmga1 OE (p = 0.09) hearts. (h-k) Quantifications of 42dpi sham (n = 13 Control, n = 13 Hmga1 OE) and MI (n = 13 Control, n = 12 Hmga1 OE) hearts showing fractional shortening (h) (Control sham versus control MI p < 0.0001, Hmga1 OE sham versus Hmga1 OE MI p < 0.0001, control sham versus Hmga1 OE sham p = 0.98, control MI versus Hmga1 OE MI p = 0.03), cardiac output (i) (Control sham versus control MI p = 0.02, Hmga1 OE sham versus Hmga1 OE MI p = 0.99, control sham versus Hmga1 OE sham p = 0.67, control MI versus Hmga1 OE MI p = 0.0004), stroke volume (j) (Control sham versus control MI p = 0.002, Hmga1 OE sham versus Hmga1 OE MI p = 0.89, control sham versus Hmga1 OE sham p = 0.93, control MI versus Hmga1 OE MI p < 0.0001) and heart weight/tibia length (k) (Control sham versus control MI p = 0.001, Hmga1 OE sham versus Hmga1 OE MI p = 0.002, control sham versus Hmga1 OE sham p = 0.91, control MI versus Hmga1 OE MI p = 0.61). Datapoints represent individual hearts. Error bars indicate mean ± SD. Statistics were performed using a one-way ANOVA followed by Tukey’s multiple comparisons test. (l) Representative image of immunofluorescent staining against GFP/HA-HMGA1 and WGA in uninjured mouse ventricles. Scale bars indicate 20μm. (m) Quantification of cell size based on WGA staining in (l), comparing Control (n = 8) versus Hmga1 OE (n = 8) hearts, and untransduced CMs with transduced CMs. Datapoints represent individual hearts. Error bars indicate mean ± SD. Statistics were performed using a one-way ANOVA followed by Tukey’s multiple comparisons test and show no significant differences between any of the conditions. Source data
Extended Data Fig. 10
Extended Data Fig. 10. Hmga1 OE clears H3K27me3 levels in mouse BZ CMs.
(a) Pie charts showing percentages of genomic locations at which peaks are found in the mouse sortChIC data for H3K27me3 marks in control and Hmga1 OE CMs. H3K27me3 is enriched on intergenic regions and gene bodies respectively. (b) Quantification of H3K27me3 levels on orthologs of genes upregulated in hmga1a OE CMs (peak data on n = 1015 genes) and on genes downregulated in hmga1a OE CMs (peak data on n = 923 genes) in zebrafish, comparing normalized read coverage in Control versus Hmga1 OE CMs. H3K27me3 levels are significantly reduced on gene bodies (p < 0.001) of orthologs of genes upregulated in hmga1a OE CMs, but not significantly different between control and hmga1a OE CMs on gene bodies of genes downregulated upon hmga1a OE. Centre line indicates median, whiskers indicate 10-90 percentile. Statistics were performed using two-tailed unpaired t-tests. (c) Mouse genome tracks showing hox cluster genes Hoxb8, Hoxb3, Hoxa1, Hoxa3a and Hoxa13. (d) Proposed model for the role of Hmga1 in regulating cardiomyocyte proliferation and cardiac regeneration. Created in BioRender. Bakkers, J. (2024) https://BioRender.com/v11t224. Source data

References

    1. Patterson, M. et al. Frequency of mononuclear diploid cardiomyocytes underlies natural variation in heart regeneration. Nat. Genet.49, 1346–1353 (2017). - PMC - PubMed
    1. Gonzalez-Rosa, J. M. et al. Myocardial polyploidization creates a barrier to heart regeneration in zebrafish. Dev. Cell44, 433–446 (2018). - PMC - PubMed
    1. Windmueller, R. et al. Direct comparison of mononucleated and binucleated cardiomyocytes reveals molecular mechanisms underlying distinct proliferative competencies. Cell Rep.30, 3105–3116 (2020). - PMC - PubMed
    1. Puente, B. N. et al. The oxygen-rich postnatal environment induces cardiomyocyte cell-cycle arrest through DNA damage response. Cell157, 565–579 (2014). - PMC - PubMed
    1. Honkoop, H. et al. Single-cell analysis uncovers that metabolic reprogramming by ErbB2 signaling is essential for cardiomyocyte proliferation in the regenerating heart. eLife8, e50163 (2019). - PMC - PubMed

Publication types

MeSH terms

LinkOut - more resources