. 2025 Jan 2;15(1):469.
doi: 10.1038/s41598-024-84834-x.

Comprehensive analysis of heat shock protein 110, 90, 70, 60 families and tumor immune microenvironment characterization in clear cell renal cell carcinoma

Affiliations

Comprehensive analysis of heat shock protein 110, 90, 70, 60 families and tumor immune microenvironment characterization in clear cell renal cell carcinoma

Wenjing Liao et al. Sci Rep. .

Abstract

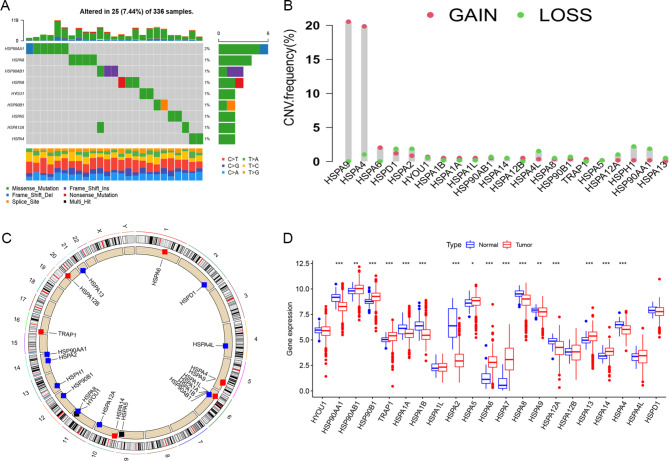
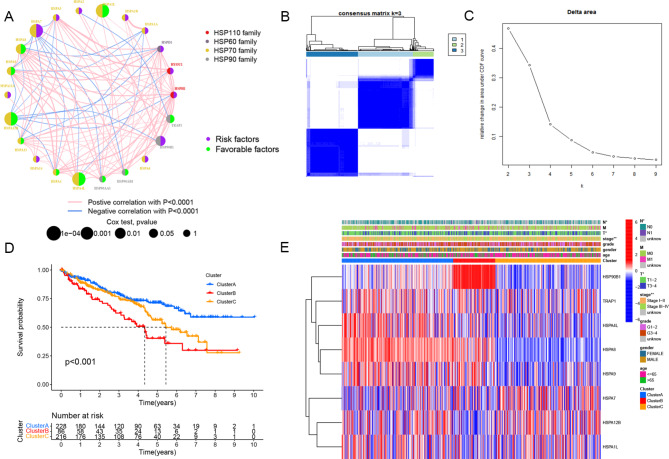
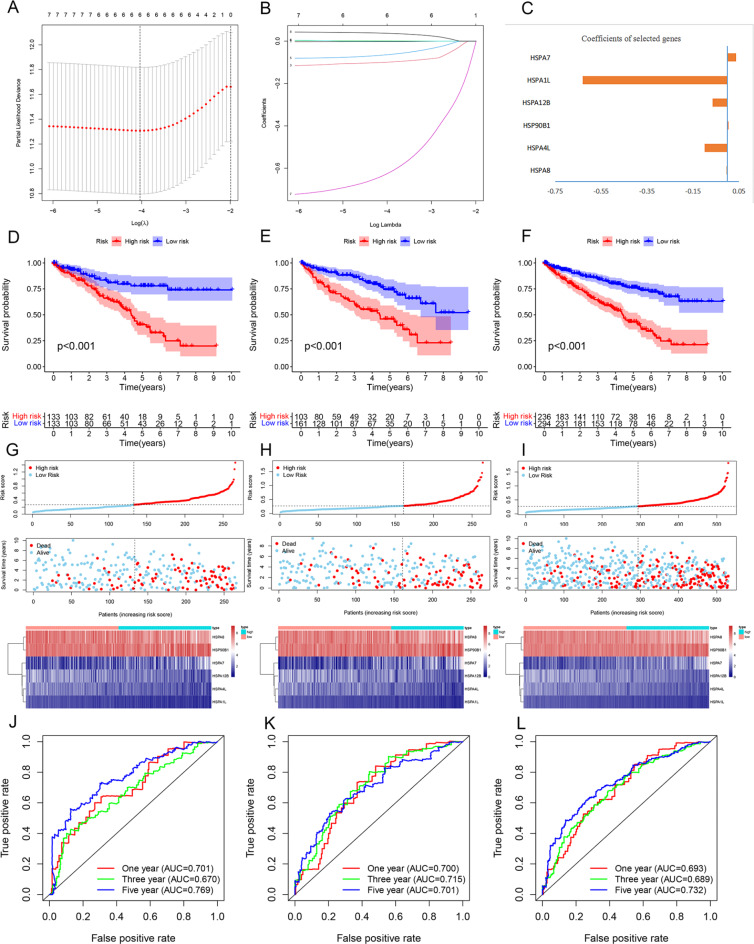
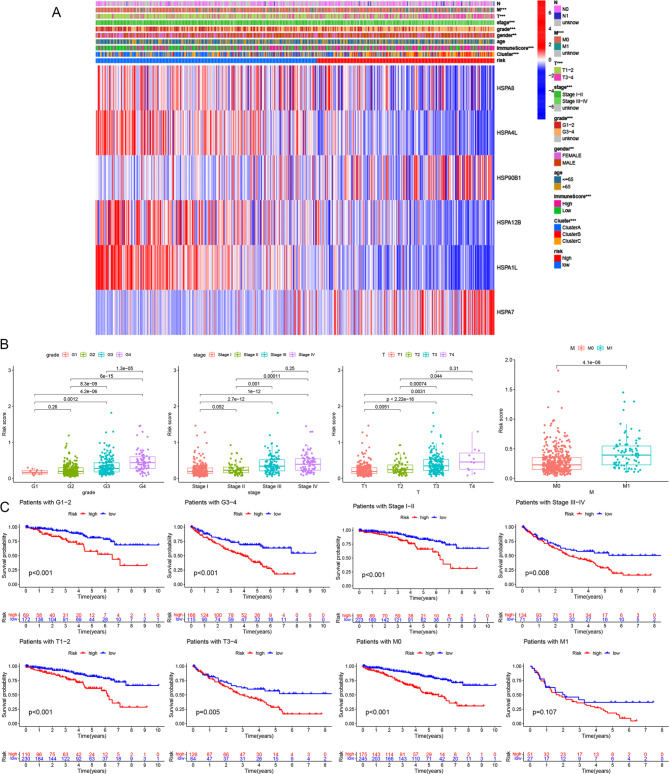
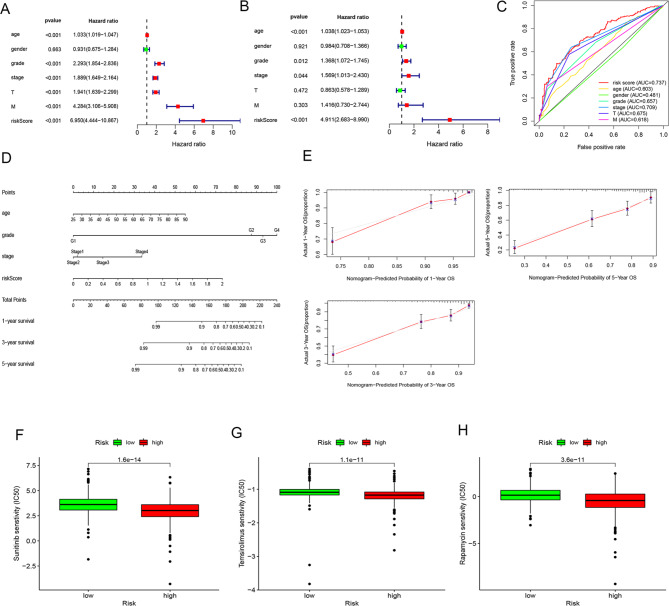
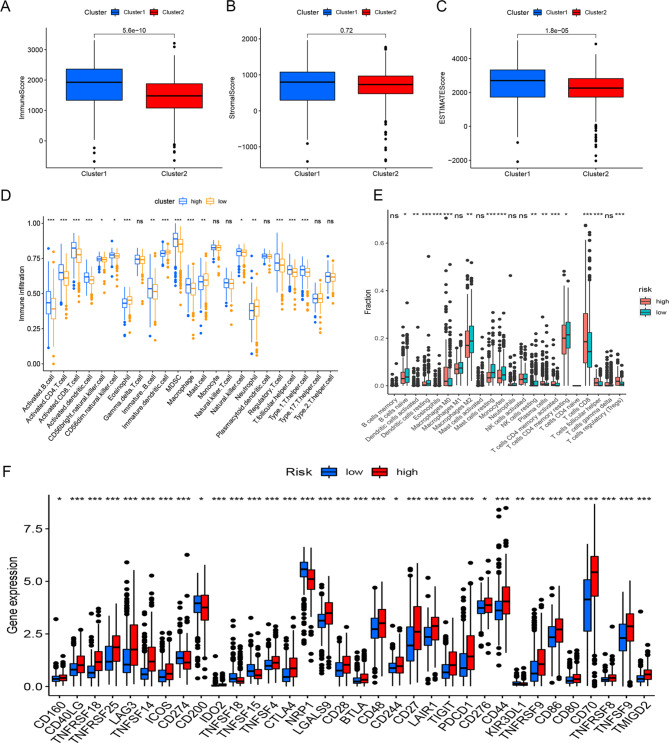
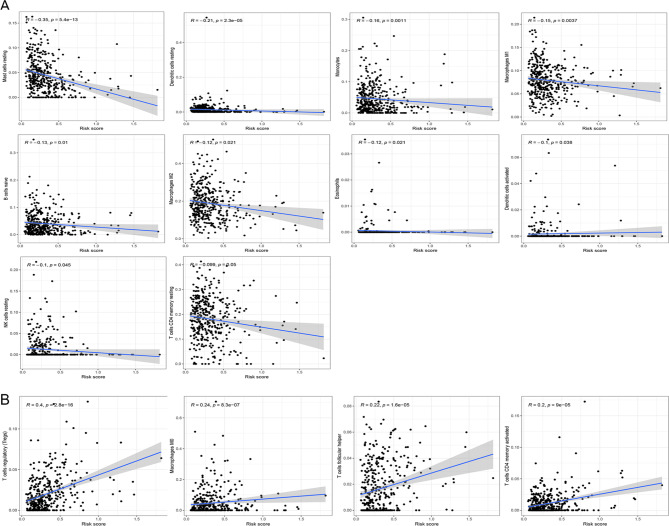
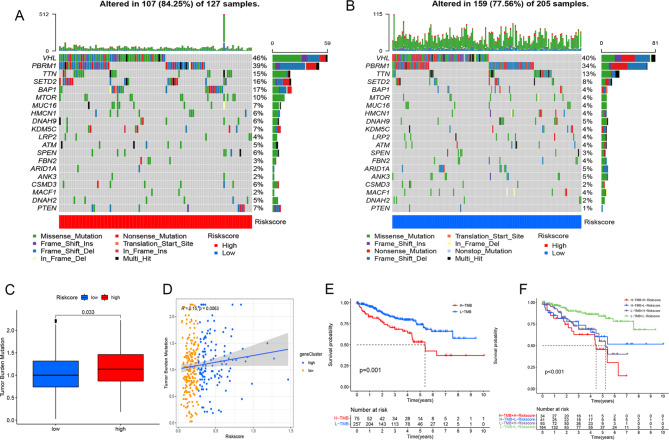
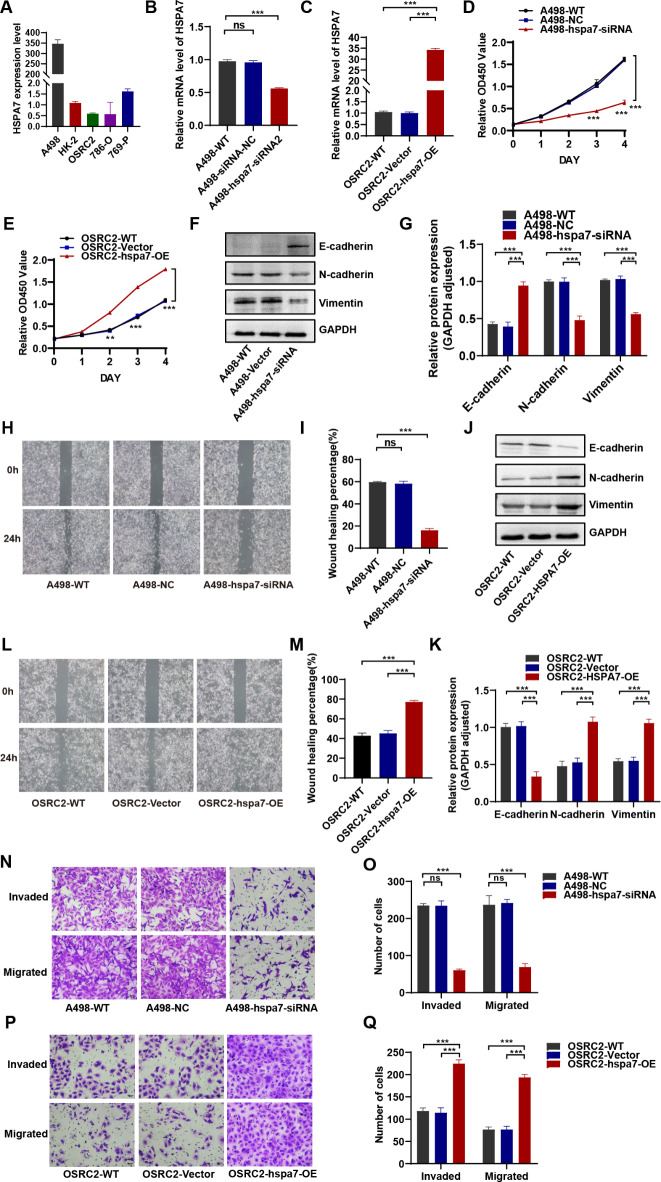
Heat shock proteins (HSPs) are a kind of molecular chaperone that helps protein folding, which is closely related to cancer. However, the association between HSPs and clear cell renal clear cell carcinoma (ccRCC) is uncertain. We explored the prognostic value of HSP110, HSP90, HSP70 and HSP60 families in ccRCC and their role in tumor immune microenvironment. The data obtained from the Cancer Genome Atlas (TCGA) were applied to determine the differential expression of HSPs in normal tissues and ccRCC. We comprehensively analyzed the prognostic value of HSPs in ccRCC and constructed a prognostic signature. We further explored the differences of tumor immune microenvironment and targeted therapy based on the signature. Cell proliferation, invasion and metastasis were detected by CCK8 assay, wound healing and transwell. Three clusters were identified with differences in overall survival and tumor stage. 6-gene signature (HSPA8, HSP90B1, HSPA7, HSPA12B, HSPA4L, HSPA1L) was identified to predict ccRCC patients' prognosis. The signature was confirmed in the internal cohort. Survival analysis, receiver operating characteristic (ROC) curve, univariate and multivariate COX regression analysis demonstrated the accuracy and independence of signature. The expression of HSPA7, HSPA8 and HSP90B1 were validated with quantitative real-time PCR. Our signature played a pivotal role in predicting tumor immune microenvironment, immune checkpoint gene expression, drug sensitivity, and tumor mutational burden (TMB) in patients with ccRCC. Our cellular experiments confirmed HSPA7 promotes the proliferation, invasion and metastasis of ccCRC cells. The HSPs signature identified in this study could serve as potential biomarkers for predicting prognosis and treatment response in ccRCC patients. It may provide new ideas for the current research on targeted therapy and immunotherapy strategies for ccRCC patients.

Keywords: Clear cell renal cell carcinoma; Drug sensitivity; Heat shock protein; Immune checkpoints; Prognostic signature; Tumor immune microenvironment.


Conflict of interest statement

Declarations. Competing interests: The authors declare no competing interests.

Figures

Fig. 1
Fig. 1
The characteristics, correlations and differences of heat shock proteins (HSPs) in clear cell renal cell carcinoma (ccRCC). (A) The mutation frequency of 22 HSP genes in 336 ccRCC patients from TCGA-STAD cohort. The right number indicated the mutation frequency in these genes. The annotations below the waterfall chart indicate different mutation types represented by different colors (B) The CNV variation frequency of gain and lost for HSP genes in TCGA cohort. The height of the column represented the alteration frequency. (C) The location of CNV alteration of HSP genes on 23 chromosomes using TCGA cohort. (D) The expressions of HSP genes between normal tissues (blue) and ccRCC tissues (red). The asterisks represented the statistical p value (*: P < 0.05; **: P < 0.01; ***: P < 0.001).
Fig. 2
Fig. 2
Biological characteristics and consensus clustering analysis of HSPs in ccRCC. (A) Interaction between HSPs in ccrcc. The circle size represents the impact of each HSP on the prognosis. By Cox regression test, the value ranges are P < 0.0001, P < 0.001, P < 0.01, P < 0.05 and P < 0.1 respectively. Right semicircle green, prognostic protective factors; Right semicircular purple, prognostic risk factors. The left semicircle indicates different HSP families with red, black, yellow and gray, respectively. The line connecting HSPs represents the interaction between them, and the thickness represents the correlation strength between HSPs. It is positively correlated with pink and negatively correlated with blue. (B) Consensus clustering matrix for k = 3. (C) CDF curves for k = 2–9. (D) Kaplan-Meier curves of overall survival (OS) for ccRCC in three clusters. (E) Heatmap and the clinicopathologic characters of the three clusters classified by these differentially expressed genes.
Fig. 3
Fig. 3
Construction of risk signature in the TCGA cohort. (A, B) Least absolute shrinkage and selection operator (LASSO) Cox regression identified a risk prognosis model. (C) Coefficients of 6 HSP genes. (D-F) In the train cohort (D), test cohort (E) and entire cohort (F), Kaplan-Meier curves suggested that the high-risk subgroup had worse overall survival (OS) than the low-risk subgroup. (G-I) The risk scores distribution, ccRCC patients’ survival status and expression heatmap in the train cohort (G), test cohort (H) and entire cohort (I). (J-L) The train cohort (J) and test cohort (K): 1-, 3- and 5-year ROC curves of risk signature.
Fig. 4
Fig. 4
Clinical evaluation of the prognosis risk signature. (A) Heatmap of the expression of 6 genes and distribution of clinical characters between the high-risk and low-risk groups. (B) Correlation between risk signature and clinicopathological. (C) Kaplan Meier survival analysis stratified by clinicopathological features based on risk signature.
Fig. 5
Fig. 5
The risk model is an independent prognostic factor. (A, B) Univariate (A) and multivariate (B) Cox regression analyses were used to verify the independent prognostic value of the signature. (C) ROC curve analysis showed the prognostic accuracy of risk signature and other clinical features. (D) Nomogram was plotted for the prediction of overall survival time. (E) Calibration curves were drawn to determine the accuracy of nomogram for OS at 1-, 3-, and 5-years. (F-H) Comparison of drug sensitivity between high-risk and low risk groups. Sunitinib (F); Temsirolimus (G); and Rapamycin (H).
Fig. 6
Fig. 6
Characterization of the tumor immune microenvironment in high-risk and low-risk groups. (A-C) Comparison of immune score (A), stromal score (B) and ESTIMATE score (C) between the two groups. Cluster 1 represents the high-risk group and cluster 2 represents the low-risk group. (D) The infiltration abundance of immune cell subsets was evaluated by ssGSEA. (E) The differences of tumor infiltrating immune cells between the two groups were compared by CIBERPORT. (F) The difference of immune checkpoint genes expression between high-risk and low risk groups.
Fig. 7
Fig. 7
Correlation analysis between risk score and tumor infiltrating immune cells. (A) Positively correlated with risk score. (B) Negative correlation with risk score.
Fig. 8
Fig. 8
Association of risk signatures with tumor mutational burden (TMB). (A, B) The top 20 mutated genes in the high-risk group (A) and low-risk group (B). (C) The differences of TMB in high-risk and low-risk groups. (D) Risk score is positively correlated with TMB. (E) Survival analysis of patients in the high TMB group and low TMB group. (F) Survival analysis of patients in the screening cohort stratified by both TMB and risk score.
Fig. 9
Fig. 9
HSPA7 promotes the proliferation, invasion and metastasis of A498 and ORSC2 cells, A498 cells were transfected with HSPA7-specific siRNA(A498-hspa7-siRNA), a control siRNA (A498-siRNA-NC) or PBS(A498-WT); ORCS2 cells were transfected with a HSPA7-specific vector (ORSC2-hspa7-OE), a control vector(ORSC2- vector) or PBS(ORCS2-WT). (A) Expression of HSPA7 in ccRCC cells detected by Western blot. (B) HSPA7 expression in ORSC2 cells with different treatments. (C) HSPA7 expression in A498 were cells with different treatments. (D-E) ORSC2 and A498 cells viability was assessed using CCK8 assay; (F-G) Expression of E-cadherin, Vimentin and N‐cadherin in A498 cells were evaluated by Western blot; (H-I) Scratch healing assay of A498 were cells with different treatments. (J-K) Expression of E‐cadherin, Vimentin and N‐cadherin in ORCS2 cells were evaluated by Western blot. (L-M) Scratch healing assay of evaluated in the A498 cells. (N-O) Transwell migration and invasion were evaluated in the A498 cells (P-Q) Transwell migration and invasion were evaluated in the ORCS2 cells. Each experiment was conducted in triplicate. An asterisk (*) represents significant difference with P < 0.05; (**) represents P < 0.01; (***) represents P < 0.001. Error bars are indicative of means ± SD. n.s., not significant.

Similar articles

References

    1. Rossi, S. H. et al. Epidemiology and screening for renal cancer. World J. Urol.36 (9), 1341–1353. 10.1007/s00345-018-2286-7 (2018). - PMC - PubMed
    1. Hsieh, J. J. et al. Genomic classifications of renal cell carcinoma: A critical step towards the future application of personalized kidney cancer care with pan-omics precision. J. Pathol.244 (5), 525–537. 10.1002/path.5022 (2018). - PubMed
    1. Wallis, C. J. D. et al. First-line systemic therapy for metastatic renal cell carcinoma: A systematic review and network meta-analysis. Eur. Urol.74 (3), 309–321. 10.1016/j.eururo.2018.03.036 (2018). - PubMed
    1. Rini, B. I., Campbell, S. C. & Escudier, B. Ren. cell. Carcinoma Lancet, 373(9669): 1119–1132. DOI: 10.1016/s0140-6736(09)60229-4. (2009). - PubMed
    1. Signoretti, S. et al. Renal cell carcinoma in the era of Precision Medicine: from Molecular Pathology to tissue-based biomarkers. J. Clin. Oncol.36 (36). 10.1200/jco.2018.79.2259 (2018). Jco2018792259. - PMC - PubMed

MeSH terms