. 2025 Apr;32(4):756-766.
doi: 10.1038/s41594-024-01418-z. Epub 2025 Jan 2.

KIF1C activates and extends dynein movement through the FHF cargo adapter

Affiliations

KIF1C activates and extends dynein movement through the FHF cargo adapter

Ferdos Abid Ali et al. Nat Struct Mol Biol. 2025 Apr.

Abstract

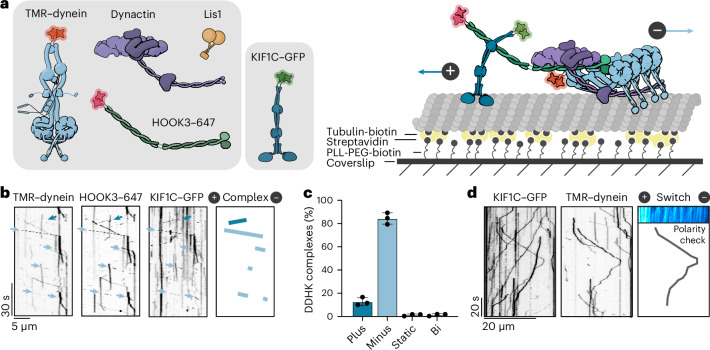
Cellular cargos move bidirectionally on microtubules by recruiting opposite polarity motors dynein and kinesin. These motors show codependence, where one requires the activity of the other, although the mechanism is unknown. Here we show that kinesin-3 KIF1C acts as both an activator and a processivity factor for dynein, using in vitro reconstitutions of human proteins. Activation requires only a fragment of the KIF1C nonmotor stalk binding the cargo adapter HOOK3. The interaction site is separate from the constitutive factors FTS and FHIP, which link HOOK3 to small G-proteins on cargos. We provide a structural model for the autoinhibited FTS-HOOK3-FHIP1B (an FHF complex) and explain how KIF1C relieves it. Collectively, we explain codependency by revealing how mutual activation of dynein and kinesin occurs through their shared adapter. Many adapters bind both dynein and kinesins, suggesting this mechanism could be generalized to other bidirectional complexes.


Conflict of interest statement

Competing interests: The authors declare no competing interests.

Figures

Fig. 1
Fig. 1. Dynein and KIF1C form coordinated cocomplexes scaffolded by HOOK3.
a, Left: the schematics of proteins used in reconstitution of cocomplexes. Dynein and HOOK3 are labeled via N-terminal SNAP tags with TMR and Alexa-647, respectively. KIF1C is fused to a C-terminal eGFP. Right: representation of single-molecule motility assay used in this study. The microtubules are immobilized by sandwiching streptavidin between tubulin-biotin and PLL-PEG-biotin on the glass coverslip. The labeled motor proteins and adapters are then added and their motility imaged. b, Kymographs from TIRF images showing colocalized movement of dynein, HOOK3 and KIF1C. Right: minus end runs of DDHK complexes in light blue and plus end runs in dark blue. c, Quantification of DDHK complex directionality, with those undertaking directional reversals indicated as bidirectional (Bi). A total of n = 1,418 motor complexes were used across three separate experiments (n = 190 plus directed, n = 1,182 minus directed, n = 22 static and n = 24 bidirectional). The data are presented as mean values ± s.d. d, An example of a directional switch of a DDHK complex during a run. Inset: polarity check with KIF1C–GFP only, which was performed after every experiment containing both KIF1C and dynein to establish microtubule polarity. Source data
Fig. 2
Fig. 2. Dynein and KIF1C are codependent in vitro.
a, Schematics (top) and representative kymographs (bottom) from TIRF imaging of TMR-labeled DDH; DDHKFL; or dynein, dynactin, HOOK3 and GST–KIF1C stalk–GFP (DDHKS). All experiments were performed in the presence of Lis1. b, A superplot of the TMR–dynein landing rate on microtubules for different cocomplex combinations (as in a). The small dots indicate single microtubules and the large dots indicate experimental averages. n = 165 for DDH, n = 150 for DDHK and n = 171 for DDHKS, where n is number of microtubules over which the landing rate was measured. The boxes show quartiles with whiskers spanning 10–90% of the data, and the median is highlighted by the orange line. The exact P values shown above the graphs were calculated using the Kruskal–Wallis H test followed by a Conover’s post hoc test to evaluate pairwise interactions with a multiple comparison correction applied using Holm–Bonferroni. c, Schematics (top) and representative kymographs (bottom) from TIRF imaging of KIF1C–GFP mixed with HOOK3 (HKFL), dynactin, HOOK3 and full-length dynein (DDHKFL), dynein tail, dynactin, HOOK3 and KIF1C–GFP (DTDHKFL) or dynactin, HOOK3 and KIF1C–GFP (xDHKFL). d, A superplot of the KIF1C–GFP landing rate on microtubules for different cocomplex combinations (as in c). The small dots indicate single microtubules, and the large dots indicate experimental averages. n = 94 for HKFL, n = 97 for DDHKFL, n = 113 for DTDHKFL and n = 138 for xDHKFL, where n is number of microtubules over which landing rate was measured. The boxes show the quartiles with whiskers spanning 10–90% of the data, and the median is highlighted by the orange line. The exact P values shown above graphs using the Kruskal–Wallis H test followed by a Conover’s post hoc test to evaluate pairwise interactions with a multiple comparison correction applied using Holm–Bonferroni. Source data
Fig. 3
Fig. 3. HOOK anchors FHIP and FTS in FHF complexes.
a, The domain architecture of FHIP1B, HOOK3 and FTS. A putative Rab5 binding site is indicated in FHIP1B. The scissor cut at residue 571 in HOOK3 indicates the truncation site used for FHF cryo-EM construct. b, An atomic model of FHF complex built from 3.2 Å cryo-EM structure, highlighting the four main interaction sites and the flexible regions within HOOK3. c, Cryo-EM density of FHF with the AlphaFold2-predicted Rab5 binding site highlighted on FHIP1B (see Extended Data Fig. 4 for details). d, Sequence conservation between human HOOK1, HOOK2 and HOOK3. The residue numbers refer to HOOK3. e, The combinations of FHF coexpressed and purified to assess complex formation. FTS–HOOK3–FHIP1B (complex 1) and FTS–HOOK2–FHIP2A (complex 2) were classed as favored assemblies and FTS–HOOK3-FHIP2A (complex 3) and FTS–HOOK2–FHIP1B (complex 4) as disfavored assemblies based on ref. . f, SDS–PAGE of purified FHF (complexes 1–4) show that HOOK2 or HOOK3 promiscuously bind FHIP2A or FHIP1B in vitro. This purification was performed once as shown in f with the full-length HOOK proteins bound to FTS–FHIP1B or FTS–FHIP2A and once with C-terminal fragments of HOOK2 (residues 566–719) and HOOK3 (571–718) bound to FTS–FHIP1B/FHIP2A, for which cryo-EM data were collected in g, revealing the same HOOK–FHIP pattern of binding both times. g, Cryo-EM 2D class averages of favored (2) and disfavored (3 and 4) complexes (using HOOK2566–719 and HOOK3571–718 fragments coexpressed with FTS–FHIP1B or FTS–FHIP2A), showing recognizable views in all cases and indicating stable FTS–HOOK–FHIP assembly in all combinations tested. Source data.
Fig. 4
Fig. 4. FHF is an autoinhibited cargo adapter.
a, Representative kymographs of TMR–dynein and dynactin in presence of either HOOK31–522 (left), full-length FHF (middle left), no other factor (DD, middle right) or full-length FHF + KIF1C stalk (right). All the samples also included Lis1. b,c, Quantification of processive events (b) and run lengths (c) from eight technical replicates (apart from DD condition, which had four technical replicates). The bars indicate the mean ± s.d., the small dots indicate data for each microtubule and the large dots indicate experimental averages. Statistics were performed on total microtubules, which is n = 120 microtubules for all conditions apart from the DD condition, where n = 60. A total of 15 microtubules were counted per replicate for all conditions. The exact P values shown above the graphs were calculated using the Kruskal–Wallis nonparametric test with Dunn’s multiple comparison. d, Full-length FHF composite model derived from stitched AF predictions and the cryo-EM structure of HOOK3 624–718, FTS and FHIP1B showing DSSO crosslinks (yellow dashes) between HOOK3 N-terminal residues (salmon orange) and HOOK3 C-terminal residues (red) identified using crosslinking mass spectrometry (XL-MS). Source data.
Fig. 5
Fig. 5. KIF1C stalk binds HOOK3 away from the FTS–FHIP1B site and relieves adapter autoinhibition.
a, A stitched structural model of the AF-predicted KFL molecule. NL, neck linker; NC, neck coil; NCL, neck coil linker; FHA, forkhead-associated domain; P-Rich, proline-rich region. b, Domain architecture of KIF1C with the KIF1C stalk region highlighted below the main bar. c, The segmented cryo-EM density of FHF bound to a shorter KIF1C stalk (674–922, the dashed blue region), shown at a low-threshold contour level. d, AF model of HOOK3 residues 571–718 bound to KIF1C residues 722–840 (KS722–840). Note that FTS, FHIP1B and HOOK3 (627–705) models from the cryo-EM structure are superposed on the HOOK3571–718–KS722–840 prediction to give a composite structure. e, Expansion of AF model in d showing one copy of HOOK3 at the CC3–CC4 junction bound to one copy of KS722–840. The yellow dashes indicate crosslinks observed by XL-MS between the two proteins using DSSO crosslinker. f, A representation of a putative steric clash that would occur upon the SGD of KIF1C stalk latching onto the HOOK3 C terminus. HN, HOOK3 N terminus 1–450; KS, GST–KIF1C stalk (residues 642–922) and KSSGD, GST–SGD (residues 722–840). g, Input and bead samples from the pulldown experiment where strep-FHCF was used as bait. The key for the sample number above the gel is given in h. The experiment was repeated twice. h, Schematics of the included proteins and the presumed complexes formed. The yellow square shape in FHCF cartoons represents the strep tag, and the circle shape represents the bead. Source data.
Fig. 6
Fig. 6. Motility behavior of dynein and kinesin-driven cocomplexes.
a, Cartoons depicting the proteins used in each plus end-directed cocomplex. bd, Superplots showing plus end-directed speed (b), run lengths (c) and dwell time (d) of KIF1C–HOOK3 complexes (HKFL) in the presence of dynein and dynactin (DDHKFL), dynein tail and dynactin (DTDHKFL) and dynactin only (xDHKFL). n = 94, 95, 113 and 137, respectively. The small dots show data per microtubule analyzed (n) and the large dots show experimental averages. The boxes show quartiles, whiskers show 10–90% of data and the median is highlighted by the orange line. The exact P values shown above graphs using Kruskal–Wallis H test followed by a Conover’s post hoc test to evaluate pairwise interactions with a multiple comparison correction applied using Holm–Bonferroni. e, Cartoons depicting the proteins used in each minus end-directed cocomplex. fh, Superplots showing minus end-directed speed (f), run lengths (g) and dwell time (h) of DDH complexes in the presence of either KIF1C full-length (DDHKFL) or KIF1C stalk (GST–KIF1C stalk–GFP, DDHKS). n = 165, 197 and 199, respectively. The small dots show data per microtubule analyzed (n) and large dots show experimental averages. The boxes show the quartiles, the whiskers show 10–90% of data and the median is highlighted by the orange line. The exact P values shown above the graphs were calculated using the Kruskal–Wallis H test followed by a Conover’s post hoc test to evaluate pairwise interactions with a multiple comparison correction applied using Holm–Bonferroni. Source data.
Fig. 7
Fig. 7. Proposed model for activation of dynein by KIF1C.
a, FHF assembles on Rab5 marked early endosomes. The FHF complex is inherently autoinhibited through HOOK3 intramolecular interactions. b, KIF1C, which is autoinhibited, binds (through its stalk domain) to the HOOK3 C terminus and relieves the HOOK3 fold-back conformation. This enables dynein–dynactin access to the HOOK3 N terminus and minus end motility. During these runs, KIF1C only partially engages the microtubules, acting as a processivity factor for dynein. c, Dynein–dynactin, at sufficiently high local concentration, binds HOOK3 at its N terminus, exposing the C terminus for KIF1C binding and activation. Dynein weakly engages microtubules and slows down plus end transport.
Extended Data Fig. 1
Extended Data Fig. 1. Controls for single molecule experiments.
Representative kymographs from single molecule motility assays of Dynein-Dynactin-HOOK3-KIF1C (DDHK) complexes showing a, the full DDHK complex, and omission of individual components with b, TMR-dynein omitted (xDHK) and c, dynactin (DxHK) and d, HOOK3-Alexa 647 (DDxK) and e, KIF1C-GFP (DDHx). The omitted factor is shown in grey in the cartoons and crossed out in the component list. Microtubule polarity is indicated with (+) and (–) signs. Note that motility of KIF1C and Dynein both towards the plus and minus end of microtubules is only observed in the complete DDHK complex.
Extended Data Fig. 2
Extended Data Fig. 2. Biochemical analysis of FHF complex formation and cryo-EM processing workflow.
a, SDS-PAGE of the full-length (left) FHF complex and corresponding SEC-MALS chromatogram (below gel), revealing an expected molecular weight of ~304 kDa. On the right is one of the truncated FHF constructs used for cryo-EM structure determination (containing HOOK3 residues 571-718). Purification repeated three times for each. b, Cryo-EM processing workflow for three combined FHF datasets. All steps were performed in RELION-4.1 apart from particle picking, which was performed in CrYOLO. Note that dataset 3 contained a construct of KIF1C stalk (GST-KIF1C stalk 674-922) but this did not alter the overall conformation of FHF as confirmed by comparison to FHF only datasets. Resolution values refer to post-sharpened and masked maps using the PostProcessing step of RELION. Asterisks are indicated after some resolution values to show that the number is a guide only due to map anisotropy leading to an overinflated estimate. c, SEC chromatogram of isolated 16 µM FTS, isolated 8 µM FHIP1B and 16 µM FTS + 8 µM FHIP1B added together. SDS-PAGE gel shows bands relevant to the combined FTS + FHIP1B run. Asterisk indicates unidentified contaminant. Experiment performed once. Source data
Extended Data Fig. 3
Extended Data Fig. 3. Validation and structural detail of FHF cryo-EM structure.
a, Integrated and motion corrected micrograph of FHF complexes from movie collected using a K3 camera in counting mode (1.09 Å/pixel). Data collection repeated three times with either isolated FHF (two datasets) or bound to KIF1C stalk (one dataset, where KIF1C stalk did not alter the FHF density). b, Segmented cryo-EM density of FHF complex shown in front and side views. c, RELION local-resolution plot applied to a clipped front view of the FHF complex. d, Example cryo-EM density (shown in mesh) from FHIP1B alpha helix (297-315) and corresponding built model. e, Gold standard Fourier shell correlation (FSC) curves as determined by RELION-4.1 (FSC = 0.143). f, 2D representation of angular distribution extracted from particles.star of the final structure. g-i, Topology and secondary structure of g, HOOK3 h, FTS and i, FHIP1B. Interacting regions with other FHF components labelled and highlighted in transparent colour.
Extended Data Fig. 4
Extended Data Fig. 4. Conservation of FHIP1B and putative binding to Rab5.
a, ConSurf evolutionary conservation profile of FHIP1B. Model of FHIP1B coloured according to level of conservation (key below) and the view of the structure is the same as that in (b). b, AlphaFold2 prediction of FH571-718F+Rab5Q79L. Predicted structure was superimposed on experimental cryo-EM FHF structure and used to show the interaction with Rab5 in three different views (top row middle and right panels, and bottom row, middle panel). Boxed inset shows predicted domain boundaries of Rab5 based on. c, AlphaFold2 Predicted Aligned Error (PAE) plot of FH571-718F+Rab5Q79L.
Extended Data Fig. 5
Extended Data Fig. 5. Crosslinking mass spectrometry and structural modelling of the auto-inhibited state of FHF.
a, Intramolecular crosslinks, using EDC (top) and DSSO (bottom), mapped on the full-length HOOK3 domain architecture. b, AlphaFold2 Predicted Aligned Error (PAE) plots and corresponding structural prediction of three partially overlapping HOOK3 fragments (lengths of fragments indicated in the figure). Fragments were aligned at overlapping regions using the MatchMaker tool in UCSF Chimera; regions of overlap were deleted at the regions indicated by the red spheres shown on the right. c, The stitched full-length model of FHF (shown in surface rendering) predicts a steric clash upon binding to the dynein-dynactin complex (shown in cartoon rendering). In particular, the C-terminus of HOOK3, FTS and FHIP1B within auto-inhibited FHF (shown in red) is incompatible with stable binding to the dynein tails.
Extended Data Fig. 6
Extended Data Fig. 6. Structural modelling of full-length KIF1C and cryo-EM processing workflow for FH451-718F bound to KIF1C stalk (674-922).
a, AlphaFold2 Predicted Aligned Error (PAE) plots of KIF1C segments used to create the stitched model of the full-length molecule. Asterisk in 1–350 prediction refers to use of the monomer motor for superposition onto the 220–420 dimer structure. Asterisk in 820–1103 prediction highlights the high level of disorder predicted for the Proline-rich region (this segment is used for completion of structure only rather than analysis). Sequences in brackets are the residues left after removal of overlapping superposed regions within the stitched molecule. b, Cryo-EM processing workflow for two combined FHF-KIF1C stalk datasets. RELION-4.1 was used throughout, apart from particle picking which was performed in crYOLO.
Extended Data Fig. 7
Extended Data Fig. 7. Biochemical characterisation of the FHF and KIF1C stalk interaction.
a, Size Exclusion Chromatography (SEC) of isolated full-length FHF and FHF + KIF1C stalk (residues 642-922). Experiment repeated three times. b, Mass photometry of full-length FHF and KIF1C stalk using the Refeyn machine. Cartoon on the right depicts the KIF1C stalk construct used for a-b. Experiment performed once. c, SEC reconstitution of FH451-718F in the absence or presence of two shorter KIF1C stalk constructs (residues 674-922 and 674-822, respectively) depicted in the cartoons on the right. Experiment repeated twice. d, SEC reconstitution of full-length FHF in the presence and absence of the KIF1C stalk SGD domain. Two SGD deletion constructs within KIF1C stalk were tested (∆722-840 and ∆742-840) against SGD construct (residues 722-841), as depicted in the cartoons on the right. Experiment performed once. e, SEC reconstitution of truncated FH629-718F with SGD construct shows no binding. Experiment performed once. SDS-PAGE gels for all runs show fractions from the peak regions. Source data
Extended Data Fig. 8
Extended Data Fig. 8. FHF-KIF1C cryo-EM, AlphaFold2 and cross-linking mass spectrometry validation and analysis.
a, RELION local-resolution plot applied to FH451-718F bound to KIF1CS674-922 (also referred to as KIF1CS2) cryo-EM structure, shown at two different density thresholds. b, Gold standard Fourier shell correlation (FSC) curves as determined by RELION-4.1 (FSC = 0.143). c, 3D depiction of angular distribution for the final FH451-718F-KIF1CS674-922 structure with the cryo-EM density shown in the middle. d, AlphaFold2 Predicted Aligned Error (PAE) plot for the HOOK3571-718-KIF1C stalk SGD722-840 prediction. e, Crosslinking mass spectrometry results for full-length FHF or FH571-718F bound to KIF1C stalk (containing residues 674-922, denoted KIF1CS2), either using the EDC or DSSO crosslinkers.
Extended Data Fig. 9
Extended Data Fig. 9. Subclassification of motor complex motility and pausing events.
a, Example kymograph and annotation showing what would be classified as plus and minus end directed motility and paused (moving < 25 nm/s). The example shows the TMR-dynein channel of a DDHK chamber. The scale bar is 20 μm and 20 s in the horizontal and vertical axes, respectively. b-d, Superplots of HKFL, DDH and DDHKFL time spent moving towards the plus end (b), time spent moving towards the minus end (c) and time spent pausing at a speed < 25 nm/s (d). Note that wholly static tracks (total distance <1000 nm) are excluded from this analysis. Small dots show data per microtubule and large dots show experimental averages. Boxes show quartiles with whiskers spanning 10%-90% of the data. n=94, 165 and 202 for HKFL, DDH and DDHKFL, respectively. Exact p values shown above graphs using Kruskal Wallis H test used followed by a Conover’s posthoc test to evaluate pairwise interactions with a multiple comparison correction applied using Holm–Bonferroni Source data. Source data

References

    1. Ashkin, A., Schütze, K., Dziedzic, J. M., Euteneuer, U. & Schliwa, M. Force generation of organelle transport measured in vivo by an infrared laser trap. Nature348, 346–348 (1990). - PubMed
    1. Hancock, W. O. Bidirectional cargo transport: moving beyond tug of war. Nat. Rev. Mol. Cell Biol.15, 615–628 (2014). - PMC - PubMed
    1. Jongsma, M. L. M., Bakker, N. & Neefjes, J. Choreographing the motor-driven endosomal dance. J. Cell Sci.136, jcs259689 (2023). - PMC - PubMed
    1. Ally, S., Larson, A. G., Barlan, K., Rice, S. E. & Gelfand, V. I. Opposite-polarity motors activate one another to trigger cargo transport in live cells. J. Cell Biol.187, 1071–1082 (2009). - PMC - PubMed
    1. Brady, S. T., Pfister, K. K. & Bloom, G. S. A monoclonal antibody against kinesin inhibits both anterograde and retrograde fast axonal transport in squid axoplasm. Proc. Natl Acad. Sci. USA87, 1061–1065 (1990). - PMC - PubMed

MeSH terms

LinkOut - more resources