. 2025 Jan 2;15(1):159.
doi: 10.1038/s41598-024-83921-3.

The multi-target mechanism of action of Selaginella doederleinii Hieron in the treatment of nasopharyngeal carcinoma: a network pharmacology and multi-omics analysis

Affiliations

The multi-target mechanism of action of Selaginella doederleinii Hieron in the treatment of nasopharyngeal carcinoma: a network pharmacology and multi-omics analysis

Huaguo Liang et al. Sci Rep. .

Abstract

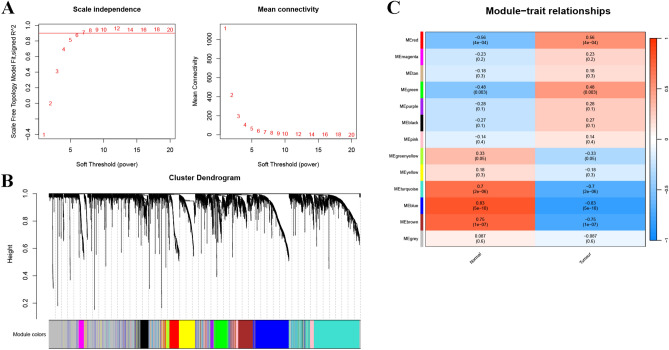
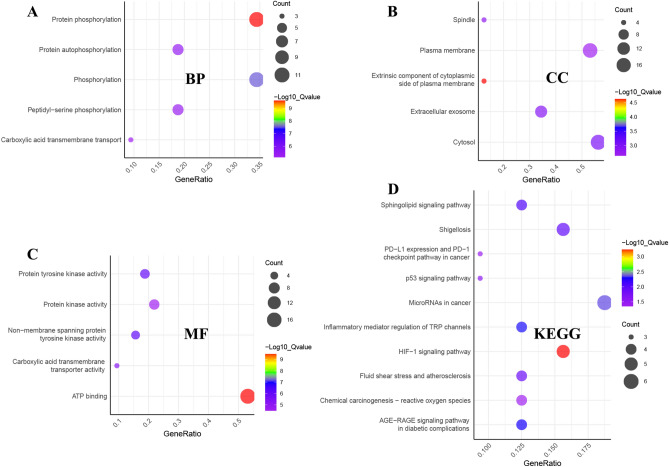
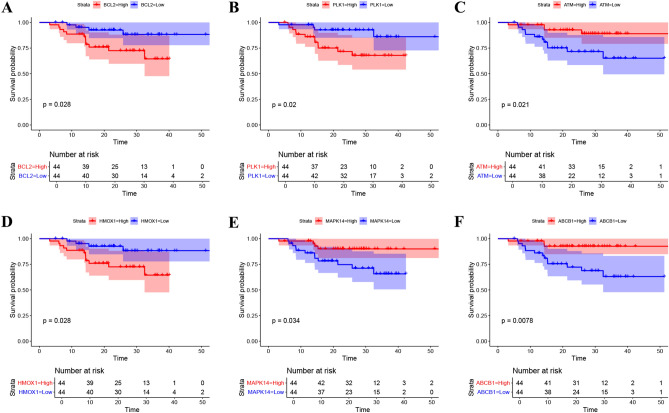
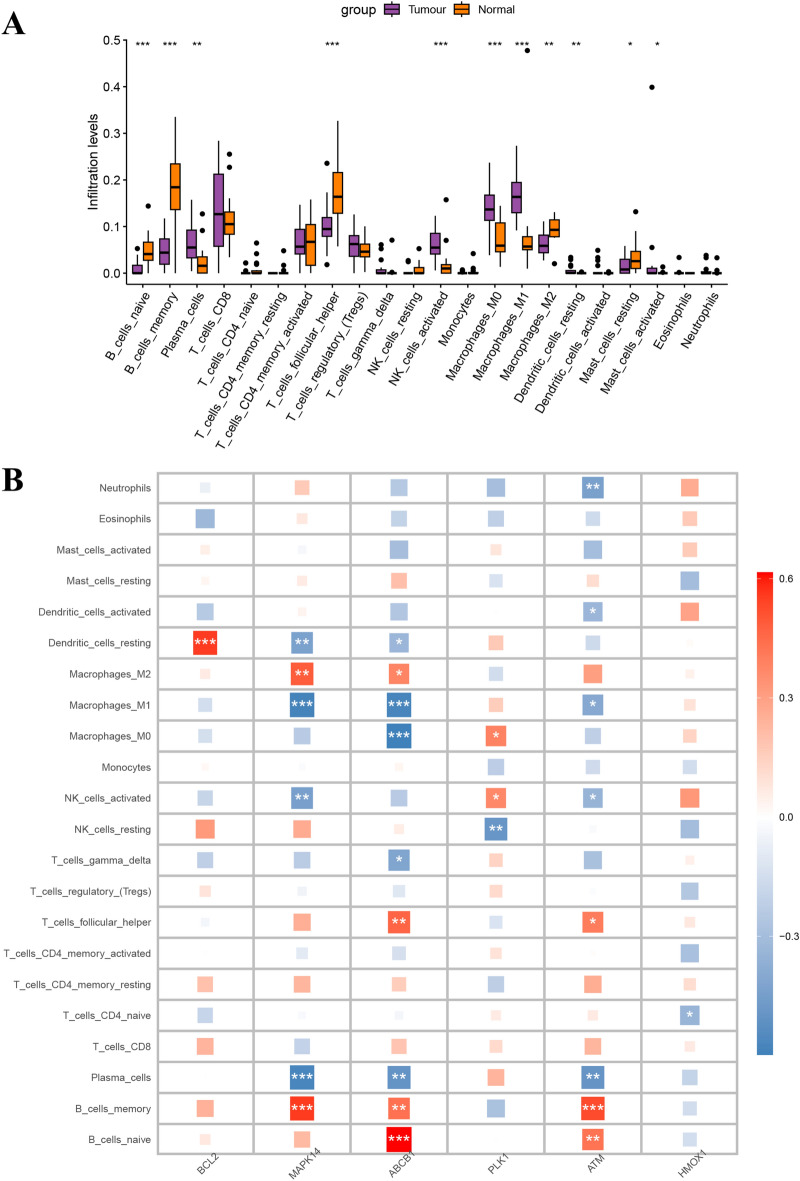
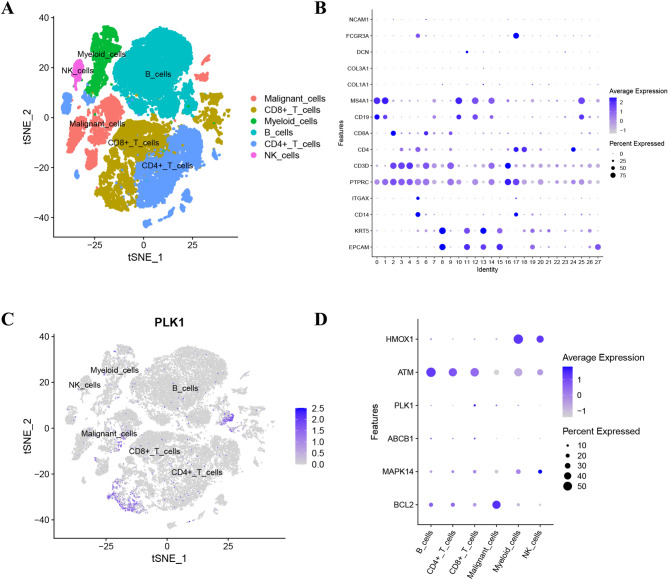
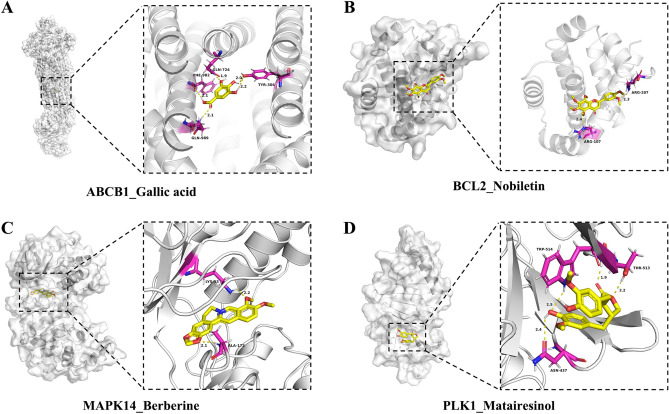
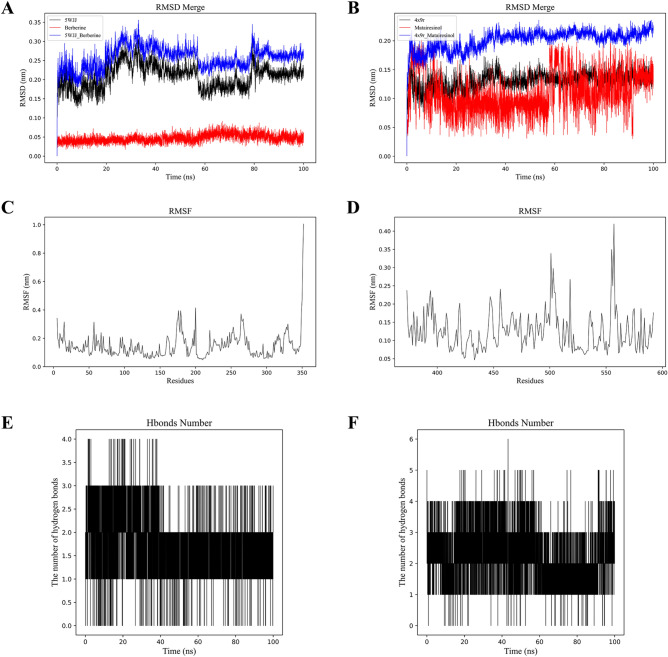
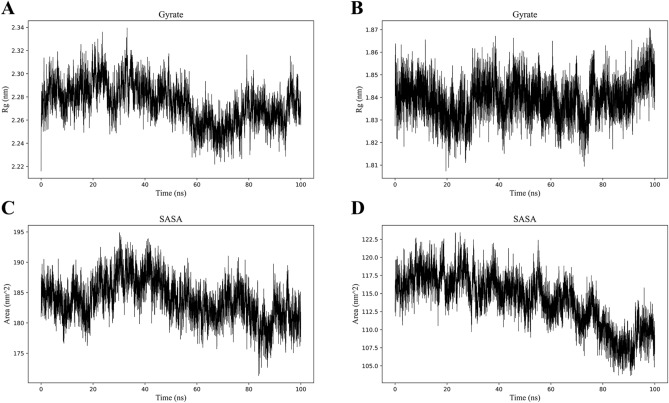
Nasopharyngeal carcinoma (NPC) presents significant treatment challenges due to its complex etiology and late-stage diagnosis. The traditional Chinese medicine Selaginella doederleinii Hieron (S. doederleinii) has shown potentiality in NPC treatment due to its multi-target, multi-pathway anti-cancer mechanisms. First, we identified NPC related target genes from databases like GeneCards, OMIM, and DisGeNET, and performed WGCNA analysis on the GSE53819 dataset to identify several important gene modules related to NPC. Active components and their targets in S. doederleinii were screened from the TCMSP and other databases, identifying 32 overlapping genes. Gene Ontology (GO) and Kyoto Encyclopedia of Genes and Genomes (KEGG) pathway analysis revealed that these genes are primarily involved in critical biological processes like protein phosphorylation and cell cycle regulation. A protein-protein interaction network was constructed, and cytoHubba identified six key genes (BCL2, MAPK14, ABCB1, PLK1, ATM, HMOX1). Kaplan-Meier analysis and immune infiltration analysis further showed that these key genes are closely related to the prognosis and immune microenvironment of NPC patients. Single-cell RNA sequencing analysis revealed the expression distribution of key genes across different immune cell types and explored their roles in the differentiation process of malignant cells through pseudotime trajectory analysis. Molecular docking and dynamics simulation results indicated that the Berberine-MAPK14 and Matairesinol-PLK1 complexes have high binding affinity and stability. Binding free energy calculations confirmed the stability of these complexes. Based on our comprehensive multi-level analysis, the active components of S. doederleinii may play a significant role in the treatment of NPC through multi-pathway and multi-target synergistic effects.

Keywords: Selaginella doederleinii Hieron; MAPK14; Molecular dynamics simulation; Nasopharyngeal carcinoma; Network pharmacology; PLK1.


Conflict of interest statement

Declarations. Competing interests: The authors declare no competing interests.

Figures

Fig. 1
Fig. 1
Weighted gene co-expression network analysis. (A) Selection of soft thresholds for network topology analysis. The left panel shows the scale-free fit index (R2) under different soft thresholds, and the right panel shows the mean connectivity under different soft thresholds. (B) Clustering dendrogram of gene co-expression modules. The color bars represent different gene modules. (C) Heatmap of module-trait relationships. Colors indicate the strength and direction of correlations, with red representing positive correlations and blue representing negative correlations.
Fig. 2
Fig. 2
Elucidation of core targets in S. doederleinii treatment of NPC. (A) Venn diagram of genes related to disease, prognosis, and S. doederleinii. (B) Maximum connectivity subnetwork of intersecting genes. Node colors indicate gene importance, with red being high and yellow being low. (C) UpSet plot showing the overlap of the top 6 targets from six algorithms. (D) Correlation heatmap of key genes. Colors indicate the strength and direction of correlations, with red representing positive correlations and blue representing negative correlations. Numbers indicate correlation coefficients.
Fig. 3
Fig. 3
GO enrichment and KEGG pathway analysis. (A) BP. (B) CC. (C) MF. (D) KEGG pathway enrichment analysis. The size of the dots represents the number of genes, and the color indicates the -log10 (Q-value).
Fig. 4
Fig. 4
Kaplan–Meier survival analysis. The impact of high and low expression of key genes BCL2 (A), PLK1 (B), ATM (C), HMOX1 (D), MAPK14 (E), and ABCB1 (F) on survival rates. The shaded areas represent the 95% confidence intervals, and the table at the bottom shows the number of patients at risk at each time point.
Fig. 5
Fig. 5
Immune infiltration analysis. (A) Comparison of immune cell infiltration levels between tumor and normal tissues. (B) Correlation heatmap between key genes and immune cell infiltration. Colors indicate the strength and direction of correlations, with red representing positive correlations and blue representing negative correlations.
Fig. 6
Fig. 6
Single-Cell RNA Sequencing Analysis. (A) t-SNE plot showing the clustering of different cell types. (B) Expression of cell markers in different cell types. (C) Expression distribution of PLK1 across different cell types. (D) Expression levels of key genes in different cell types. The size of the dots represents the percentage of cells expressing the gene, and the color indicates the average expression level.
Fig. 7
Fig. 7
Molecular docking results showing the binding modes of four compounds with four key gene proteins. (A) Docking model of ABCB1 with Gallic acid. (B) Docking model of BCL2 with Nobiletin. (C) Docking model of MAPK14 with Berberine. (D) Docking model of PLK1 with Matairesinol.
Fig. 8
Fig. 8
Molecular dynamics simulation results demonstrating the stability and conformational changes of ligand–protein complexes over a 100 ns simulation. (A) RMSD curve showing the stability of the Berberine-MAPK14 complex. (B) RMSD curve showing the stability of the Matairesinol-PLK1 complex. (C) RMSF curve for the Berberine-MAPK14 complex. (D) RMSF curve for the Matairesinol-PLK1 complex. (E) Number of hydrogen bonds in the Berberine-MAPK14 complex. (F) Number of hydrogen bonds in the Matairesinol-PLK1 complex.
Fig. 9
Fig. 9
Rg and SASA Analysis. (A) Changes in Rg of the Berberine-MAPK14 complex. (B) Changes in Rg of the Matairesinol-PLK1 complex. (C) Changes in SASA of the Berberine-MAPK14 complex. (D) Changes in SASA of the Matairesinol-PLK1 complex.

References

    1. Chen, Y. P. et al. Nasopharyngeal carcinoma. Lancet394(10192), 64–80. 10.1016/S0140-6736(19)30956-0 (2019). - PubMed
    1. Tang, L. L. et al. Global trends in incidence and mortality of nasopharyngeal carcinoma. Cancer Lett.374(1), 22–30. 10.1016/j.canlet.2016.01.040 (2016). - PubMed
    1. Bossi, P. et al. Nasopharyngeal carcinoma: ESMO-EURACAN Clinical Practice Guidelines for diagnosis, treatment and follow-up†. Ann. Oncol.32(4), 452–465. 10.1016/j.annonc.2020.12.007 (2021). - PubMed
    1. Suryani, L. et al. Precision medicine for nasopharyngeal cancer—A review of current prognostic strategies. Cancers (Basel)16(5), 918. 10.3390/cancers16050918 (2024). - PMC - PubMed
    1. Liu, Y. et al. Traditional Chinese medicine for cancer treatment. Am. J. Chin. Med.52(03), 583–604. 10.1142/S0192415X24500253 (2024). - PubMed

MeSH terms

Substances

LinkOut - more resources