. 2025 Feb;27(2):322-335.
doi: 10.1038/s41556-024-01570-0. Epub 2025 Jan 2.

Nuclear speckles regulate functional programs in cancer

Affiliations

Nuclear speckles regulate functional programs in cancer

Katherine A Alexander et al. Nat Cell Biol. 2025 Feb.

Abstract

Nuclear speckles are dynamic nuclear bodies characterized by high concentrations of factors involved in RNA production. Although the contents of speckles suggest multifaceted roles in gene regulation, their biological functions are unclear. Here we investigate speckle variation in human cancer, finding two main signatures. One speckle signature was similar to healthy adjacent tissues, whereas the other was dissimilar, and considered an aberrant cancer speckle state. Aberrant speckles show altered positioning within the nucleus, higher levels of the TREX RNA export complex and correlate with poorer patient outcomes in clear cell renal cell carcinoma (ccRCC), a cancer typified by hyperactivation of the HIF-2α transcription factor. We demonstrate that HIF-2α promotes physical association of certain target genes with speckles depending on HIF-2α protein speckle-targeting motifs, defined in this study. We identify homologous speckle-targeting motifs within many transcription factors, suggesting that DNA-speckle targeting may be a general gene regulatory mechanism. Integrating functional, genomic and imaging studies, we show that HIF-2α gene regulatory programs are impacted by speckle state and by abrogation of HIF-2α-driven speckle targeting. These findings suggest that, in ccRCC, a key biological function of nuclear speckles is to modulate expression of select HIF-2α-regulated target genes that, in turn, influence patient outcomes. Beyond ccRCC, tumour speckle states broadly correlate with altered functional pathways and expression of speckle-associated gene neighbourhoods, exposing a general link between nuclear speckles and gene expression dysregulation in human cancer.


Conflict of interest statement

Competing interests: A.R. receives royalties from LGC/Biosearch Technologies related to Stellaris RNA-FISH. The other authors declare no competing interests.

Figures
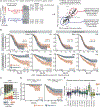
Extended Data Fig. 1 |
Extended Data Fig. 1 |. Speckle signature calculations and association with survival in cancer. Related to Fig. 1.
a) Schematic showing how speckle protein genes with high contributions to patient variation were defined based on Principal Component 1 (PC1) weights. N = 236 speckle protein genes (speckle protein genes with <150 rsem were excluded). b) Kaplan–Meier disease-specific (DSS) or overall survival (OS) analysis for ovarian cancer (OV, top) and ccRCC (KIRC, bottom) splitting individuals based on the top/bottom quartiles of speckle score (left) or on positive versus negative speckle score (right). The ccRCC DSS top/bottom 25% graph represents the same data as Fig. 1c, right, shown here for comparison purposes. Number of individuals in each group are indicated on each graph. Shaded area represents 95% confidence interval. c) Tumour AJCC stage frequency of ccRCC (TCGA KIRC cohort) tumours based on speckle scores split into quartiles. First quartile are the most Signature II tumours; fourth quartile are the most Signature I tumours. N = 127–128 tumours per quartile. d) Kaplan–Meier plots for Stage I and II (left) or Stage III and IV (right) ccRCC (TCGA KIRC cohort). Patients were split into Signature I (positive speckle score) and Signature II (negative speckle score). Shaded area represents 95% confidence interval. e) Speckle scores of tumour-adjacent tissues. Speckle scores were calculated independently for each tissue/cancer type. Each dot represents an individual tumour-adjacent sample. Number of samples is indicated below each box. Boxplot lower and upper hinges correspond to the first and third quartiles; upper whisker extends from the hinge to the largest value no further than 1.5 * IQR. See Supplementary Table 1 for survival statistics for each cancer and Github (https://github.com/katealexander/speckleSignature.git) for detailed instructions, scripts used, and additional files generated relating to speckle signature calculations and survival analysis. Source numerical data are available in source data.
Extended Data Fig. 2 |
Extended Data Fig. 2 |. An identified putative Speckle Targeting Motif (STM) reoccurs among regulators of gene expression. Related to Fig. 2.
a) EMBOSS Matcher alignment showing the best match local motif between p53 (amino acids 62–90) and HIF-2α (amino acids 450–478). b) Clustal Omega alignment of HIF-1α with HIF-2α with MNView visualization. HIF-2α STMs are boxed in red. c) Zoomed in view of HIF-2α STMs in HIF-1α HIF-2α alignment from B. d) Criteria for de novo identification of speckle-targeting motifs (STMs). Detailed instructions can be found on Github (https://github.com/katealexander/speckleTargetingMotif. git). e) Top 5 Biological Processes (BP), Molecular Functions (MF), and Cellular Compartments (CC) found by Gene Ontology analysis of 1755 proteins containing putative STMs. Source numerical data are available in source data.
Extended Data Fig. 3 |
Extended Data Fig. 3 |. Comparison between SON TSA-seq and SON Cut&Run. Related to Figs. 2 and 3.
a) Scatterplot showing relationship between SON TSA-seq and SON Cut&Run normalized counts, averaged over two replicates. RP – Pearson’s R. N = 30491 genomic bins. b) Venn diagram showing the base-pair overlap between regions called as decreasing SON signal in SON TSA-seq (purple) or SON Cut&Run (green) upon 3 hours of PT2399 treatment. P value represents hypergeometric P value of overlap. c) Heatmaps and metaplots of SON TSA-seq (top) or SON Cut&Run (bottom) signal showing regions called as decreasing upon PT2399 treatment by SON TSA-seq (left) or SON Cut&Run (right). d) Heatmap of RNA expression z-scores of changing genes in 786-O cells treated with DMSO control versus a PT2399 timecourse. e) Expression change in 786-O cells of DMSO versus a PT2399 timecourse. Each dot represents one gene decreasing SON signal. Significance calculated using T-test versus null hypothesis of no change. f) (one-sided). N = 2008 genes per timepoint. Boxplot lower and upper hinges correspond to the first and third quartiles; upper whisker extends from the hinge to the largest value no further than 1.5 * IQR. Source numerical data are available in source data.
Extended Data Fig. 4 |
Extended Data Fig. 4 |. Consequences of deleting the HIF-2α Speckle Targeting Motifs (STMs). Related to Fig. 4.
a) Western blot of HIF-2α and GAPDH in 786-O cells, MCF7 cells, and MCF7 single-cell clones with dox-induced expression of HIF2As-wtSTM or HIF2As-ΔSTMs. Clones in red with asterisks denote selected clones. The same samples were loaded in the first eight lanes of both Western blots shown. b) RNA-seq normalized counts of EPAS1, which encodes HIF-2α, in negative control (grey) and single-cell clones of dox-induced HIF2As-wtSTM (yellow) and HIF2As-ΔSTMs (blue). c) Relationship between DDIT4 transcription site (TS) exon intensities and distance to speckle from immunoRNA-FISH data. Neg, wtSTM1 and ΔSTM12 are the same data as Fig. 4e, shown again here for comparison. Each point is an individual transcription site. Number of transcription sites quantified is indicated in each plot. d) Relationship between DDIT4 transcription site (TS) intron intensities and distance to speckle from immunoRNA-FISH data. Each point is an individual transcription site. Number of transcription sites quantified is indicated in each plot. e) Quantification of DDIT4 transcription site (TS) exon intensities from immunoRNA-FISH data. Each dot is an individual transcription site. Number of transcription sites quantified is indicated below each box. Significance calculated using Wilcoxon test (two-sample). f) Fold change of MCF7 HIF-2α target genes with dox-induction of HIF2As-wtSTM or HIF2As-ΔSTMs split into quintiles by speckle association status from Fig. 2. Each dot is one HIF-2α target gene. N = 222 genes per quintile. Boxplot lower and upper hinges correspond to the first and third quartiles; upper whisker extends from the hinge to the largest value no further than 1.5 * IQR. Source numerical data and Western blot images are available in source data.
Extended Data Fig. 5 |
Extended Data Fig. 5 |. Pathway and gene neighborhood correlations of tumours with differential speckle Signatures. Related to Fig. 5.
a) Example gene set enrichment plots for breast cancer (BRCA), melanoma (SKCM), and ccRCC (KIRC) for Hallmark (left; see also Extended Data Fig. 5b), KEGG (middle; see also Extended Data Fig. 5b), and chromosome cytogenetic bands (right; see also Fig. 5a and Extended Data Fig. 5c) of gene expression biases between speckle Signature I and II patient groups. b) Hallmark and KEGG gene set enrichment statistics for speckle Signature I versus Signature II speckle patient groups. ccRCC (KIRC) is in red text. c) Chromosome band gene set enrichment statistics for Signature I versus Signature II speckle patient groups, shown side-by-side with chromosome SON TSA-seq signal (horizontal genome browser tracks; data from Fig. 2), and depictions of chromosomes 11 (top), 13 (middle) and 19 (bottom), with cytogenetic banding pattern shown in green and purple. See also Fig. 5a. d) Volcano plot showing significant speckle Signature I-biased (orange) and significant speckle Signature II-biased (blue) HIF-2α target genes. e) RNA expression of PKM and SPHK1 in Signature I (N = 152 tumours), tumour-adjacent normal tissue (Adj.; N = 72 samples), and Signature II (N = 116 tumours) samples from the TCGA KIRC cohort. Each dot represents one sample. Significance calculated using Wilcoxon test (two-sided). f) RNA expression of MXI1 and EGLN3 in Signature I (N = 152 tumours), tumour-adjacent normal tissue (Adj.; N = 72 samples), and Signature II (N = 116 tumours) samples from the TCGA KIRC cohort. Each dot represents one sample. Significance calculated using Wilcoxon test (two-sided). Boxplot lower and upper hinges correspond to the first and third quartiles; upper whisker extends from the hinge to the largest value no further than 1.5 * IQR. Source numerical data are available in source data.
Extended Data Fig. 6 |
Extended Data Fig. 6 |. Consequences of ALYREF knockdown on speckle-associated gene expression. Related to Fig. 6.
a) ALYREF immunofluorescence (red) and DAPI (cyan) in 786-O cells treated with non-targeting (NTC) or ALYREF siRNAs (ALY KD5 and ALY KD8), and quantification of ALYREF signal intensity (violin plot). b) Western blot showing ALYREF protein levels in 786-O cells treated with non-targeting (NTC) or ALYREF siRNAs (ALY KD5 and ALY KD8). c) Decile plot of the fold change upon ALYREF knockdown (ALY KD8; ALY KD5 in Fig. 6d) split into deciles based on 786-O DMSO-treated SON TSA-seq signal (from Fig. 2). d) SON TSA-seq signal of genes that decrease upon ALYREF knockdown (orange, ‘down’; N = 1159 genes), are unchanged (grey, ‘ns’; N = 13684 genes), and increase (blue, ‘up’; N = 1302 genes). Significance calculated between groups using Wilcoxon tests (two-sided). e) Same as D with genes split by top, middle, or bottom third of expression. f) Same as D for HIF-2α target genes. N down = 177 genes; N ns = 955 genes; N up = 221 genes. g) Western blot of HIF-2α and GAPDH in 786-O cells treated with non-targeting control (NTC) or two different EPAS1 (which encodes HIF-2α) siRNAs (KD3 or KD4). h) Single-molecule immunoRNA-FISH quantification of DDIT4 transcription site (TS) distance to speckle versus exon intensity for non-targeting control (NTC), ALYREF (ALY KD5 and ALY KD8, two different siRNAs), and EPAS1 (KD3 and KD4) siRNA treatment in 786-O cells. NTC, ALY KD5, and EPAS1 KD3 data are the same data as in Fig. 6g, shown here for comparison purposes. Boxplot lower and upper hinges correspond to the first and third quartiles; upper whisker extends from the hinge to the largest value no further than 1.5 * IQR. Source numerical data and Western blot images are available in source data.
Extended Data Fig. 7 |
Extended Data Fig. 7 |. Consequences of knockdown of SART1, FIBP, TMEM259, DDX39A, or SARNP. Related to Fig. 6.
a) Expression of SART1, FIBP, TMEM259, DDX39A, and SARNP in Signature I (N = 152 tumours), adjacent tissue (Adj.; N = 72 samples), and Signature II (N = 116 tumours) sample groups from the TCGA KIRC cohort. Each dot represents one tumour or adjacent sample. b) RNA-seq normalized counts of SART1, FIBP, TMEM259, DDX39A, and SARNP in 786-O cells treated with non-targeting control (NTC) or respective gene knockdowns (that is SART1 KD4 and KD6 for SART1), with two siRNAs used per gene knocked down. Error bars represent standard error of two biological replicates. c) Decile plot fold change upon knockdown (knockdown versus non-targeting control siRNA) split into speckle association deciles. Each dot represents one gene. All expressed genes are represented. Two siRNAs were used for each gene (that is SART1 KD4 and KD6 for SART1). ALYREF knockdowns, KD5 and KD8 from Fig. 6d and Extended Data Fig. 6c are copied here for purposes of comparison. Significance calculated using Wilcoxon test (two-sided). Boxplot lower and upper hinges correspond to the first and third quartiles; upper whisker extends from the hinge to the largest value no further than 1.5 * IQR. Source numerical data are available in source data.
Extended Data Fig. 8 |
Extended Data Fig. 8 |. Relationship between speckle characteristics and patient survival in ccRCC. Related to Fig. 7.
a) Example SON immunofluorescence images showing how speckles were called in CellProfiler (red outlines) in 786-O cells treated with NTC or ALYREF siRNAs (two ALYREF siRNAs – KD5 and KD8). Scale bar represents 5 μm. b) Total speckle area per nucleus in 786-O cells treated with NTC or ALYREF siRNAs. Each dot is an individual nucleus measurement. Number of nuclei measured for each condition: NTC – 246, ALY KD5 – 285, ALY KD8 – 191. c) Number of speckles per nucleus in 786-O cells treated with NTC or ALYREF siRNAs. Each dot is an individual nucleus measurement. Number of nuclei measured for each condition: NTC – 246, ALY KD5 – 285, ALY KD8 – 191. Significance calculated using Wilcoxon test (two-sided). d) Percentage of extra-large (XL) speckles per nucleus in 786-O cells treated with NTC or ALYREF siRNAs. Each dot is an individual nucleus measurement. Number of nuclei measured for each condition: NTC – 246, ALY KD5 – 285, ALY KD8 – 191. Significance calculated using Wilcoxon test (two-sided). e) Fraction of SON signal in the nucleus periphery per nucleus in 786-O cells treated with NTC or ALYREF siRNAs. Each dot is an individual nucleus measurement. Number of nuclei measured for each condition: NTC – 246, ALY KD5 – 285, ALY KD8 – 191. Significance calculated using Wilcoxon test (two-sided). f) Additional representative 20x images of tumours with high central SON (left) and high peripheral SON (right). See also Fig. 7c. Scale bar represents 5 μm. g) Kaplan–Meier plot of ccRCC split by the top (N = 38 patients) and bottom (N = 39 patients) 50% of SON in the nucleus periphery. P value represents Kaplan–Meier calculated survival statistic. h) Fraction of SON in the nucleus periphery for adjacent tissue (grey) and ccRCC tumours split by tumour grade. Each dot represents the median value of all the nuclei measured in one sample. Significance calculated by Wilcoxon test. i) Kaplan–Meier plot of Grade 1 and 2 ccRCC split by the top (N = 36 patients) and bottom (N = 27 patients) 50% of SON in the nucleus centre. P value represents Kaplan–Meier calculated survival statistic. Boxplot lower and upper hinges correspond to the first and third quartiles; upper whisker extends from the hinge to the largest value no further than 1.5 * IQR. Source numerical data are available in source data.
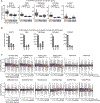
Fig. 1 |
Fig. 1 |. A recurring speckle signature predicts patient outcomes in ccRCC.
a, Schematic showing generation of multi-cancer speckle signature. Proteins residing within speckles were identified using the Human Protein Atlas (i), their RNA expression evaluated in cancer using TCGA (ii), contributions to patient variation compared (iii; heatmap of Pearson’s pairwise correlations between cancer types), and consistent speckle protein gene contributors to patient variation were identified (iv). See also Extended Data Fig. 1a. b, z-score heatmaps of speckle protein gene expression in melanoma (SKCM; n = 443 tumours), BRCA (n = 1,082 tumours) and ccRCC (KIRC; n = 510 tumours). The bar on the left represents speckle scores. The bar above represents Signature I (blue) or Signature II (pink) high speckle protein genes (from Fig. 1a). c, Kaplan–Meier plots separating cancer cohorts by the top (Signature I) and bottom (Signature II) 25% of speckle scores. See also Extended Data Fig. 1b and Supplementary Table 1. The number of patients analysed with Signatures I and II is noted within the figure. Shaded areas denote 95% CI. SKCM, P = 0.33; BRCA, P = 0.85; KIRC, P < 0.0001. Source numerical data are available in Source data.
Fig. 2 |
Fig. 2 |. HIF-2α maintains DNA-speckle contacts in 786-O ccRCC cells.
a, Alignment of putative STMs shared between p53, HIF-2α and GATA1 with schematic of STM locations in p53 and HIF-2α. Asterisk (*) marks spaced prolines. b, Metaplot and heatmap of HIF-2α ChIP-seq signal at HIF-2α-binding peaks in 786-O cells treated with dimethylsulfoxide (DMSO) control or HIF-2α inhibitor for 3 h (2 μm PT2399). c, Genome browser tracks of SON Cut&Run (top green tracks) and SON TSA-seq (bottom purple tracks) in 786-O cells upon 3 h DMSO or PT2399 treatment. PT2399 (light colour) is shown overlayed on top of DMSO (dark colour) signal. Data represent two separately cultured replicates. Decreased SON regions (green and purple bars for Cut&Run and TSA-seq, respectively) and HIF-2α binding sites (black bars) are shown above tracks. Genes are shown below tracks. All four genomic regions (iiv) are shown to the same scale, both for y axis and zoom. d, z-score heatmaps of genes within SON changing regions from c that decrease expression upon HIF-2α inhibition via PT2399 (3, 6, 9 or 12 h after treatment; n = 2 separately cultured replicates). Heatmaps are separated by region shown in c, with lines above indicating the location of each gene. e, Example immunoDNA-FISH images of speckles (red; SON immunofluorescence), nuclei (cyan; 4,6-diamidino-2-phenylindole (DAPI)), DDIT4 DNA-FISH (yellow, left images; example SON decreasing gene) and DDX21 DNA-FISH (green, right images; example non-SON decreasing gene). Scale bars, 2 μm. f, Quantification of immunoDNA-FISH loci distance to the nearest speckle (in μm) for SON decreasing genes (orange) and non-SON decreasing genes (blue). Each dot represents one locus (number quantified indicated below plots). Significance was calculated using a Wilcoxon test (two-sided). Boxplot lower and upper hinges correspond to the first and third quartiles; upper whiskers extend from the hinge to the largest value no further than 1.5 × interquartile range (IQR). g, Relationship between SON TSA-seq (left) or SON Cut&Run (right) and proportion of foci at speckle measured by immunoDNA-FISH. Each dot represents one genomic locus. n = 14 (7 loci calculated by DNA-FISH and genomics under DMSO and PT2399 conditions). ****P < 0.0001; NS, not significant. For full list of STM-containing proteins and STM sequences, see Supplementary Tables 2 and 3. Source numerical data are available in Source data.
Fig. 3 |
Fig. 3 |. HIF-2α regulates speckle association of a functionally distinct subset of target genes.
a, Venn diagram showing overlap of genes decreasing RNA expression and SON signal. Significance calculated using hypergeometric test (P < 1 × 10⁻¹⁶). b, Baseline RNA expression of HIF-2α target gene that did (associating; purple box; n = 250 genes) or did not (non-associating; grey box; n = 519 genes) have speckle association decrease with PT2399. Significance was calculated using a Wilcoxon test (two-sided; P = 9.8 × 10⁻⁸). Normalized counts calculated as the average of two separately cultured replicates. c, RNA fold change in a PT2399 timecourse of HIF-2α target gene that did (associating; purple box; n = 250 genes) or did not (non-associating; grey box; n = 519 genes) have speckle association decrease with PT2399. Significance was calculated using a Wilcoxon test (two-sided; 3 h, P = 0.00025; 6 h, P = 0.00064; NS, not significant). Fold change data were generated from two separately cultured replicates. d, Heatmaps of z-scores for genes decreasing expression upon PT2399 treatment for speckle-associating (left) and non-speckle-associating (right) genes (n = 2). Top cluster, genes that decrease at earlier PT2399 time points; bottom cluster, genes that decrease at later time points. e, GO showing HIF-2α pathways biases of associating (left) or non-associating (right) HIF-2α target genes. Boxplot lower and upper hinges correspond to the first and third quartiles; upper whiskers extend from the hinge to the largest value no further than 1.5 × IQR. Source numerical data are available in Source data.
Fig. 4 |
Fig. 4 |. The HIF-2α speckle-targeting motifs are essential for HIF-2α-driven DNA-speckle association.
a, Schematic of experiment. HIF2As, VHL-resistant HIF-2α with P405A;P531A. wtSTM, STMs intact. ΔSTMs, STMs deleted (Δ455–470; Δ776–791). b, immunoDNA-FISH loci distance to speckle for DDIT4 and DDX21 in negative control and single-cell clones of dox-induced HIF2As-wtSTM (yellow; clones 1, 7 and 4) or HIF2As-ΔSTMs (blue; clones 12, 10 and 4). Number of loci quantified is indicated. Significance calculated using Wilcoxon test (two-sided; neg versus wtSTM1, P = 0.0024; neg versus wtSTM7, P = 0.00075; neg versus wtSTM4, P = 0.0015). c, Example image of single-molecule (sm) RNA-FISH of DDIT4 exons (green), DDIT4 introns (yellow), with DNA labelled using DAPI (cyan) and speckles labelled by SON immunofluorescence (red). Arrowheads indicate location of DDIT4 transcription sites (TSs) where intronic and exonic probes overlap. d, DDIT4 TS exon intensities from immunoRNA-FISH. Each dot is an individual TS (number quantified is indicated below plot). Significance was calculated using a Wilcoxon test (two-sided; neg versus wtSTM1, P = 3.2 × 10⁻⁷; neg versus wtSTM7, P = 1.6 × 10⁻⁷; wtSTM1 versus ΔSTM12, P < 2.2 × 10⁻¹⁶; wtSTM1 versus ΔSTM10, P = 1.6 × 10⁻⁸; wtSTM7 versus ΔSTM12, P < 2.2 × 10⁻¹⁶; wtSTM7 versus ΔSTM10, P = 7.5 × 10⁻⁹). See also Extended Data Fig. 4e. e, Relationship between DDIT4 TS exon intensities and distance to speckle. Each point is an individual TS (number quantified is indicated within plot). Significance calculated using Wilcoxon test (two-sided). See also Extended Data Fig. 4c,d. f, Number of DDIT4 exon spots per cell. Each dot is an individual cell (number quantified is indicated below plot). Significance calculated using Wilcoxon test (two-sided; neg versus wtSTM1, P < 2.2 × 10⁻¹⁶; neg versus wtSTM7, P < 2.2 × 10⁻¹⁶; wtSTM1 versus ΔSTM12, P < 2.2 × 10⁻¹⁶; wtSTM1 versus ΔSTM10, P < 2.2 × 10⁻¹⁶; wtSTM7 versus ΔSTM12, P = 7.9 × 10⁻¹⁵; wtSTM7 versus ΔSTM10, P < 2.2 × 10⁻¹⁶). g, Normalized counts of representative HIF-2α targets in MCF7 cells with no HIF-2α induced (neg; n = 2 separately cultured replicates), HIF-2α with wild-type STMs induced (wtSTM; n = 3 separately derived clones) and HIF-2α with deleted STMs induced (ΔSTMs; n = 3 separately derived clones). Error bars represent standard error. h, MCF7 cell RNA fold change versus no HIF-2α negative control of HIF-2α target genes with dox induction of HIF2As-wtSTM or HIF2As-ΔSTMs split by whether the target gene did (‘Associating’; n = 296 genes) or did not (‘Non-associating’; n = 873 genes) decrease speckle association in 786-O cells treated with PT2399 from Fig. 2. Each dot is one HIF-2α target gene. Significance calculated using Wilcoxon test (two-sided; ΔSTM non-associating versus associating genes, P = 1.3 × 10⁻⁵; wtSTM versus ΔSTM speckle-associating genes, P = 2.8 × 10⁻⁷). i, Model showing loss of speckle association and expression with HIF-2α STM deletion. Boxplot lower and upper hinges correspond to the first and third quartiles; upper whiskers extend from the hinge to the largest value no further than 1.5 × IQR. Source numerical data are available in Source data.
Fig. 5 |
Fig. 5 |. Cell line-mapped speckle-associated genes are more highly expressed in the speckle Signature I patient group.
a, Depictions of chromosomes, SON TSA-seq genome browser tracks, and cytogenetic band enrichment statistics of Signature I versus Signature II for chromosomes 6, 9, 18 and 22. See also Extended Data Fig. 5a,c. b, Decile plot of genes binned based on speckle association status showing gene expression ratio in speckle Signature I versus Signature II patient groups. Each dot represents one gene (n = 1,614 genes per bin). Significance was calculated using a Wilcoxon test (two-sided; bin 1 versus 10, P < 2.2 × 10⁻¹⁶). c, SON normalized counts versus speckle patient group gene expression for HIF-2α target genes. Rs, Spearman’s correlation coefficient (0.54). P value (P < 0.001) represents correlation significance. n = 986 genes. d, SON TSA-seq genome browser tracks of HIF-2α target genes with varying speckle association (top, purple) and expression in speckle Signature I (n = 152 tumours), normal adjacent tissue (Adj.; n = 72 samples) and Signature II (n = 116 tumours) samples. Each dot represents one sample. Significance was calculated using a Wilcoxon test (two-sided; PHPT1 Sig. I versus Adj., P < 2.2 × 10⁻¹⁶; PHPT1 Sig. I versus Sig. II, P < 2.2 × 10⁻¹⁶; PHPT1 Sig. II versus Adj., P = 0.0051; DDIT4 Sig. I versus Adj., P < 2.2 × 10⁻¹⁶; DDIT4 Sig. I versus Sig. II, P = 0.0062; DDIT4 Sig. II versus Adj., P < 2.2 × 10⁻¹⁶; VEGFA Sig. I versus Adj., P < 2.2 × 10⁻¹⁶; VEGFA Sig. I versus Sig. II, P = 0.45; VEGFA Sig. II versus Adj., P < 2.2 × 10⁻¹⁶; ASAP1 Sig. I versus Adj., P = 2 × 10⁻¹³; ASAP1 Sig. I versus Sig. II, P < 2.2 × 10⁻¹⁶; ASAP1 Sig. II versus Adj., P < 2.2 × 10⁻¹⁶). e, GO showing HIF-2α pathways biased toward Signature I (top) or Signature II (bottom) speckle patient group. The number of genes in each group is indicated. f, Schematic depicting combination of speckle Signature and STM deletion data (left). Boxplot of HIF-2α target gene-speckle Signature expression bias (above 0 genes, more highly expressed in speckle Signature I patient group; below 0 genes, more highly expressed in Signature II patient group) for target genes more highly expressed in HIF2As-wtSTM (yellow box; n = 188 genes), not differential (grey box; n = 823 genes) or more highly expressed in HIF2As-ΔSTMs (blue box; n = 158 genes) in MCF7 cells with dox-induced HIF-2α. Significance calculated using Wilcoxon test (two-sided; wtSTM versus NS, P < 2.2 × 10⁻¹⁶; ΔSTM versus NS, P < 2.2 × 10⁻¹⁶). g, Quintile plot of HIF-2α target gene fold changes of HIF2As-wtSTM versus HIF2As-ΔSTMs split by speckle signature bias. Significance calculated using Wilcoxon test (two-sided; bin 1 versus bin 5, P < 2.2 × 10⁻¹⁶). Number of HIF-2α target genes in each bin: n(1) = 169, n(2) = 227, n(3) = 285, n(4) = 248 and n(5) = 240. h, Model depicting lower expression of speckle-associated genes in speckle Signature II. SON TSA-seq data in ad are from Fig. 2 786-O DMSO condition. HIF2As-wtSTM versus HIF2A-ΔSTM RNA-seq data in f and g are from the same experiment as Fig. 4. Boxplot lower and upper hinges correspond to the first and third quartiles; upper whiskers extend from the hinge to the largest value no further than 1.5 × IQR. Source numerical data are available in Source data.
Fig. 6 |
Fig. 6 |. TREX complex member, ALYREF, is required for full expression of speckle-associated genes.
a, Speckle protein physical interactome network. Transparent nodes are non-speckle interactors. Opaque nodes are speckle-resident proteins. b, Speckle Signature expression ratio of speckle protein genes split by functional category. Significance calculated for ‘TREX complex’ using a one-sample t-test versus null hypothesis of 0 (P = 0.018). Number of genes denoted under plots. c, Expression of ALYREF in Signature I (n = 152 tumours), healthy adjacent tissue (Adj.; n = 72 samples) and Signature II (n = 116 tumours) samples. Each dot represents one sample. Significance was calculated using Wilcoxon tests (two-sided; Sig. I versus Adj., P = 9.6 × 10⁻¹⁵; Sig. I versus Sig. II, P < 2.2 × 10⁻¹⁶; Adj. versus Sig. II, P = 0.29). d, Gene expression fold change upon ALYREF knockdown (ALY KD5) split into speckle association deciles. Each dot represents one gene. n = 1,076 genes per decile. Significance was calculated using a Wilcoxon test (two-sided; bin 1 versus bin 10, P < 2.2 × 10⁻¹⁶). See also Extended Data Fig. 6c. e, Signature expression ratio for genes that decrease (‘down’; n = 1,159), are unchanged (‘NS’; n = 13,684) or increase (‘up’; n = 1,302) upon ALYREF knockdown. Significance calculated using Wilcoxon tests (two-sided; down versus NS P = 3.4 × 10⁻⁸; NS versus up P < 2.2 × 10⁻¹⁶). f, Same as e for HIF-2α target genes. n(down) = 177; n(NS) = 955; n(up) = 221. Down versus NS, P = 0.00062; NS versus up, P = 2.4 × 10⁻⁶. g, Single-molecule immunoRNA-FISH quantification of DDIT4 TS distance to speckle versus exon intensity in 786-O cells. Each point represents an individual TS. The number of TSs quantified is indicated in each plot. See also Extended Data Fig. 6g,h. h, DDIT4 TS exon intensities in 786-O cells treated with non-targeting control (NTC) or siRNAs for ALYREF or EPAS1. Each dot represents an individual TS. Number of TSs quantified is indicated. Significance was calculated using Wilcoxon tests (two-sided; NTC versus ALYkd5, P = 9.3 × 10⁻⁹; NTC versus ALYkd8, P < 2.2 × 10⁻¹⁶; NTC versus EPAS1kd3, P < 2.2 × 10⁻¹⁶; NTC versus EPAS1kd4, P < 2.2 × 10 −16). i, Number of DDIT4 exon spots per cell in 786-O cells. Each dot represents an individual cell. The number of TSs quantified is indicated. Significance was calculated using Wilcoxon tests (two-sided; NTC versus ALYkd5, P = 0.0019; NTC versus ALYkd8, P = 0.0073; NTC versus EPAS1kd3, P < 2.2 × 10⁻¹⁶; NTC versus EPAS1kd4, P < 2.2 × 10⁻¹⁶). j, DDIT4 TS distance to nearest speckle in 786-O cells. Each dot represents an individual TS. The number of TSs quantified is indicated. Significance was calculated using Wilcoxon tests (two-sided; NTC versus EPAS1kd3, P = 0.00098; NTC versus EPAS1kd4, P = 1.1 × 10⁻⁶). k, Model showing decreased expression of speckle-associated genes upon ALYREF knockdown. SON TSA-seq data are from Fig. 2 786-O DMSO condition. Boxplot lower and upper hinges correspond to the first and third quartiles; upper whiskers extend from the hinge to the largest value no further than 1.5 × IQR. Source numerical data are available in Source data.
Fig. 7 |
Fig. 7 |. Imaging-based SON radial positioning with the nucleus correlates with ccRCC outcomes and RNA-based speckle signature.
a, Schematic of ccRCC tumour array (left), SON immunofluorescence (red) and DAPI (cyan) imaging, image analysis and survival calculation (right). Scale bar, 10 μm. b, −log2 Kaplan–Meier statistic for each SON imaging measurement, coloured by type of measurement (left). Schematic of radial distribution measurement (right). c, Representative 20× images of tumours with high central SON (left) and high peripheral SON (right). See also Extended Data Fig. 8f. Scale bar, 5 μm. d, Kaplan–Meier plot of ccRCC tumours split by the top (n = 38 tumours) and bottom (n = 39 tumours) 50% of SON in the nucleus centre. P value represents Kaplan–Meier statistics. Error windows denote 95% CI. e, Fraction of SON in the nucleus centre for adjacent tissue (grey) and ccRCC tumours split by tumour grade. Each dot represents the median value of all the nuclei measured in one sample (number samples indicated below each violin). Significance was calculated by a Wilcoxon test (two-sided; adjacent tissue versus grade 1 tumours, P = 9.3 × 10⁻⁶; grade 1 versus grade 3 tumours, P = 0.00044). f, Relationship between speckle score and the fraction of SON in the nucleus centre from ccRCC tumour and adjacent non-tumour samples split for RNA and imaging (as in schematic, left). Tx, patient-derived xenograft tumour from mice; all four tumours are from the same individual donor, but different mice. T, primary tumour (n = 3). N, tumour-adjacent samples (n = 3). g, Speckle scores calculated from RNA-seq data of patient-derived mouse xenograft tumours that were resistant or sensitive to PT2399 HIF-2α inhibition. Data represent 18 resistant and 19 sensitive mouse xenograft tumours derived from 9 total individuals. Significance was calculated using Fisher’s exact test (P < 0.05). h, ccRCC Signature I (left) or Signature II (right) patient overall survival Kaplan–Meier plots in response to nivolumab (PD1 inhibitor) or everolimus (mTOR inhibitor). Signature I nivolumab n = 97; Signature I everolimus n = 52; Signature II nivolumab n = 84; Signature II everolimus n = 78. Error windows denote 95% CI. Significance represents Kaplan–Meier statistic (nivolumab versus everolimus Signature II, P < 0.0005). i, Model showing speckle-based gene regulation and impacts on ccRCC. Our data indicate that gene regulation can occur by changes in speckle state (left) or by changes in transcription factor-regulated DNA-speckle association (right). In ccRCC, altered DNA-speckle targeting results in skewed HIF-2α target gene expression in a similar manner to speckle compositional states. Source numerical data are available in Source data.

References

    1. Galganski L, Urbanek MO & Krzyzosiak WJ. Nuclear speckles: molecular organization, biological function and role in disease. Nucleic Acids Res. 45, 10350–10368 (2017). - PMC - PubMed
    1. Lamond AI & Spector DL. Nuclear speckles: a model for nuclear organelles. Nat. Rev. Mol. Cell Biol. 4, 605–612 (2003). - PubMed
    1. Spector DL & Lamond AI. Nuclear speckles. Cold Spring Harb. Perspect. Biol. 3, a000646 (2011). - PMC - PubMed
    1. Saitoh N et al. Proteomic analysis of interchromatin granule clusters. Mol. Biol. Cell 15, 3876–3890 (2004). - PMC - PubMed
    1. Dopie J, Sweredoski MJ, Moradian A & Belmont AS. Tyramide signal amplification mass spectrometry (TSA-MS) ratio identifies nuclear speckle proteins. J. Cell Biol. 219, e201910207 (2020). - PMC - PubMed

MeSH terms

Substances