. 2025 Jan;57(1):53-64.
doi: 10.1038/s41588-024-01978-2. Epub 2025 Jan 2.

The impact of common and rare genetic variants on bradyarrhythmia development

Lu-Chen Weng #  1   2   3 Joel T Rämö #  4   5 Sean J Jurgens #  2   6 Shaan Khurshid #  1   2   7 Mark Chaffin  2 Amelia Weber Hall  8 Valerie N Morrill  2 Xin Wang  2 Victor Nauffal  2   3   9 Yan V Sun  10   11 Dominik Beer  12 Simon Lee  13 Girish N Nadkarni  13 ThuyVy Duong  14 Biqi Wang  15 Tomasz Czuba  16   17 Thomas R Austin  18   19 Zachary T Yoneda  20 Daniel J Friedman  21 Anne Clayton  22 Matthew C Hyman  23 Renae L Judy  24 Allan C Skanes  25 Kate M Orland  26 Timothy M Treu  3 Matthew T Oetjens  27 Alvaro Alonso  28 Elsayed Z Soliman  29 Honghuang Lin  15 Kathryn L Lunetta  30 Jesper van der Pals  31 Tariq Z Issa  32 Navid A Nafissi  21 Heidi T May  22 Peter Leong-Sit  25 Carolina Roselli  2   33 Seung Hoan Choi  2 FinnGenMillion Veteran ProgramRegeneron Genetics CenterHabib R Khan  34 Stacey Knight  22   35 Richard Karlsson Linnér  27   36 Connie R Bezzina  37 Samuli Ripatti  38 Susan R Heckbert  18   19 J Michael Gaziano  3   39   40 Ruth J F Loos  41   42 Bruce M Psaty  18   43 J Gustav Smith  16   17   31   44 Emelia J Benjamin  45   46   47 Dan E Arking  14 Daniel J Rader  48 Svati H Shah  21   49 Dan M Roden  50 Scott M Damrauer  24   51 Lee L Eckhardt  26 Jason D Roberts  25 Michael J Cutler  22 M Benjamin Shoemaker  20 Christopher M Haggerty  12   52 Kelly Cho  3   39   40 Aarno Palotie  4   53   54 Peter W F Wilson  10   55 Patrick T Ellinor  2   7 Steven A Lubitz  56
Collaborators, Affiliations

The impact of common and rare genetic variants on bradyarrhythmia development

Lu-Chen Weng et al. Nat Genet. 2025 Jan.

Abstract

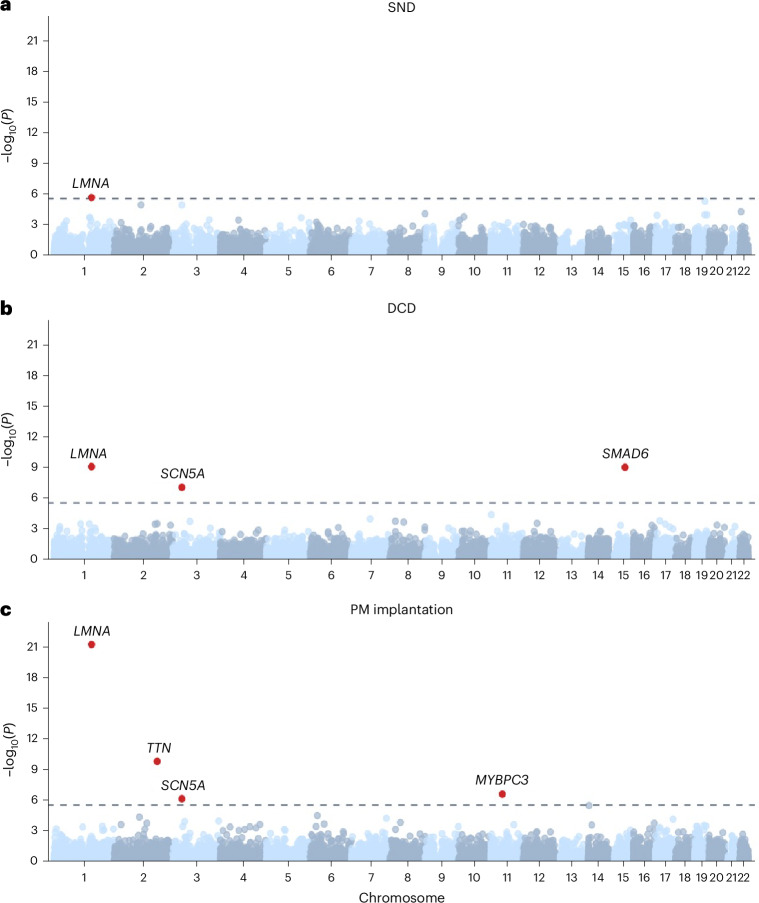
To broaden our understanding of bradyarrhythmias and conduction disease, we performed common variant genome-wide association analyses in up to 1.3 million individuals and rare variant burden testing in 460,000 individuals for sinus node dysfunction (SND), distal conduction disease (DCD) and pacemaker (PM) implantation. We identified 13, 31 and 21 common variant loci for SND, DCD and PM, respectively. Four well-known loci (SCN5A/SCN10A, CCDC141, TBX20 and CAMK2D) were shared for SND and DCD, while others were more specific for SND or DCD. SND and DCD showed a moderate genetic correlation (rg = 0.63). Cardiomyocyte-expressed genes were enriched for contributions to DCD heritability. Rare-variant analyses implicated LMNA for all bradyarrhythmia phenotypes, SMAD6 and SCN5A for DCD and TTN, MYBPC3 and SCN5A for PM. These results show that variation in multiple genetic pathways (for example, ion channel function, cardiac developmental programs, sarcomeric structure and cellular homeostasis) appear critical to the development of bradyarrhythmias.


Conflict of interest statement

Competing interests: S.A.L. is employed by Novartis as of July 2022. S.A.L. received sponsored research support from Bristol Myers Squibb/Pfizer, Bayer AG, Boehringer Ingelheim, Fitbit, IBM, Medtronic and Premier and consulted for Bristol Myers Squibb/Pfizer, Bayer AG, Blackstone Life Sciences and Invitae. C.R. is a full-time employee at GSK as of July 2024. P.T.E. has received sponsored research support from Bayer AG, IBM Research, Bristol Myers Squibb, Pfizer and Novo Nordisk; he has also served on advisory boards or consulted for Bayer AG and MyoKardia. S.M.D. receives research support from RenalytixAI and Novo Nordisk, outside the scope of the current research. The FinnGen project is funded by two grants from Business Finland (HUS 4685/31/2016 and UH 4386/31/2016) and the following industry partners: AbbVie, AstraZeneca, Biogen, Bristol Myers Squibb (and Celgene and Celgene International II Sàrl), Genentech, Merck Sharp & Dohme, Pfizer, GlaxoSmithKline Intellectual Property Development, Sanofi US Services, Maze Therapeutics, Janssen Biotech, Novartis AG and Boehringer Ingelheim International GmbH. B.M.P. serves on the steering committee of the Yale Open Data Access Project funded by Johnson & Johnson. The remaining authors declare no competing interests.

Figures

Fig. 1
Fig. 1. Study design.
a, Typical anatomical regions in which conduction tissue affected by SND and DCD are localized in the heart. A dual-chamber PM is also demonstrated. Sample sizes are shown by common variant GWAS and rare variant association tests (RVAT) for all three outcomes. b, Overview of common and rare variant analyses for SND, DCD and PM implantation. Common-variant GWAS were performed in ten collaborating studies with genotyped and imputed data, and rare variant burden testing was performed for the same phenotypes in two studies with whole-exome sequencing. The results were combined in meta-analyses, including up to 1.3 million individuals for GWAS and 471k individuals for rare variant association testing. For common variant loci reaching genome-wide significance, follow-up evaluations included analyses of cardiac gene expression profiles, predicted transcriptomes, pleiotropic associations, genetic correlations, Mendelian randomization (MR), polygenic risk scores (PRS) derivation and relations with risk of PM implantation and phenome-wide association study (PheWAS). The interaction of rare variants and polygenic risk was further evaluated.
Fig. 2
Fig. 2. Manhattan plot for bradyarrhythmias.
ac, GWAS results are shown separately for SND (a; n = 1,258,554), DCD (b; n = 1,314,957) and PM implantation (c; n = 1,304,231). Two-sided P values (on −log10 scale) for each association test between variants and bradyarrhythmias from fixed-effect meta-analyses of multi-ancestry individuals are shown on the y axis. Genome-wide significant association loci (P < 5 × 10−8 after Bonferroni correction; dashed line) are annotated with the name of the gene closest to the index variant.
Fig. 3
Fig. 3. Associations of polygenic risk scores for bradyarrhythmias with outcomes in unrelated UKBB participants.
a, Cumulative incidence of PM implantation in UKBB participants stratified by PRSs for SND, DCD and PM implantation. The shaded area surrounding each line refers to the two-sided 95% CI. PRSs were constructed using the clumping and thresholding method separately for each phenotype (nvariants for SND PRS = 28, nvariants for DCD = 57 and nvariants for PM = 51). A total of 327,702 unrelated participants without a history of PM implantation at study enrollment were included in the analyses. Participants were stratified into three groups based on the tertiles of residuals of each PRS after adjustment by the first ten PCs. The statistical significance of the associations between tertiles of each PRS and PM incidence was evaluated using analysis of variance comparing a Cox proportional hazards model with only sex, age and genotyping array as predictors and Cox proportional hazards models with each PRS tertile as an additional predictor. The median follow-up time was 11.2 (Q1–Q3, 10.5–11.7) years. b, Associations of PRS residuals (after adjustment by the first ten PCs) for bradyarrhythmias with a wider set of outcomes based on the phecode system in 350,872 unrelated individuals in the UKBB. The associations were tested by logistic regression, and the P values were based on two-sided tests. Only outcomes with at least one significant association after Bonferroni correction are shown (P < 3.76 × 10−5), and significant associations are highlighted with black borders. A total of 42 outcomes were significantly associated with at least one bradyarrhythmia-related PRS. CHF, congestive heart failure; AV, atrioventricular; NOS, not otherwise specified; NEC, not elsewhere classified.
Fig. 4
Fig. 4. Causal links of bradyarrhythmias with potential causes.
ac, In each panel, a bubble plot shows results from the MR screen modeling the given bradyarrhythmia as the outcome, using the weighted median method. a, Results for SND. b, Results for DCD. c, Results for PM. The y axis represents the signed −log10 of the P value from the MR analysis, where each bubble represents a different disease/trait (exposure or outcome), and −log10(P) is signed by the direction of the MR effect estimate; the diseases/traits are ordered by their signed −log10(P) from high (left) to low (right). All plotted P values are two-sided. The full red and blue lines represent the Bonferroni-corrected significance level (P < 0.05/(74 × 2) tests) for a given bradyarrhythmia, while the dotted lines represent P < 0.01. Traits/diseases reaching two-sided Bonferroni significance in the weighted median screen are annotated with their names; traits/diseases annotated in bold with a red or blue color also passed all subsequent filters and reached significance using CAUSE (Methods), while traits/diseases annotated in black passed MR–Egger intercept filtering (two-sided P > 0.025) but showed only a nominal association using CAUSE (one-sided P < 0.05); traits/diseases annotated with smaller font in gray either failed MR–Egger intercept filtering (P < 0.025) or showed no evidence of causality using CAUSE (one-sided P > 0.05). BMI, body mass index; SBP, systolic blood pressure; CAD, coronary artery disease.
Fig. 5
Fig. 5. Rare-variant association tests.
ac, Gene-level results from rare variant burden tests are shown separately for SND (a; n = 460,813), DCD (b; n = 471,469) and PM implantation (c; n = 464,692). Two-sided Cauchy P values (on −log10 scale) from fixed-effect meta-analysis for each gene are shown on the y axis. Dashed lines indicate exome-wide significance thresholds (P < 2.7 × 10−6 after Bonferroni correction). Significant associations are presented in red, and gene names are annotated.
Fig. 6
Fig. 6. PM implantations in carriers of protein-disrupting variants among 305,633 unrelated UKBB participants.
a, Proportion of unrelated UKBB participants with PM implantations at study enrollment or during follow-up in participants who were carriers of a protein-disrupting variant (a LOF variant or a missense variant predicted to be pathogenic by at least 80% of bioinformatics tools) in any of the five genes (LMNA, SCN5A, MYBPC3, SMAD6 and TTN) that were significantly associated with at least one bradyarrhythmia phenotype in rare variant association tests. b, Proportion of participants with PMs in participants who were carriers of protein-disrupting variants in each gene mentioned above. c, Proportion of participants with PMs among carriers of protein-disrupting variants (right) and noncarriers (left), stratified by the tertiles of a PRS for PM implantation adjusted by the first ten PCs. The error bars in ac correspond to binomial 95% CIs calculated using the Agresti–Coull method. Two-sided P values for the PRS were derived with logistic regression using PM implantation as the outcome and the PRS tertiles, sex and age at study enrollment as predictors. Numbers in parentheses are the total sample sizes in genetic categories.
Extended Data Fig. 1
Extended Data Fig. 1. Heritability enrichment for bradyarrhythmias in nine major cell types from human heart.
Results of stratified LD score regression (s-LDSC) on the combined major cell types in heart. One-sided P values were derived by testing for GWAS heritability enrichment near cell-type-specific genes controlling for an annotation based on SNPs near any gene and 52 additional baseline annotations from s-LDSC. Dashed lines show statistical (red, with Bonferroni correction) and nominal (blue, P = 0.05) significant P-value thresholds.
Extended Data Fig. 2
Extended Data Fig. 2. The layered Cauchy combination pipeline in rare variant studies of bradyarrhythmia, as applied for each gene.
a, Birds-eye view of the pipeline as applied to each transcript of a given gene. As shown on the far left, we defined 9 ‘transcripts’ that were defined as (1) all exons; (2) canonical gene transcripts as determined by Ensemble; (3) aortic expressed transcripts, formed by variants with aortic-specific pext values ≥ 0.8; (4) atrial appendage-expressed transcripts; (5) left ventricle-expressed transcripts; (6) coronary artery-expressed transcripts; (7) tibial artery-expressed transcripts; (8) whole blood-expressed transcripts; and (9) mean transcript expression across GTEx tissues. For each of the defined gene transcripts, burden-testing P values based on LOF variant masks were combined into a single P value using the Cauchy distribution test; burden-testing P values based on various missense masks were combined into a single P value using the Cauchy distribution test; and all LOF + missense burden P values were combined into a single P value using the Cauchy distribution test. Then the LOF, missense and LOF + missense P values were combined into a single transcript P value using the Cauchy distribution test. This approach was repeated across the different transcripts, after which the various transcript P values were finally combined into a single P value for the gene–phenotype association using the Cauchy distribution test. All P values are two-sided. b, Schematic showing in more detail the various frequency and annotation filters used within the pipeline for a given transcript. Mainly, two frequency filters were applied (MAF < 0.1% and MAF < 0.001%), and 11 different annotation filters were used (1 annotation for LOF variants and 5 for missense variants). The cutoffs for missense variants are based on the proportion of bioinformatic tools that predict a deleterious effect for the given missense variant.

References

    1. Greenspon, A. J. et al. Trends in permanent pacemaker implantation in the United States from 1993 to 2009: increasing complexity of patients and procedures. J. Am. Coll. Cardiol.60, 1540–1545 (2012). - PubMed
    1. Khurshid, S. et al. Frequency of cardiac rhythm abnormalities in a half million adults. Circ. Arrhythm. Electrophysiol.11, e006273 (2018). - PMC - PubMed
    1. Celestino-Soper, P. B. et al. Evaluation of the genetic basis of familial aggregation of pacemaker implantation by a large next generation sequencing panel. PLoS ONE10, e0143588 (2015). - PMC - PubMed
    1. Benson, D. W. et al. Congenital sick sinus syndrome caused by recessive mutations in the cardiac sodium channel gene (SCN5A). J. Clin. Invest.112, 1019–1028 (2003). - PMC - PubMed
    1. Veldkamp, M. W. et al. Contribution of sodium channel mutations to bradycardia and sinus node dysfunction in LQT3 families. Circ. Res.92, 976–983 (2003). - PubMed

Substances

LinkOut - more resources