. 2025 Mar;20(3):411-420.
doi: 10.1038/s41565-024-01830-y. Epub 2025 Jan 2.

Measuring age-dependent viscoelasticity of organelles, cells and organisms with time-shared optical tweezer microrheology

Affiliations

Measuring age-dependent viscoelasticity of organelles, cells and organisms with time-shared optical tweezer microrheology

Frederic Català-Castro et al. Nat Nanotechnol. 2025 Mar.

Erratum in

Abstract

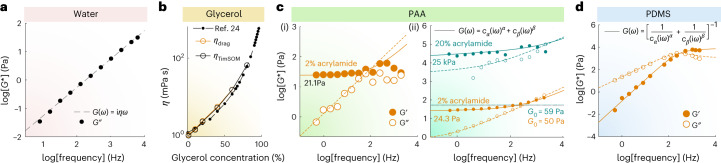
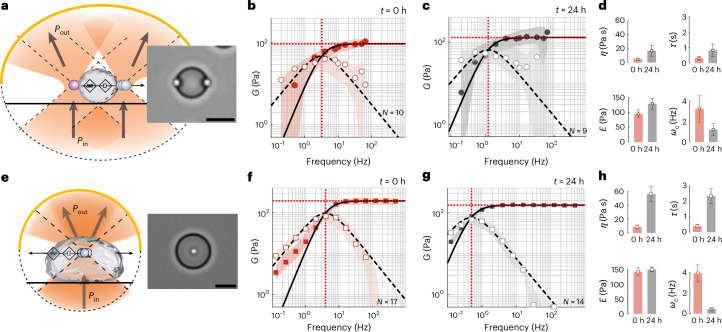
Quantifying the mechanical response of the biological milieu (such as the cell's interior) and complex fluids (such as biomolecular condensates) would enable a better understanding of cellular differentiation and aging and accelerate drug discovery. Here we present time-shared optical tweezer microrheology to determine the frequency- and age-dependent viscoelastic properties of biological materials. Our approach involves splitting a single laser beam into two near-instantaneous time-shared optical traps to carry out simultaneous force and displacement measurements and quantify the mechanical properties ranging from millipascals to kilopascals across five decades of frequency. To create a practical and robust nanorheometer, we leverage both numerical and analytical models to analyse typical deviations from the ideal behaviour and offer solutions to account for these discrepancies. We demonstrate the versatility of the technique by measuring the liquid-solid phase transitions of MEC-2 stomatin and CPEB4 biomolecular condensates, and quantify the complex viscoelastic properties of intracellular compartments of zebrafish progenitor cells. In Caenorhabditis elegans, we uncover how mutations in the nuclear envelope proteins LMN-1 lamin A, EMR-1 emerin and LEM-2 LEMD2, which cause premature aging disorders in humans, soften the cytosol of intestinal cells during organismal age. We demonstrate that time-shared optical tweezer microrheology offers the rapid phenotyping of material properties inside cells and protein blends, which can be used for biomedical and drug-screening applications.


Conflict of interest statement

Competing interests: P.-A.F. is a holder of the US patent no. WO/2022/171898 protecting the time-shared optical tweezer microrheology technique71. X.S. is a cofounder of Nuage Therapeutics. All the remaining authors declare no competing interests.

Figures

Fig. 1
Fig. 1. TimSOM.
a, Schematic of TimSOM with direct light momentum sensing of optical forces. A single laser beam is time shared at 25 kHz between a driving (1) and a static detection (2) trap. The driving trap (orange) oscillates around the trapped particle, whereas the static trap (light orange, dashed line) monitors the particle position as xp = F2/k. For clarity, only the spring for the driving trap was indicated, noting that both traps have the same spring constant. The optical force acting onto the probe particle corresponds to the addition of forces exerted by the two traps: F = F1 + F2, which are obtained as F1,2 = αV1,2, where α is the volt-to-piconewton conversion factor of a single, direct light momentum force sensor. b, Time-sharing position and force measurement sequence. Although trap 2 remains motionless at the optical axis to detect bead displacements through the BFP interferometry, trap 1 applies an active sinusoidal perturbation with amplitude A at the time-sharing frequency fTS. The schematic on the bottom represents the deflection of the laser beam by the trapped particle for the driving (orange) and static (grey) traps. The orange (black) arrow indicates the optical (material) force acting onto the bead for the driving trap. c, Force profile acquired by sweeping the trap across a 1 µm polystyrene microsphere embedded in the cytoplasm of a zebrafish cell. The shaded area indicates that the force is linear with displacement over the amplitude of the rheology routine. The blue dotted line is F = kx. dg, Quantitative description of bead motion in TimSOM. Simulation of the instantaneous position (i) of the probe particle in water using the FDE method (A = 100 nm; f = 625 Hz; k = 50 pN µm–1; water viscosity, η = 10−3 Pa s) and the resulting instantaneous optical force acting onto the probe (ii, dashed line) (d). Interleaved force values for the static and driving traps, sampled at fTS/2 = 12.5 kHz with a delay of 33 µs (Supplementary Text 2), are indicated as the orange and grey circles, respectively. The inset in (i) shows the time-sharing properties of the driving (trap 1) and static (trap 2) traps with the rise time of 10 µs. In (iii), the probe position and total force are shown. Response function derived from the FDE simulation (orange circles) with the parameters indicated in the top left and experimental data acquired in a zebrafish progenitor cell (green circles) using the time-shared microrheology routine (e). The solid lines show the expected, ideal behaviour of a fractional Kelvin–Voigt material. The inset shows the complex shear modulus. The dashed box indicates high frequencies with expected deviations due to the non-simultaneous measurement of stress and strain. Analytical pipeline to retrieve G modulus from the deviated measurements and/or FDE simulations (f). Response function (χ′, storage; χ″, loss) of the ideal scenario (theoretical), the time-shared simulations (FDE) and the compensated data points (FHA) for a single springpot (i), fractional Maxwell model (ii) and fractional Kelvin–Voigt (iii) model (g). The parameters used for the simulation are indicated in each panel and the legend is indicated on the right. Source data
Fig. 2
Fig. 2. TimSOM correctly measures known viscoelastic materials.
a, Representative experimental data of the G* modulus for water obtained from TimSOM compensated using Supplementary Equation (46). The dashed line indicates the fit to the data. b, Viscosity of different glycerol mixtures extracted from TimSOM (orange circles) and the classical drag force method (black circle). Viscosity was obtained from a linear fit to the averaged force values obtained for a series of triangles with different velocities (Extended Data Fig. 2a). The closed circles are the known references taken from ref. . c, Rheological spectra of different PAA gels. Real (solid circles) and imaginary part (open circles) of the G modulus derived from the creep compliance force-clamp measurement (J(t)G^(ω)) on a 2% PAA gel (i). The solid or dashed line represents a fit of the data to the Fractional Kelvin–Voigt model with a low-frequency elastic modulus of Cα = 21.1 ± 8.83 Pa (mean ± confidence interval of 95%). TimSOM measurements on two different gels with varying stiffness values (ii). The orange gel is the exact same one as that in panel (i). The filled (open) circles correspond to the real (imaginary) part. The solid (dashed) lines are the real (imaginary) part of the fractional Kelvin–Voigt model, as specified in the legends. For the PAA gel, using the TimSOM method, we get Cα = 24.3 ± 1.28 Pa (confidence interval of 95%). The mint-coloured dots and lines correspond to a 20% acrylamide gel. The modulus is indicated in the figure, together with the trap stiffness G0 that was used to measure each gel. d, Representative raw data of the G modulus for PDMS obtained through equations (1a) and (1b), compensated using the FHA method (Supplementary Equation (46)). The filled (open) circles correspond to the real (imaginary) part. The solid (dashed) lines are the real (imaginary) part of the model specified in the legends. Source data
Fig. 3
Fig. 3. Viscoelastic properties of BMCs.
ad, Schematic (a) and snapshot of an MEC-2/UNC-89 protein droplet measured with a pair of optically trapped polyethylene-glycol-terminated microspheres in a dual optical trap. Scale bar, 10 µm. Pin and Pout define the light momentum before and after interacting with the trapped microsphere (Supplementary Video 1). b,c, Storage (G′(ω), filled circles) and loss (G″(ω), open circles) moduli measured in the dual optical trap at t = 0 h (b) and t = 24 h (c) after condensate formation. The solid and dashed lines are the real and imaginary parts of the G modulus, derived from a fit of the Maxwell model to the acquired data. The circles and shadows are the median and ±25% quantiles measured for N = 10 (b) and N = 9 (c) droplets. d, Variation in the fitting parameters showing the changes in dynamic viscosity η (Pa s), stiffness E (Pa), time constant τ = η/E (s) and crossover frequency ωc = 1/τ (Hz) over 24 h condensate maturation in the dual optical trap. The mean and standard deviation derived from the fits in b and c. eh, Schematic (e) and snapshot of a TimSOM experiment on MEC-2/UNC-89 protein droplet with an embedded carboxylated microbead (Supplementary Video 2). f,g, Storage (G′(ω), filled squares) and loss (G″(ω), open squares) moduli measured with TimSOM at t = 0 h (f) and t = 24 h (g) after condensate formation. The solid and dashed lines are the real and imaginary parts of the G modulus, derived from a fit of the Maxwell model to the acquired data. The squares and shadows are the median and ±25% quantiles measured for N = 17 (f) and N = 14 (g) droplets. h, Variation in the fitting parameters (dynamic viscosity η (Pa s), stiffness E (Pa), time constant τ = η/E (s) and crossover frequency ωc = 1/τ (Hz)) over 24 h extracted from the TimSOM routine. The mean and standard deviation derived from the fits in f and g. Source data
Fig. 4
Fig. 4. Cytoplasm versus nuclear rheology.
ac, Representative bright-field (i) and confocal (ii) images of a zebrafish progenitor cell stained with Hoechst (blue) to label the nucleus and expressing Lap2β-GFP (green) with a microsphere in its cytoplasm (cyto) (a), nuclear interface (i/f) (b) and inside the nucleus (nuc) (c). Frequency spectrum of the complex G modulus, indicating the storage (closed symbols) and loss (open symbols) moduli of the three corresponding compartments (iii). Scale bars, 10 µm. Supplementary Video 3 shows the complete routine. d, Stiffness (Cα) of the cytoplasm, nuclear interface and nucleoplasm for controlm F-actin depolymerization (LatA) and LMNA overexpression conditions as extracted from the fit of a fractional Kelvin–Voigt model to the rheological spectrum. The lines connect paired data points that were acquired in the same cell with the same microsphere. For control cells, the experiments were independently repeated n = 9, 9 and 3 times for cyto, i/f and nuc, respectively. For LatA, n = 7, 7 and 3 and for lamin A, n = 4, 4 and 1, respectively. P values above the brackets derived from a paired t-test. Extended Data Fig. 5 and Supplementary Table 1 show a comparison of all the other fit parameters and their P values. N is the number of cells used in the measurement. e, P values of the indicated pairwise comparison using a two-sided Mann–Whitney U-test for Cα of the cytoplasm, nuclear interface and nucleoplasm in control, LatA treatment and lamin A (LMNA) overexpression. Source data
Fig. 5
Fig. 5. Longitudinal tissue microrheology in vivo.
a, Sketch of an animal with the intestinal tissue highlighted in green and the pharynx in red. The close-up sketch shows a pair of posterior intestinal cells with lipid droplets in blue. The lipid droplets were isolated from adult animals, purified and tested under various conditions for their suitability as optical tweezer probes (b and c; Methods). For in vivo application, individual droplets were trapped to measure the rheological response of the material in its vicinity (dg). b, Refractive-index matching with varying concentrations of iodixanol. Bright-field micrograph of a lipid droplet in buffer B on the left (Methods; representative for N = 6 droplets) and in 48% of iodixanol (right; N = 12) (i). The graph shows the intensity profile along the dotted line indicated in the photograph. Scale bar, 2 µm. Force profile on a droplet in the matched conditions, for 0%, 48% and 54% of iodixanol (ii). c, Force scan across the lipid droplet for particle radius estimation (Methods). The lipid droplets vary in size from the trapping-force Rayleigh (dark red) and Mie (light red) limits. N = 2 droplets, representative for all the measurements. d, Fluorescence of GFP::lmn-1 and bright-field images demonstrating nuclear deformation with a trapped lipid droplet on contact during a tweezer experiment (i). δ indicates the deformation of the nucleus during the test, and the arrowhead points to the trapped lipid droplet. Scale bar, 2 µm. Kymograph of two consecutive step indentations of an intestinal nucleus using a lipid droplet as the force probe (ii). Force and displacement during the same step of the indentation protocol (iii). e,f, Frequency-dependent shear modulus for two different ages of wild-type (e) and age-matched (f) lem-2 mutants. The median and ±25% quantiles are represented by lines and shadows, respectively. g, Viscosity (Cβ) of the cytoplasm as extracted from the high-frequency component derived from the fit of the fractional Kelvin–Voigt model to the rheological spectrum of day 1 and day 8 adults for four different genotypes, as indicated. The red circle indicates median ± bootstrapped 95% confidence interval. P = 0.003 derived from a non-parametric Kruskal–Wallis test, followed by a pairwise comparison using a one-sided Dunn test without adjustment, as indicated above the horizontal brackets (for details on statistics and number of measurements, see Supplementary Data Table 2 and Extended Data Fig. 10). For wild type in D1, N = 35, n = 3, m = 10; in D8, N = 35, n = 3, m = 7. For GFP::lmn-1 in D1, N = 32, n = 4, m = 9; in D8, N = 24, n = 4, m = 8. For lem-2 in D1, N = 28, n = 3, m = 8; in D8, N = 20, n = 2, m = 6. For emr-1 in D1, N = 25, n = 3, m = 10; in D8, N = 21, n = 2, m = 6. Source data
Extended Data Fig. 1
Extended Data Fig. 1. Theoretical analysis of the compensation of the G modulus extracted from TimSOM.
a-c, G moduli calculated from the response function (Eq. 1), G*=16πRχ*ω simulated through the FDE method for the (a) single springpot model, (b) the fractional Maxwell and the (c) fractional Kelvin-Voigt model. Parameters shown in the panels were used to during the FDE simulation. Source data
Extended Data Fig. 2
Extended Data Fig. 2. TimSOM accurately measures viscous and viscoelastic properties.
a, Example of a triangular trajectory (i) used to generate constant drag forces (ii) to measure the viscosity of a purely viscous material. Viscosity was obtained from a linear fit (solid line, iii) to the averaged force values obtained for a series of triangles with different velocities (orange dots, iii). The viscosities derived from different methods for increasing glycerol concentrations are plotted in Fig. 2. b, Force clamp experiment to retrieve the G modulus of a soft PAA gel. The creep motion of the trapped bead (J(t), i) upon a feedback-controlled constant force (F0 = 40 pN, ii) can be used to retrieve the frequency- dependent G modulus shown in Fig. 2. c, Fourier and frequency domain analysis of TimSOM force signals. Power spectrum obtained from the force signals of the driving (F1) and static traps (F2) during an active microrheology measurement on a 1-µm microsphere in water (i, f = 2,…, 4096 Hz) and in a 21.1 Pa PAA gel (ii f = 0.5,…, 4096 Hz). The peaks are located at the imposed driving frequencies. The signal is clearly distinguishable and larger than the background noise. Source data
Extended Data Fig. 3
Extended Data Fig. 3. Rheology of CPEB4 droplets.
a, Response function acquired on naive CPEB4 condensates immediately after formation. Thick lines correspond to the fit of the data to a fractional Maxwell model b, Rheological spectrum of CPEB4. Solid lines indicate the fit to a Maxwell model. G’, storage modulus; G”, loss modulus. Fit parameters are indicated on top of the graph: η, viscosity; E, plateau modulus; τ, relaxation time; ωc, crossover frequency. Mean ± standard deviation of N = 9 droplets (for each timepoint) acquired on three independent experiments. c, Image (representative for N = 5 droplets) of a fresh (top) and an ‘aged’ CPEB4 condensate (bottom) displaying emerging fibres indicating their solid transition. Scale bar = 5 µm. Source data
Extended Data Fig. 4
Extended Data Fig. 4. Performing the rheology routine does not induce phase lag difference in zebrafish cells.
a, b, Representative measurement of the G modulus (a) and response function (b) on a microsphere in the cytoplasm of a zebrafish embryonic cell. c, Performing the rheology routine does not induce phase lag difference. Phase lag between the position and the force oscillatory signals. In inset i, the phase lag over consecutive time windows containing 8 cycles (inset ii) is shown for the oscillation at 32 Hz. In insets iii and iv, same as in i and ii, for the oscillation at 256 Hz. d, Performing rheological routines repeatedly in the same cell with the same power does not elicit a noticeable history effect. Each curve is acquired at the indicated laser power in the same cell. Solid curve = mean; shaded area is 95% confidence interval. e, Performing rheological routines repeatedly with increasing laser power induces substantial stiffening in the cell, noticeable through an increase in Cα. N = 6 cells. Solid curve = mean; shaded area is 95% confidence interval. The value of 90 mW in cell 1 was omitted as the fit to the fKV model did not converge. For clarity and convenience, we choose to start with 70 mW which provided enough trapping strength to resist cytoplasmic motion caused by ‘circus bleb movements’ in these cells. The dotted box indicates the powers at which the measurements have been done throughout this manuscript. Source data
Extended Data Fig. 5
Extended Data Fig. 5. Active microrheology of zebrafish progenitor cells.
a, (i) Exponent α of the low-frequency component derived from the fit of the fractional Kelvin-Voigt to the rheological spectrum in Fig. 4; (ii) p-values derived from a pairwise, two-sided Mann-Whitney U-test of the indicated combinations. b, (i) Prefactor Cβ of the high-frequency component derived from the fit of the fractional Kelvin-Voigt to the rheological spectrum in Fig. 4. (ii) p-values derived from a pairwise, two-sided Mann-Whitney U-test of the indicated combinations. c, (i) Exponent β of the high-frequency component derived from the fit of the fractional Kelvin-Voigt to the rheological spectrum in Fig. 4. (ii) p-values derived from a pairwise, two-sided Mann-Whitney U-test of the indicated combinations. p-values below the graph in panels (i) derived from a two-sided, paired t-test; N indicates the number of cells measured. d, e, Rheological spectrum acquired on the cytoplas, nuclear interface and the nucleoplasm derived from (d) latrunculin A treated cells and (e) Lamin A overexpressing cells. Source data
Extended Data Fig. 6
Extended Data Fig. 6. Cytoplasmic rheology is affected by tubulin organization but unaffected by myosin II activity.
a, b, Dot plot of all four parameters extracted from a fit of the rheological spectrum to a fractional Kelvin-Voigt model comparing the cytoplasm of untreated control cells with cell treated with varying concentrations of Nocodazole (1 µM and 10 µM) to depolymerize the microtubule cytoskeleton and combined LatA/Nocodazole to interfere with actin and microtubule network; and (b) 10 µM blebbistatin to inhibit myosin II contractility. (i) Prefactor Cα indicating magnitude of the low-frequency, elastic response; (ii) Prefactor Cβ indicating magnitude of the high-frequency, viscous response; (iii) Exponent α indicating the low-frequency, solid behavior; (iv)) Exponent β indicating the high-frequency, fluid behavior. Number of independent experiments are n=9 (ctrl), 4 (1xNoc), 3 (10xNoc), 2 (10xNoc+LatA), 2 (bleb). Values close to the horizontal bracket indicate the p-value of (a) two-sided Kruskal-Wallis test with a Dunn post-hoc test for pairwise comparisons between groups with Bonferroni adjustment, and (b) unpaired, two-sided Kruskal Wallis test, comparing the two groups. In all panels, boxes indicates the central 50% of the data around the median (horizontal line), and the whisker delimit the 10th and 90th percentile. Source data
Extended Data Fig. 7
Extended Data Fig. 7. Force clamp protocol for microsphere insertion into zebrafish embryonic cell nuclei.
a, Schematics of the nuclear insertion process using the force clamp modality of the optical micromanipulation platform. A bead is brought into contact with the nucleus and a force clamp is set at F0 = 100 ~ 150 pN. During some tens of seconds, the bead creeps against the nuclear envelope, eventually breaking it and entering the nucleus. b, Example of an unsuccessful bead insertion assay. The nuclear envelope is too stiff for the optical trap to enter the nucleus. At t∿5 s, the force is set to 120 pN (top) and the trap pushes the bead against the nucleus. After t∿40 s, the force clamp is turned off. c, Example of a successful insertion. Similar to (b), a force clamp of F0 = 120 pN is initiated at t∿5 s. Around t∿25 s, the nuclear envelope breaks and the trap accelerates into the nucleus. After this, the force clamp is turned off. d, Summary for control cells (i), cells incubated with latrunculin A, (ii) and cells with lamin A overexpression (iii). Trajectories have been normalized with respect to the force setpoint as x(t)/F0. Colored traces (red: CTR; black: LatA; blue: LMNA + ) indicate successful events in which the bead gets inserted into the nucleus. Gray lines are force compliance curves that didn’t succeed in inserting the bead into the nucleus. e, Normalized creep compliance curves over the first 5 s of creep test. Solid lines are medians and shaded areas correspond to the ±25% quantiles. Note, all curves show a fast initial compliance, followed by an inflection indicating an elastic plateau. f, Representative data showing the fitting procedure. Yellow line indicates the fit, dotted lines indicate the relevance of the extracted parameters. g, Quantification of the force applied to the nucleus during the constant force experiment. Error bars represent the 95% confidence interval of the median. h-j Leading parameters extracted from the fit. (h) Restoring stiffness of the nuclear envelope; (i) resistance to deformation on short time scales and (j) resistance to deformation on long time scales. Number of measurements for control N = 15 from n = 4 independent experiments. For LatA N = 13, n = 3 and for LMNA+ N = 20, n = 4. Numbers above the brackets in panel g-j indicate the p-value derived from two-tailed pairwise comparison using a Mann-Whitney U-test on the experimental data points (grey). Violin plots represent the distribution of the bootstrapped mean value (±95% confidence interval) calculated from 5000 virtual experiments, using the experimental data as a sample to describe the population. Source data
Extended Data Fig. 8
Extended Data Fig. 8. Actin distribution in isolated progenitor cells undergoing blebbing behavior.
a, Montage of five different isolated mesendoderm progenitor cells (representative for N = 15 cells), showing dynamics of filamentous actin stained with Lifeact-GFP. Arrowhead indicates the location where the nucleus is expected. Note, how the ‘old’ cortex collapses onto the cell center and accumulates around the nucleus. Length of each sequence, t = 120 s. Scalebar=10 µm. Embryos were injected with 50 pg lifeact-GFP to visualize filamentous actin and were isolated in sphere/dome stage according to the methods described in this manuscript. Data set from ref. . b, Radial profile plot of the averaged intensity as a distance from the cell center. Arrowhead points to the nuclear location. Representative for N = 10 cells. c, Image of a zebrafish cell (representative for n = 5) stained with ER-tracker to label the endoplasmatic reticulum, Hoechst to label the nucleus to highlight the location of the bead with respect to these organelles. Scale bars=10 µm. d, Radial profile plot showing the intensity distribution of the three channels. Note, the microsphere is in contact with the nucleus, without large accumulation of ER in between, as judged from the absence of the green ER signal. e, Parameters extracted from the microrheology routine on zebrafish cells treated with 5 µg/mL BrefeldinA (BFA) and LatA for comparison to the data in Fig. 4 and Extended Data Fig. 5. P-values are indicated in the combinations, derived from a two-sided Mann-Whitney U-test. Boxes indicates the central 50% of the data around the median (horizontal line), and the whisker delimit the 10 and 90th percentile. N=number of cells measured over n independent experiments. Source data
Extended Data Fig. 9
Extended Data Fig. 9. Lipid droplets correctly measure rheological properties up to several kPa.
a, Estimation of the LD size using simulations with the Optical Tweezers Toolbox. The refractive index of the lipid droplet was considered nLD = 1.42 and that of the tissue nworm = 1.37. The numerical aperture of the laser trapping beam was approximated to 1 as the entrance pupil of our NA = 1.2 trapping objective is underfilled with a factor of 0.8. We considered radii from R = 0.1 µm to R = 2.5 µm. From the force profiles, we could measure the peak-to-peak radius, and finally obtained a look-up table from which the real radius is obtained from the estimated radius from the force scan across the LD. Insets i and ii show examples in the Rayleigh and Mie regimes, respectively. While the radius of probes in the strict Rayleigh regime degenerates and cannot be addressed, the estimated radius tends to the real radius in the Mie regime (geometrical optics). b, (i) Schematic of the experiment. Lipid droplets are isolated from C. elegans and embedded into a poly-acrylamide gel with varying crosslinker (bis-acrylamide) concentration. (ii-iv) Comparison of the rheological spectrum performed with the lipid droplets and the polystyrene microspheres, embedded into a gel with ii) 2-10 Pa, iii) 10-100 and iv) 100-1000 Pa elastic modulus. Source data
Extended Data Fig. 10
Extended Data Fig. 10. Mutations in nuclear envelope sensitize the cytoplasm of C. elegans to age-related changes in viscoelasticity.
a, b, Rheological spectrum derived from dominant-negative gfp:lmn-1 expressing animals at (a) day 1 and (b) day 8 adulthood. c, d, Rheological spectrum derived from emr-1 mutant animals at (c) day 1 and (d) day 8 adulthood. The median and ±25% quantiles are represented by lines and shadows, respectively. e, Prefactor Cα of the low-frequency component derived from the fit of the fractional Kelvin-Voigt model to the rheological spectrum in Fig. 5e, f and panels a-c above. f, Exponent α of the low-frequency component derived from the fit of the fractional Kelvin-Voigt model to the frequency spectrum. g, Exponent β of the high-frequency component derived from the fit of the fractional Kelvin-Voigt model to the frequency spectrum. Red circle indicates median bootstrapped ±95% confidence interval. P-values derived from one-sided Kruskal-Wallis followed by pairwise Dunn test without adjustment. For statistical comparison and p-values see Supplementary Table 2. Number of biological replicates (n = # of worms) and technical replicates (N = # of spectra on different intestinal cells inside the worm). Source data

Similar articles

Cited by

References

    1. Hurst, S., Vos, B. E., Brandt, M. & Betz, T. Intracellular softening and increased viscoelastic fluidity during division. Nat. Phys.17, 1270–1276 (2021).
    1. Lange, J. R. & Fabry, B. Cell and tissue mechanics in cell migration. Exp. Cell. Res.319, 2418–2423 (2013). - PMC - PubMed
    1. Mathieu, S. & Manneville, J. B. Intracellular mechanics: connecting rheology and mechanotransduction. Curr. Opin. Cell Biol.56, 34–44 (2019). - PubMed
    1. Molines, A. T. et al. Physical properties of the cytoplasm modulate the rates of microtubule polymerization and depolymerization. Dev. Cell57, 466–479.e6 (2022). - PMC - PubMed
    1. Alibert, C. et al. Multiscale rheology of glioma cells. Biomaterials275, 120903 (2021). - PubMed