. 2025 Feb;26(3):748-767.
doi: 10.1038/s44319-024-00337-w. Epub 2025 Jan 2.

E3 ligase FBXW7 suppresses brown fat expansion and browning of white fat

Affiliations

E3 ligase FBXW7 suppresses brown fat expansion and browning of white fat

Jian Yu et al. EMBO Rep. 2025 Feb.

Abstract

Thermogenic fat, including brown and beige fat, dissipates heat via thermogenesis and enhances energy expenditure. Thus, its activation represents a therapeutic strategy to combat obesity. Here, we demonstrate that levels of F-box and WD repeat domain-containing 7 (FBXW7), an E3 ubiquitin protein ligase, negatively correlate with thermogenic fat functionality. FBXW7 overexpression in fat suppresses energy expenditure and thermogenesis, thus aggravates obesity and metabolic dysfunctions in mice. Conversely, FBXW7 depletion in fat leads to brown fat expansion and browning of white fat, and protects mice from diet induced obesity, hepatic steatosis, and hyperlipidemia. Mechanistically, FBXW7 binds to S6K1 and promotes its ubiquitination and proteasomal degradation, which in turn impacts glycolysis and brown preadipocyte proliferation via lactate. Besides, the beneficial metabolic effects of FBXW7 depletion in fat are attenuated by fat-specific knockdown of S6K1 in vivo. In summary, we provide evidence that adipose FBXW7 acts as a major regulator for thermogenic fat biology and energy homeostasis and serves as potential therapeutic target for obesity and metabolic diseases.

Keywords: Brown Fat Expansion; Browning of White Fat; Obesity; Thermogenic Fat; Ubiquitination.


Conflict of interest statement

Disclosure and competing interests statement. The authors declare no competing interests.

Figures
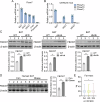
Figure 1
Figure 1. Expression patterns of FBXW7 in adipose tissues and identified FBXW7 genetic variant in human.
(A) Tissues expression profile of FBXW7. n = 6. (B) Relative mRNA levels of FBXW7 subtype (-α, -β, and -γ) in adipose tissues. n = 6. (C) Representative protein levels of FBXW7 in BAT of HFD, ob/ob and db/db mice. n = 3. (D) Representative protein levels of FBXW7 in SAT of control and obese subjects. n  = 5. (E) Association between genetic variants in the FBXW7 gene region (rs1351903, AA, wild-type, n = 1969; AG, heterozygous, n = 4093; GG, mutation, n = 2335) with Fat mass of human. Data information: All data are representative of three individual experiments. n refers to biological replicates. (C, D) Data are presented as mean ± SEM, unpaired two-tailed Student’s t-test, **p  <  0.01. (E) Box plots: centerlines show the medians; box limits indicate the 25th and 75th percentiles; whiskers extend to the minimum and maximum. One-way ANOVA followed by Dunnett’s multiple comparison test was conducted and statistical significance denoted as p = 0.0286. Source data are available online for this figure.
Figure 2
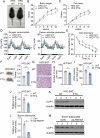
Figure 2. Fat FBXW7 overexpressed mice impaired brown fat functionality and decreased energy expenditure under HFD.
(AM) Metabolic performances of high fat diet fed WT and FBXW7-FTG mice. (AC) Morphological appearance, body weight and fat mass; scale bar represents 1 cm, n = 6. (D) Energy expenditure as shown by oxygen consumption and carbon dioxide production of mice at an ambient temperature of 22 °C, n = 5. (E) Rectal temperatures of mice during 6 h cold exposure at 4 °C, n = 6. (F) Weight of brown fat pads (BAT), scale bar represents 1 cm, n = 6. (G) Representative images of H&E staining of BAT, scale bar represents 100 μm. (H, I) Nuclei densities and genomic DNA content in BAT, n = 6. (JM) Relative mRNA and protein level of Ucp1 in BAT of WT and FBXW7-FTG mice, n = 6 and (L, M) in brown adipocytes infected with ADV-GFP or ADV-FBXW7 for 2 days, n = 3. Data information: All data are representative of three individual experiments. n refers to biological replicates. (BE) Data are presented as mean ± SEM. Two-way ANOVA followed by Sidak’s multiple comparison test was conducted and statistical significance denoted as *p  <  0.05 (B: p = 0.0408; C: p = 0.0458; D: Left panel: p < 0.0001; D: Right panel: p < 0.0001; E: p = 0.0198). (F, HJ, L), Data are presented as mean ± SEM, unpaired two-tailed Student’s t-test, **p < 0.01. Source data are available online for this figure.
Figure 3
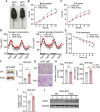
Figure 3. Fat FBXW7 deficient mice led to brown fat expansion and increased energy expenditure under HFD.
(AJ) Metabolic performances of high fat diet fed WT and FBXW7-FKO mice. (AC) Morphological appearance, Body weight and fat mass, scale bar represents 1 cm, n = 6; (D) Energy expenditure as shown by oxygen consumption and carbon dioxide production of mice at an ambient temperature of 22 °C, n = 5. (E) Rectal temperatures of mice during 6 h cold exposure at 4 °C, n = 6. (F) Weight of brown fat pads (BAT), scale bar represents 1 cm, n = 6. (G) Representative images of H&E staining of BAT, scale bar represents 100 μm. (H) Nuclei densities and genomic DNA content in BAT, n = 6. (I, J) Relative mRNA and protein level of Ucp1 in BAT of WT and FBXW7-FKO mice, n = 6. Data information: All data are representative of three individual experiments. n refers to biological replicates. (BE) Data are presented as mean ± SEM. Two-way ANOVA followed by Sidak’s multiple comparison test was conducted and statistical significance denoted as *p < 0.05 and **p < 0.01 (B: p = 0.0144; C: p = 0.0192; D: Left panel: p < 0.0001; D: Right panel: p < 0.0001; E: p = 0.0083). (FI) Data are presented as mean ± SEM, unpaired two-tailed Student’s t-test, **p < 0.01, ns: not significant. Source data are available online for this figure.
Figure 4
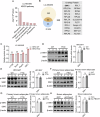
Figure 4. FBXW7 deficiency in fat enhanced ribosomal protein synthesis and S6K1 protein level.
(A, B) KEGG analysis of BAT protein in LC-MS/MS analysis of WT and FBXW7-FKO mice fed with high fat diet. (B) Venn diagram analysis of LC-MS/MS of WT and FBXW7-FKO mice and IP-MS of FBXW7 interacted proteins in FBXW7 overexpressed brown adipocytes. (C) Relative protein levels of mTOR signaling pathway in LC-MS/MS analysis, n = 2. (DH) p-S6K1 and S6K1 protein levels, as well as relative mRNA levels of S6K1 in BAT from WT, FBXW7-FKO, or FBXW7-FTG mice fed with high fat (D, E), n = 6; in primary brown adipocytes from WT, FBXW7-FKO or FBXW7-FTG mice (F, G), n = 3; in brown adipocytes infected with ADV-GFP or ADV-FBXW7 for 2 days (H), n = 3. Data information: All data are representative of three individual experiments. n refers to biological replicates. (A) KEGG enrichment analysis was performed with the R package clusterProfiler, with a Bonferroni correction and an adjusted p-value of 0.05. (CH) Data are presented as mean ± SEM, unpaired two-tailed Student’s t-test, **p < 0.01. ns: not significant. Source data are available online for this figure.
Figure 5
Figure 5. FBXW7 directly interacts with S6K1 and mediates ubiquitination of S6K1.
(A) In vitro ubiquitination of HA-S6K1 in the presence or absence of recombinant His-FBXW7 protein, E1, E2, ubiquitin, and an ATP-regeneration system. (B) Co-immunoprecipitation of Flag-FBXW7 and HA-S6K1 in 293T cells. (C) Co-Immunoprecipitation of FBXW7 and S6K1 in brown fat tissue of mice. (D) The time course of HA-S6K1 and NEDD8 levels in 293T cells stably expressing HA-S6K1 treated with MLN4924, a pan Cullin protein family inhibitor. (E) Western blot analysis of HA-S6K1 levels in 293T cells transfected with different dominant-negative (DN) Cullin family proteins. (F) Ubiquitination assay of HA-S6K1 in 293T cells with or without Flag-FBXW7 overexpression and the proteasome inhibitor MG132. (G) The time course of HA-S6K1 levels in 293T cells treated with cycloheximide (CHX) to inhibit protein synthesis, with or without Flag-FBXW7 overexpression. (H) Degradation of endogenous S6K1 by Flag-FBXW7 with or without the proteasome inhibitor MG132. Source data are available online for this figure.
Figure 6
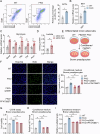
Figure 6. FBXW7 deficiency in fat promotes lactate production, which mediates brown preadipocyte proliferation.
(A) Representative cell sorting and quantification of the percentage of Sca-1+ cells from BAT SVF of WT and FBXW7-FKO mice by FACS (CD45-/CD31-), n = 3. (B) Relative mRNA level of Ki67 in BAT from WT and FBXW7-FKO mice, n = 6. (C, D) Relative mRNA level of glycolytic genes and lactate levels in BAT from WT and FBXW7-FKO mice fed with high fat diet, n = 6. (E) Representative images of co-culture experimental procedure. (F) EdU staining, scale bar represents 50 μm, n = 5; (G) cell viability, n = 3; and (H) mRNA level of Ki67 of brown preadipocytes treated with the culture medium of differentiated brown adipocytes from SVF in WT and FBXW7-FKO mice pretreated with S6K1 siRNA or S6K1 inhibitor-PF4708671 at 10 μM, n = 3. (I) Relative lactate level in the culture medium of differentiated brown adipocytes from SVF in BAT of WT and FBXW7-FKO mice pretreated with S6K1 siRNA or S6K1 inhibitor-PF4708671 at 10 μM, n = 3. Data information: All data are representative of three individual experiments. n refers to biological replicates. (AD) Data are presented as mean ± SEM, unpaired two-tailed Student’s t-test, *p < 0.05, **p < 0.01. (FI) Data are presented as mean ± SEM. One-way ANOVA followed by Dunnett’s multiple comparison test was conducted and statistical significance denoted as **p < 0.01 (F: p = 0.0002; G: p < 0.0001; H: p < 0.0001; I: p < 0.0001). Source data are available online for this figure.
Figure 7
Figure 7. S6K1 acts downstream of FBXW7 for the regulation of thermogenic fat function and obesity.
(AI) Metabolic performances of high fat diet fed WT, FBXW7-FKO mice and FBXW7 FKO + AAV-shS6K1 mice. AAV-shS6K1 and control AAV were injected both in BAT and iWAT of indicated mice and mice were fed with HFD. (AC) Morphological appearance, body weight and fat mass; scale bar represents 1 cm, n = 6. (D) Energy expenditure as shown by oxygen consumption and carbon dioxide production of mice at an ambient temperature of 22 °C, n = 5. (E) Rectal temperatures of mice during 6 h cold exposure, n = 6. (F) Weights of BAT, n = 6. (G) Representative images of H&E staining of BAT, scale bar represents 100 μm. (H) Nuclei densities and genomic DNA content in BAT, n = 6. (I) Relative mRNA level of Ucp1 in BAT of WT, FBXW7 FKO mice and FBXW7 FKO + AAV-shS6K1 mice, n = 6. Data information: All data are representative of three individual experiments. n refers to biological replicates. (BE) Data are presented as mean ± SEM. Two-way ANOVA followed by Tukey’s multiple comparison test was conducted and statistical significance denoted as *p < 0.05 and **p < 0.01 (B: p = 0.0004; C: p = 0.0058; D: Left panel: p < 0.0001; D: Right panel: p < 0.0001; E: p = 0.0235). (F, H, I) Data are presented as mean ± SEM. One-way ANOVA followed by Dunnett’s multiple comparison test was conducted and statistical significance denoted as **p < 0.01. ns: not significant (F: p < 0.0001; H: Right panel p < 0.0001; I: p < 0.0001). Source data are available online for this figure.

Similar articles

References

    1. Albert V, Hall MN (2015) mTOR signaling in cellular and organismal energetics. Curr Opin Cell Biol 33:55–66 - PubMed
    1. Balaji V, Pokrzywa W, Hoppe T (2018) Ubiquitylation pathways in insulin signaling and organismal homeostasis. Bioessays 40:e1700223 - PubMed
    1. Bartelt A, Heeren J (2014) Adipose tissue browning and metabolic health. Nat Rev Endocrinol 10:24–36 - PubMed
    1. Bartesaghi S, Hallen S, Huang L, Svensson PA, Momo RA, Wallin S, Carlsson EK, Forslöw A, Seale P, Peng XR (2015) Thermogenic activity of UCP1 in human white fat-derived beige adipocytes. Mol Endocrinol 29:130–139. - PMC - PubMed
    1. Bengoechea-Alonso MT, Ericsson J (2008) The ubiquitin ligase Fbxw7 controls adipocyte differentiation by targeting C/EBPalpha for degradation. Proc Natl Acad Sci USA 107:11817–11822. - PMC - PubMed

Substances

LinkOut - more resources