. 2025 Feb;26(3):880-907.
doi: 10.1038/s44319-024-00356-7. Epub 2025 Jan 2.

RAGE is a key regulator of ductular reaction-mediated fibrosis during cholestasis

Affiliations

RAGE is a key regulator of ductular reaction-mediated fibrosis during cholestasis

Wai-Ling Macrina Lam et al. EMBO Rep. 2025 Feb.

Abstract

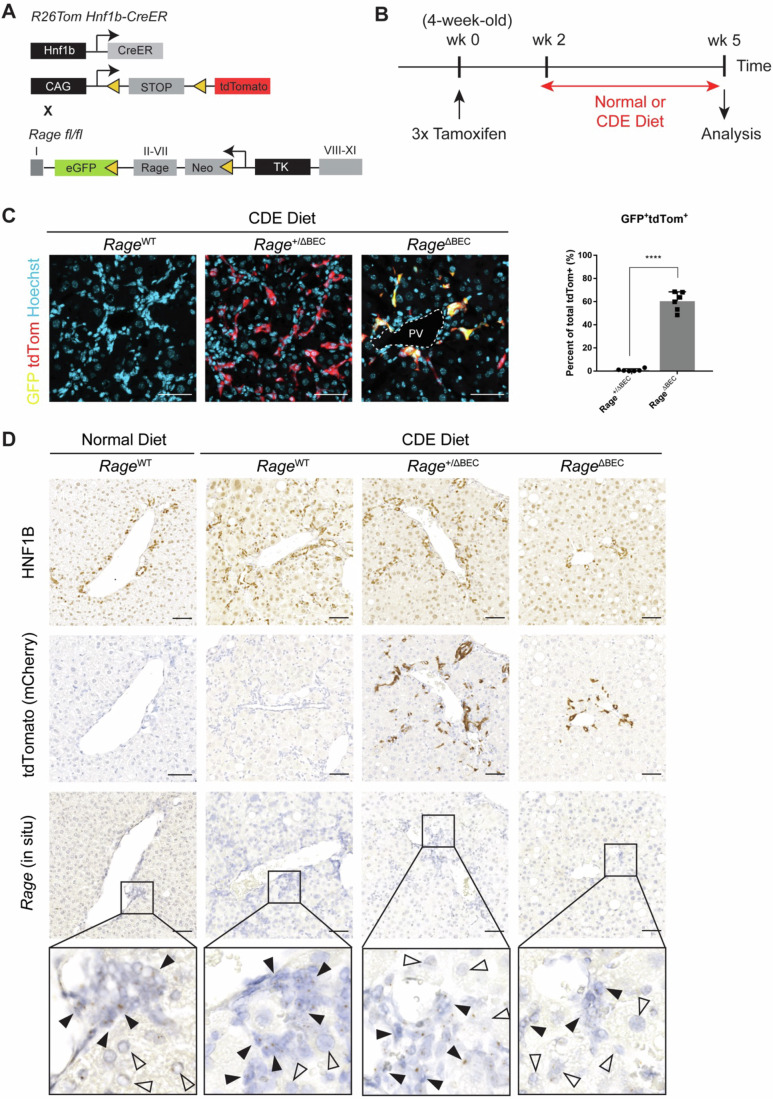
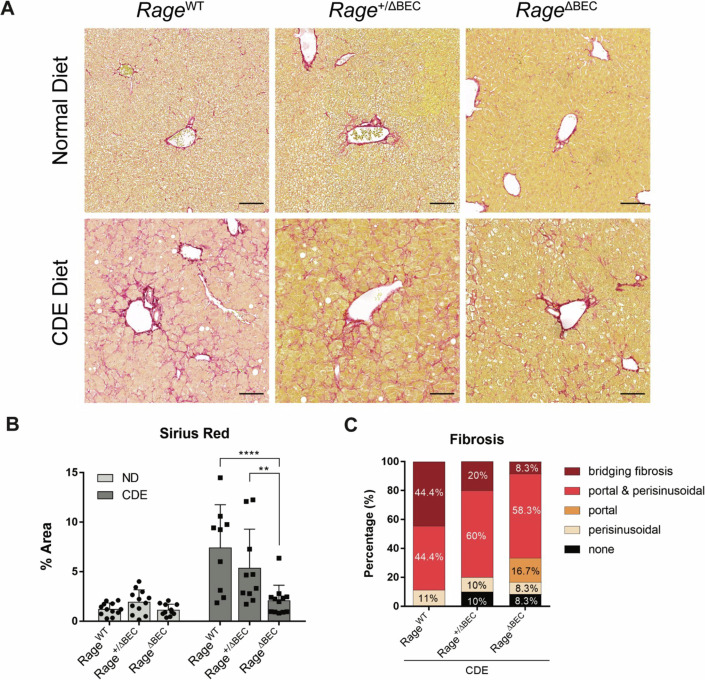
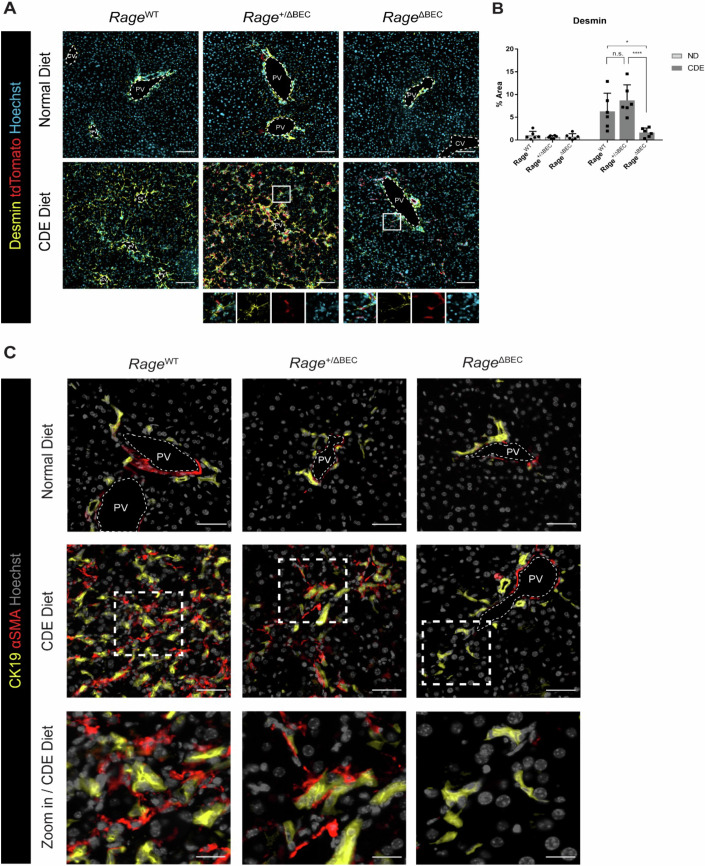
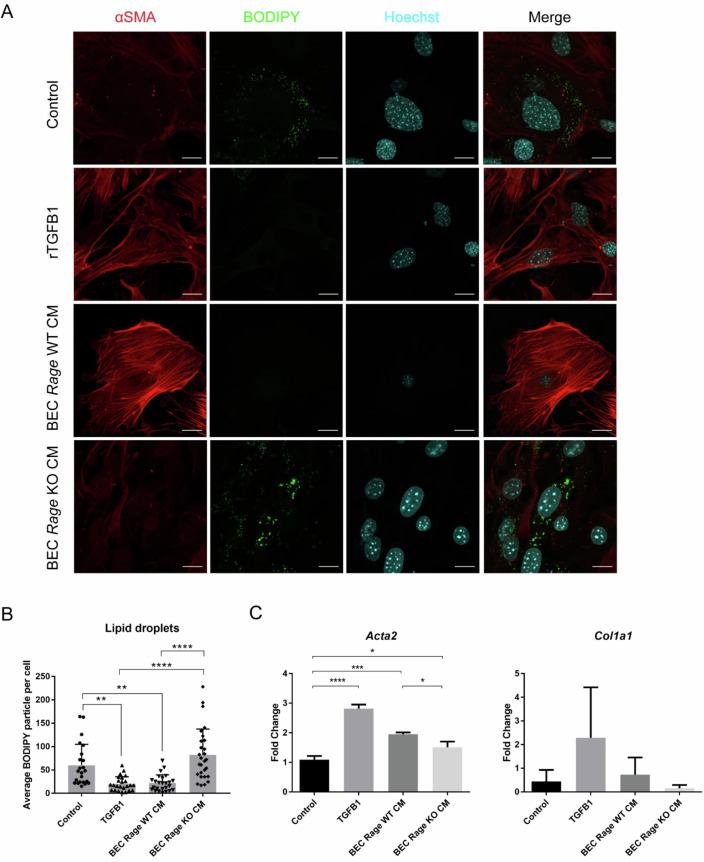
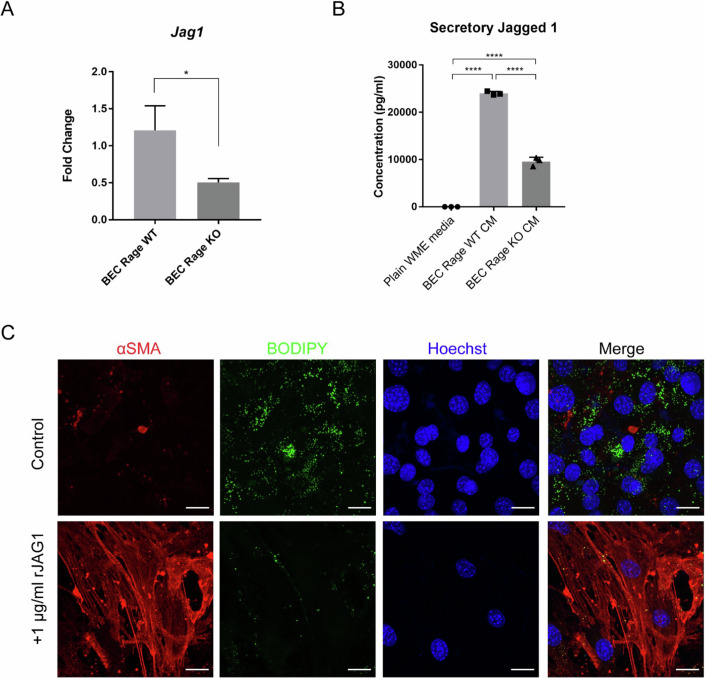
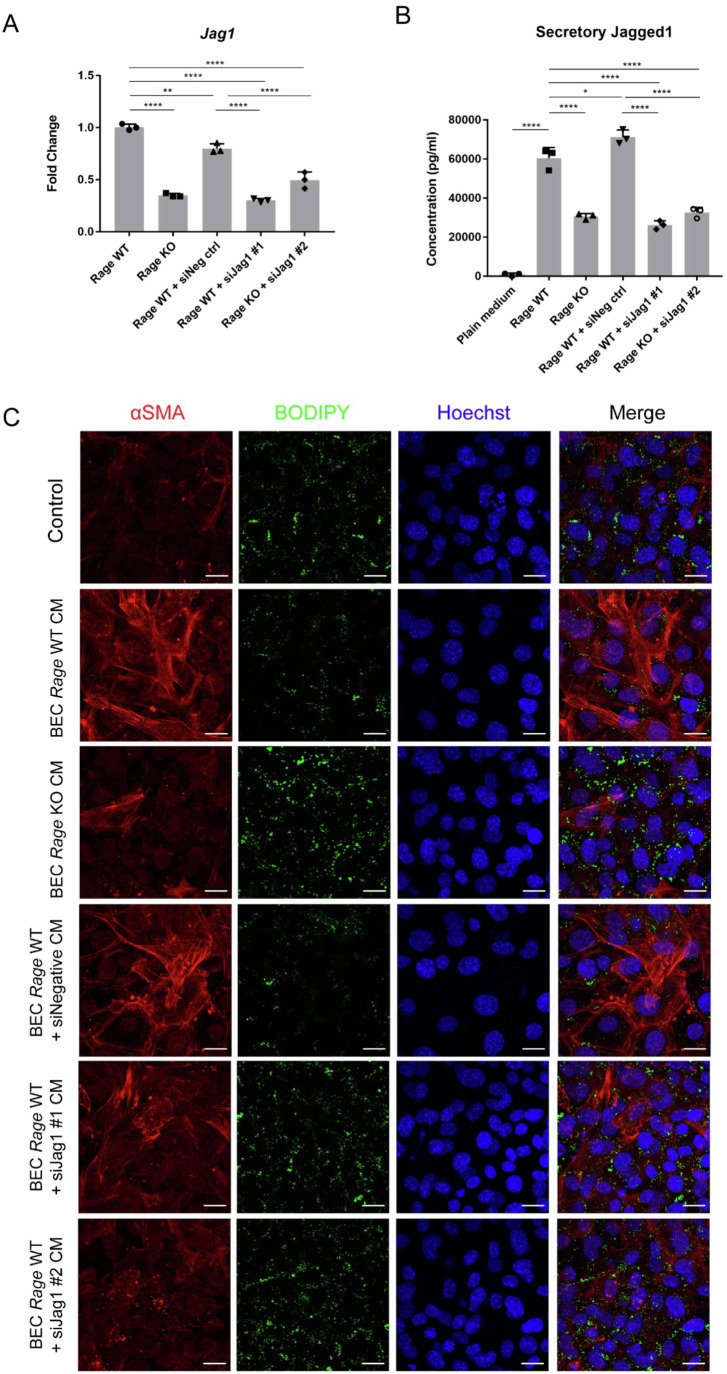
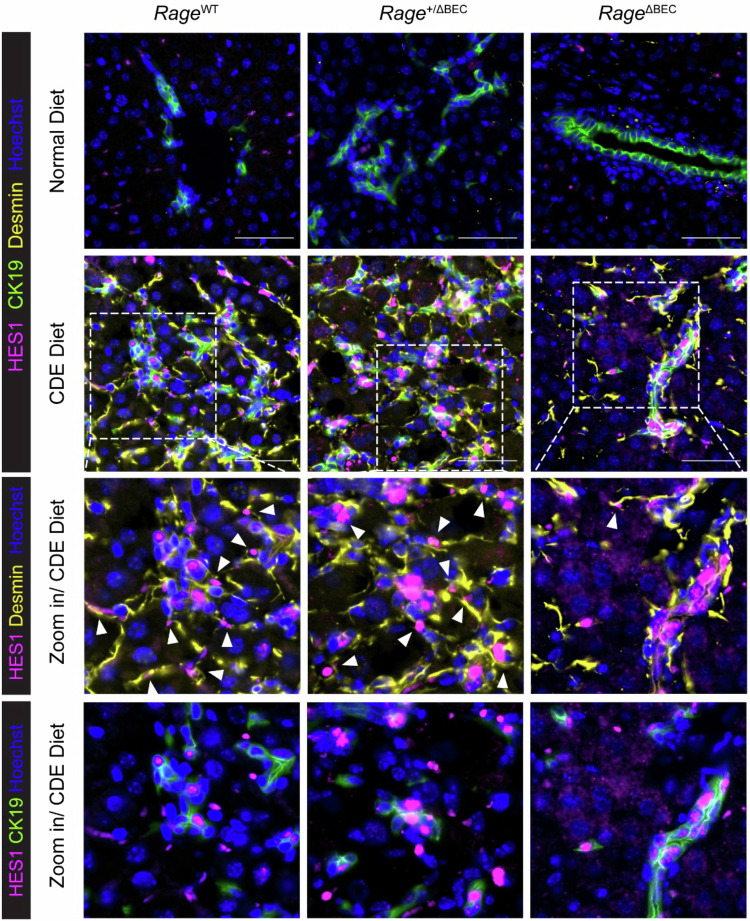
Ductular reaction (DR) is the hallmark of cholestatic diseases manifested in the proliferation of bile ductules lined by biliary epithelial cells (BECs). It is commonly associated with an increased risk of fibrosis and liver failure. The receptor for advanced glycation end products (RAGE) was identified as a critical mediator of DR during chronic injury. Yet, the direct link between RAGE-mediated DR and fibrosis as well as the mode of interaction between BECs and hepatic stellate cells (HSCs) to drive fibrosis remain elusive. Here, we delineate the specific function of RAGE on BECs during DR and its potential association with fibrosis in the context of cholestasis. Employing a biliary lineage tracing cholestatic liver injury mouse model, combined with whole transcriptome sequencing and in vitro analyses, we reveal a role for BEC-specific Rage activity in fostering a pro-fibrotic milieu. RAGE is predominantly expressed in BECs and contributes to DR. Notch ligand Jagged1 is secreted from activated BECs in a Rage-dependent manner and signals HSCs in trans, eventually enhancing fibrosis during cholestasis.

Keywords: Biliary Epithelial Cells; Chronic Liver Injury; Genetically Modified Mice; Hepatic Stellate Cells; Receptor for Advanced Glycation End Products.


Conflict of interest statement

Disclosure and competing interests statement. The authors declare no competing interests.

Figures

Figure 1
Figure 1. Conditional deletion of Rage in BECs in a CDE diet-induced injury model of cholestasis.
(A) Schematic diagram of generating a BEC-specific conditional Rage knockout mouse line. R26TomHnf1b-CreER reporter mouse was crossed with Ragefl/fl mouse that carries an eGFP reporter. (B) Schematic diagram of the experimental time line. A total of three doses of Tamoxifen was injected intraperitoneally every 3rd day into 4-week-old mice, which were subsequently kept for 2 weeks of wash-out period, followed by 3 weeks of CDE diet treatment. (C) Co-IF analysis of tdTomato and GFP staining to confirm genetic deletion of Rage in BEC in CDE-challenged mice, and quantification for tdTomato fluorescence and anti-GFP staining in CDE diet-treated R26TomHnf1b-CreER Rage+/fl (Rage+/ΔBEC) and R26TomHnf1b-CreER Ragefl/fl (RageΔBEC) mice. Data are shown as mean ± s.d. of n = 6 biological replicates per group. Two-tailed t test was used for statistical comparisons (****P < 0.0001). (D) Representative images of IHC staining of HNF1B, mCherry and in situ hybridization of Rage on consecutively sectioned liver tissues in normal diet-treated RageWT mice or CDE diet-challenged RageWT, Rage+/ΔBEC and RageΔBEC mice. ▲ indicates BECs; ∆ indicates hepatocytes. Scale bar = 50 µm. Source data are available online for this figure.
Figure 2
Figure 2. RNA-seq data reveals the pro-fibrotic role of Rage in BECs during cholestasis.
(A) Schematic diagram of the procedures to isolate primary BECs from chronically injured mice for bulk RNA-seq. (B) Representative FACS analysis of the primary BECs isolated from CDE diet-challenged RageWT, Rage+/ΔBEC and RageΔBEC mice. tdTom+ BECs from Rage+/ΔBEC mice (n = 4 independent biological replicates) and tdTom+GFP+ BECs from RageΔBEC (n = 4 independent biological replicates) were sorted for direct RNA isolation followed by RNA-seq. tdTom+ BECs were taken as Rage control group for analysis. (C) Volcano plot of differentially expressed (DE) genes (P-adjusted value < 0.05) between Rage control and knockout BECs. The integrated DESeq2 tool (version 1.22.1) utilized normalized counts to calculate the log2 fold change and assess its statistical significance using the Wald test, reported as a P value. Adjusted P values (p-adj) were calculated using the Benjamini–Hochberg correction for multiple testing. Genes with a P-adj ≤0.05 were considered differentially expressed. (D) Enriched KEGG and REACTOME pathways (P-adjusted value < 0.05) of DE genes. Pathway analysis was performed with the R packages gprofiler2 (version 0.1.8) and AnnotationDbi (version 1.44.0). The DE gene list, together with their associated log2 fold channge were used as input for the pathway analysis. (E) Top 5 enriched canonical pathways of identified by Ingenuity Pathway Analysis (IPA) and the respective DE gene list. The DE gene list, together with their associated log2 fold change and P-adj were used as input for the IPA. (F) Heatmaps of the DE genes between Rage Control and knockout BECs in the corresponding pathways associated with hepatic fibrosis/stellate cell activation and extracellular matrix organization. Color scale bar represents regularized log transformed reads. Source data are available online for this figure.
Figure 3
Figure 3. Rage deficiency in BEC ameliorates fibrosis upon CDE-induced chronic injury.
(A) Representative images showing histological Picro-Sirius Red staining (scale bar = 100 µm) and (B) corresponding quantification on liver sections from RageWT, Rage+/ΔBEC and RageΔBEC mice fed with normal diet (ND) or CDE diet. Data are shown as mean ± s.d. of biological replicates. For ND-treated RageWT (n = 12), Rage+/ΔBEC (n = 12), RageΔBEC (n = 11); and CDE-treated RageWT (n = 9), Rage+/ΔBEC (n = 10), RageΔBEC (n = 12). Two-way ANOVA with Turkey’s multiple comparisons test was used for statistical comparison. (*P = 0.0232, ****P < 0.0001). (C) Histopathological evaluation of fibrosis in CDE-challenged mice based on Picro-Sirius Red staining. For CDE-treated RageWT (n = 9), Rage+/ΔBEC (n = 10), RageΔBEC (n = 12). Source data are available online for this figure.
Figure 4
Figure 4. BECs activate stellate cells in a Rage-dependent manner in vivo.
(A) Representative images showing IF staining of portal fibroblast and stellate cell marker Desmin to assess the abundance of these cells in RageWT, Rage+/ΔBEC and RageΔBEC mice fed with normal or CDE diet. Scale bar = 100 µm. PV portal vein. (B) Quantification of percent area of Desmin staining (yellow) in (A). Data are shown as mean ± s.d. of n = 6 animals (biological replicates) per group. Two-way ANOVA with Turkey’s multiple comparisons test was used for statistical comparison. (n.s. = not significant, *P = 0.0161, ****P < 0.0001). (C) Representative images showing co-IF staining of BEC marker, CK19, and activated portal fibroblast and stellate cell marker, αSMA, in RageWT, Rage+/ΔBEC and RageΔBEC mice fed with normal or CDE diet. n = 2 animals (biological replicates) were evaluated per group. Scale bar = 50 µm for images at the top and middle row. Scale bar = 20 µm for zoom in images at the bottom row. PV portal vein. Source data are available online for this figure.
Figure 5
Figure 5. BECs activate stellate cells in a Rage-dependent manner in vitro.
Flow cytometry analysis of directly co-cultured BEC and MIM1-4HSC-mch stellate cells. (A) Representative flow cytometry gating strategy for BEC and MIM1-4HSC-mch that were directly co-cultured for 4 days. (B) Corresponding representative flow cytometry staggered histogram of α-SMA expression in BEC or MIM1-4HSC alone, or BECs that were co-cultured with MIM1-4HSC. (C) Percentage of α-SMA-low and α-SMA-high expression in MIM1-4HSC-mch when cultured alone, with Rage WT BECs or Rage KO BECs. Data are shown as mean ± s.d. of n = 4 independent experiments (biological replicates). Two-way ANOVA with Turkey’s multiple comparisons test was used for statistical comparison. For α-SMA-high populations, **P = 0.0011, MIM1-4HSC-mch alone vs. Rage WT BECs+MIM1-4HSC-mch, *P = 0.0402, Rage WT BECs+MIM1-4HSC-mch vs. Rage KO BECs+MIM1-4HSC-mch; for α-SMA-low populations, **P = 0.0011, MIM1-4HSC-mch alone vs. Rage WT BECs+MIM1-4HSC-mch, *P = 0.0377, Rage WT BECs+MIM1-4HSC-mch vs. Rage KO BECs+MIM1-4HSC-mch. BEC-EV, BEC Rage WT; BEC-Cre, BEC Rage KO; MIM1-4HSC-mch, mCherry-labeled MIM1-4HSC. Source data are available online for this figure.
Figure 6
Figure 6. BECs induce HSC activation by Rage-dependent paracrine signals.
(A) IF staining of α-SMA for myofibroblastic actin filaments and BODIPY for retinol (vitamin A)-containing lipid droplets in MIM1-4HSC that were treated with 5 ng/ml recombinant TGFB1, or conditioned medium (CM) collected from Rage WT or Rage KO BECs for 48 h. n = 3 independent experiments were performed. Scale bar = 20 µm. (B) Quantification of the number of BODIPY+ particle per cell in treated MIM1-4HSC. n = 5 independent experiments were performed. Data are shown as mean ± s.d. of five technical replicates per n = 5 independent experiments collected. One-way ANOVA with Dunnett’s multiple comparisons test was used for statistical comparison. **P = 0.0032, Control vs. TGFB1; **P = 0.0052, Control vs. BEC Rage WT CM; ****P < 0.0001, TGFB1 vs. BEC Rage KO CM, BEC Rage WT CM vs. BEC Rage KO CM. (C) mRNA expression of Acta2 or Col1a1 in treated MIM1-4HSC. Data are shown as mean ± s.d. of n = 3 independent experiments (biological replicates). One-way ANOVA with Turkey’s multiple comparisons test was used for statistical comparison. ****P < 0.0001, Control vs. TGFB1; ***P = 0.0003, Control vs. BEC Rage WT CM; *P = 0.0225, Control vs. BEC Rage KO CM; *P = 0.0179, BEC Rage WT CM vs BEC Rage KO CM. Source data are available online for this figure.
Figure 7
Figure 7. BEC-derived secretory JAG1 activates Notch signaling in HSCs.
(A) Endogenous mRNA expression of Jag1 in Rage WT and KO BECs. Data are shown as mean ± s.d. of n = 3 independent biological replicates. Two-tailed t test was used for statistical comparisons (*P = 0.0222). (B) ELISA measurement of Jagged1 in BEC basal culture medium (Control) and conditioned medium (CM) collected from Rage WT and KO BECs. Data are shown as mean ± s.d. of n = 3 independent biological replicates. One-way ANOVA with Turkey’s multiple comparison test was used for statistical comparisons (****P < 0.0001). (C) Representative images of IF staining of αSMA and BODIPY in HSCs treated with PBS control or 1 μg/ml of recombinant Jagged1 (rJAG1). n = 3 independent experiments were performed. Scale bar = 20 μm. Source data are available online for this figure.
Figure 8
Figure 8. RNAi knockdown of Jag1 in BECs augments HSC activation in trans.
(A) qPCR analysis of mRNA expression of Jag1 in Rage WT or KO BECs, or Rage WT BECs treated with siRNA negative control (siNeg Ctrl), or siJag1 clone 1 (siJag1 #1) or siJag1 clone 2 (siJag1 #2) for 72 h. Data are shown as mean ± s.d. of n = 3 independent biological replicates. One-way ANOVA with Turkey’s multiple comparison test was used for statistical comparisons. **P = 0.0015, ****P < 0.0001. (B) ELISA measurement of secretory Jagged1 in Rage WT or KO BECs, or Rage WT BECs treated with siRNA negative control (siNeg Ctrl), or siJag1 clone 1 (siJag1 #1) or siJag1 clone 2 (siJag1 #2) for 72 h. Data are shown as mean ± s.d. of n = 3 independent biological replicates. One-way ANOVA with Turkey’s multiple comparison test was used for statistical comparisons (*P = 0.0106, ****P < 0.0001). (C) IF staining of αSMA and BODIPY in HSCs treated with plain William’s E medium (control), conditioned medium (CM) collected from BEC Rage WT or KO cells, or CM collected from BEC Rage WT treated with siNeg, siJag1 #1 or siJag1 #2 for 72 h. Scale bar = 20 μm. Source data are available online for this figure.
Figure 9
Figure 9. BEC-specific RAGE activates Notch signaling in BECs and potentiates HSC activation in cholestatic mice.
Multiplex IF staining of HES1, CK19 and Desmin in RageWT, Rage+/ΔBEC and RageΔBEC mice fed with normal or CDE diet. HES1 expressed by HSCs is indicated by white arrow (third row). n = 3 independent biological replicates were performed per group. Scale bar = 50 μm. Source data are available online for this figure.
Figure EV1
Figure EV1. Co-staining of biliary markers and tdTomato-labeled biliary cells.
(A) Representative images of IF of tdTomato and CK19. (B) Representative images of IF of tdTomato and A6. Scale bar = 50 µm. For normal diet (ND)-treated mice, RageWT (n = 12), Rage+/ΔBEC (n = 12), RageΔBEC (n = 11); for CDE-treated mice, RageWT (n = 9), Rage+/ΔBEC (n = 10), RageΔBEC (n = 12) (biological replicates).
Figure EV2
Figure EV2. Rage in BEC is not involved in inflammation during cholestatic injury.
(A) Hematoxylin & Eosin (H&E) staining of liver sections from RageWT, Rage+/ΔBEC and RageΔBEC mice fed with normal or CDE diet for 3 weeks. Scale bar = 50 µm. (B, C) Histopathological evaluation of lobular inflammation and portal inflammation based on H&E staining in CDE diet-challenged mice. (D) Biochemical serum analysis of hepatic damage markers, alanine aminotransferase (ALT) and aspartate aminotransferase (AST) and (E) the marker of cholestasis, alkaline phosphatase (ALP). Data was shown as mean ± s.d. of n = 6 biological replicates per group. Two-way ANOVA with Turkey’s multiple comparisons test was used for statistical comparison (*P < 0.05, **P < 0.01, ***P < 0.001, ****P < 0.0001). (F) Histopathological evaluation of DR in RageWT, Rage+/ΔBEC and RageΔBEC mice fed with CDE diet for 3 weeks. For normal diet (ND)-treated mice, RageWT (n = 12), Rage+/ΔBEC (n = 12), RageΔBEC (n = 11); for CDE-treated mice, RageWT (n = 9), Rage+/ΔBEC (n = 10), RageΔBEC (n = 12).
Figure EV3
Figure EV3. Rage in BECs may contribute to BEC proliferation during chronic injury.
IF Staining of proliferation marker Ki67 on liver sections from RageWT, Rage+/ΔBEC and RageΔBEC mice fed with normal or CDE diet for 3 weeks. At least n = 3 animals (biological replicates) were evaluated per group. Scale bar = 50 µm for top and middle row. Scale bar = 20 µm for bottom row.
Figure EV4
Figure EV4. Rage in BECs does not contribute to immune cell infiltration during cholestatic injury.
IHC staining of immune cells, including Clec4f for Kupffer cell, F4/80 for macrophages and CD68 for monocytes in RageWT, Rage+/ΔBEC and RageΔBEC mice fed with normal or CDE diet for 3 weeks. At least n = 3 animals (biological replicates) per group were evaluated. Scale bar = 100 µm.
Figure EV5
Figure EV5. Rage in BEC is not associated with steatosis upon chronic liver injury.
RageWT, Rage+/ΔBEC and RageΔBEC mice were fed with normal or CDE diet for 3 weeks. (A) Representative images of Oil Red O staining (scale bar = 50 µm) and (B) corresponding Oil Red O quantification. Data was shown as mean ± s.d. of n = 5 animals (biological replicates) per group. Two-way ANOVA with Turkey’s multiple comparisons test was used for statistical comparison. (C) Histopathological evaluation of steatosis (based on H&E staining in Fig. EV2A). Two-way ANOVA with Turkey’s multiple comparisons test was used for statistical comparison.

References

    1. Aguilar-Bravo B, Rodrigo-Torres D, Ariño S, Coll M, Pose E, Blaya D, Graupera I, Perea L, Vallverdú J, Rubio-Tomás T et al (2019) Ductular reaction cells display an inflammatory profile and recruit neutrophils in alcoholic hepatitis. Hepatology 69:2180–2195 - PMC - PubMed
    1. Akhurst B, Croager EJ, Farley-Roche CA, Ong JK, Dumble ML, Knight B, Yeoh GC (2001) A modified choline-deficient, ethionine-supplemented diet protocol effectively induces oval cells in mouse liver. Hepatology 34:519–522 - PubMed
    1. Bansal R, van Baarlen J, Storm G, Prakash J (2015) The interplay of the Notch signaling in hepatic stellate cells and macrophages determines the fate of liver fibrogenesis. Sci Rep 5:18272 - PMC - PubMed
    1. Bierhaus A, Humpert PM, Morcos M, Wendt T, Chavakis T, Arnold B, Stern DM, Nawroth PP (2005) Understanding RAGE, the receptor for advanced glycation end products. J Mol Med 83:876–886 - PubMed
    1. Boulter L, Govaere O, Bird TG, Radulescu S, Ramachandran P, Pellicoro A, Ridgway RA, Seo SS, Spee B, Van Rooijen NV et al (2012) Macrophage-derived Wnt opposes Notch signaling to specify hepatic progenitor cell fate in chronic liver disease. Nat Med 18:572–579 - PMC - PubMed

MeSH terms

Substances