. 2025 Jan;10(1):169-184.
doi: 10.1038/s41564-024-01890-9. Epub 2025 Jan 2.

Gut-liver translocation of pathogen Klebsiella pneumoniae promotes hepatocellular carcinoma in mice

Affiliations

Gut-liver translocation of pathogen Klebsiella pneumoniae promotes hepatocellular carcinoma in mice

Xueliang Wang et al. Nat Microbiol. 2025 Jan.

Abstract

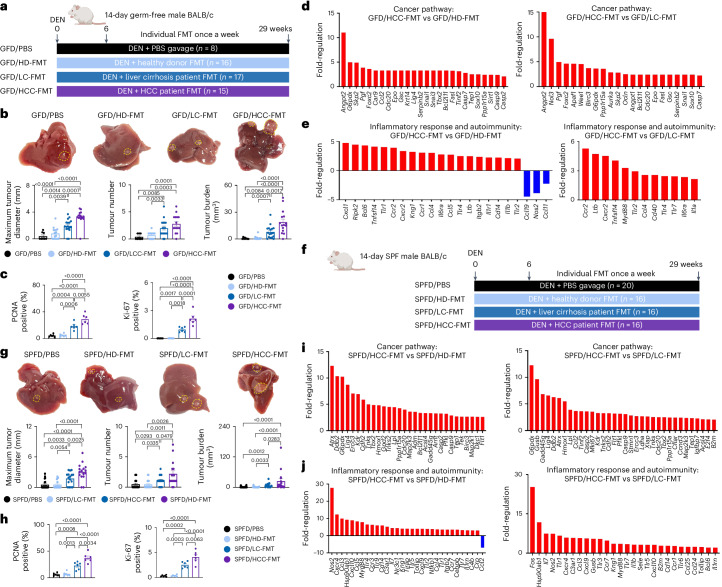
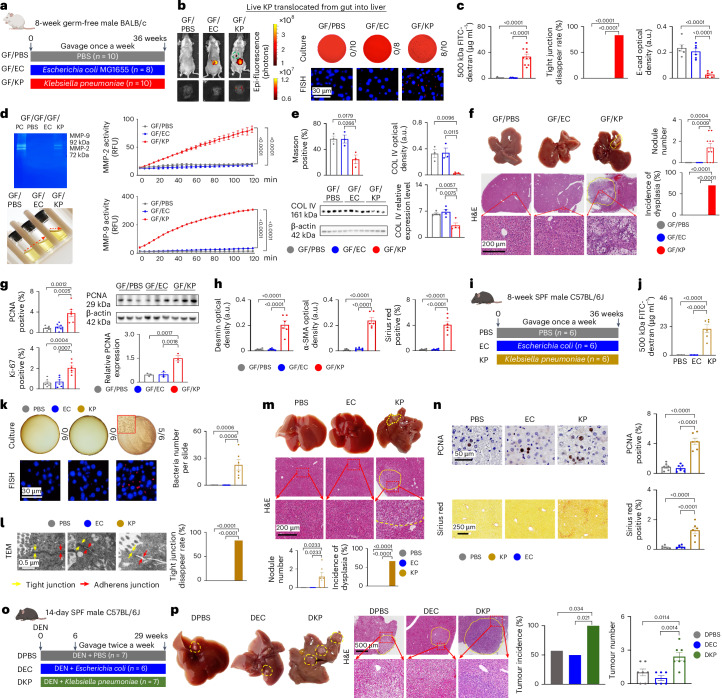
Hepatocellular carcinoma (HCC) is accompanied by an altered gut microbiota but whether the latter contributes to carcinogenesis is unclear. Here we show that faecal microbiota transplantation (FMT) using stool samples from patients with HCC spontaneously initiate liver inflammation, fibrosis and dysplasia in wild-type mice, and accelerate disease progression in a mouse model of HCC. We find that HCC-FMT results in gut barrier injury and translocation of live bacteria to the liver. Metagenomic analyses and bacterial culture of liver tissues reveal enrichment of the gut pathogen Klebsiella pneumoniae in patients with HCC and mice transplanted with the HCC microbiota. Moreover, K. pneumoniae monocolonization recapitulates the effect of HCC-FMT in promoting liver inflammation and hepatocarcinogenesis. Mechanistically, K. pneumoniae surface protein PBP1B interacts with and activates TLR4 on HCC cells, leading to increased cell proliferation and activation of oncogenic signalling. Targeting gut colonization using K. oxytoca or TLR4 inhibition represses K. pneumoniae-induced HCC progression. These findings indicate a role for an altered gut microbiota in hepatocarcinogenesis.


Conflict of interest statement

Competing interests: The authors declare no competing interests.

Figures

Fig. 1
Fig. 1. Fetal microbiota from patient with HCC promotes HCC in both germ-free and SPF mice with DEN treatment.
a, Design of FMT experiment for DEN-treated germ-free mice (GFD/PBS group n = 8; GFD/HD-FMT group n = 16; GFD/LC-FMT group n = 17; GFD/HCC-FMT group n = 15) and relevant results (be). b, Representative images of liver gross morphology (dashed yellow circles indicate tumour) with tumour incidence, tumour number and tumour burden. n = 8 (GFD/PBS), 16 (GFD/HD-FMT), 17 (GFD/LC-FMT) and 15 (GFD/HCC-FMT) mice. c, Immunohistochemistry (IHC) staining for PCNA and Ki-67. n = 6 biologically independent samples. d, Mouse cancer pathway finder array of liver tissues. e, Mouse inflammatory response and autoimmunity PCR array of liver tissues. In d and e, n = 3 independent experiments with similar results. f, Design of FMT experiment for DEN-treated SPF mice (SPFD/PBS group n = 20; SPFD/HD-FMT group n = 16; SPFD/LC-FMT group n = 16; SPFD/HCC-FMT group n = 16) and relevant results (gj). g, Representative images of liver gross morphology (yellow circles indicate tumour) with tumour incidence, tumour number and tumour burden. n = 20 (SPFD/PBS), 16 (SPFD/HD-FMT), 16 (SPFD/LC-FMT), 16 (SPFD/HCC-FMT). h, IHC staining for PCNA and Ki-67. n = 6 biologically independent samples. i, Mouse cancer pathway finder array of liver tissues. n = 3 biologically independent samples of each group were mixed for assay. j, Mouse inflammatory response and autoimmunity PCR array of liver tissues. In i and j, n = 3 independent experiments with similar results. In b,c,g,h, data are presented as mean ± s.e.m. Each data point in bar plots represents one mouse. Statistical significance was calculated using one-way ANOVA. Adjustments were made for multiple comparisons. Source data
Fig. 2
Fig. 2. Faecal microbiota from patients with HCC impairs gut barrier function and promotes bacteria translocation to the liver in germ-free mice with or without DEN treatment.
a, Quantitative analysis of TEM, Alcian blue staining, E-cad IHC staining and Cy3-conjugated EUB338 probe FISH of colon tissues. n = 6 biologically independent samples. b, Quantitative analysis of bacterial culture of liver tissues under anaerobic and aerobic conditions with quantitative analysis. n = 8 (GFD/PBS), 16 (GFD/HD-FMT), 17 (GFD/LC-FMT), 15 (GFD/HCC-FMT), 6 (GF/PBS), 12 (GF/HD-FMT), 16 (GF/HCC-FMT) mice. c, Representative TEM images of colon tissues and liver tissues in GFD/HCC-FMT mice and representative TEM image of liver tissues in GF/HCC-FMT mice. n = 3 independent experiments with similar results. d, Stacked bar plot of relative abundance of culturable bacterial strains as determined by microbial mass spectrometry identification. e, Absolute number of K. pneumoniae (KP) in human faeces (left), mice faeces (middle) and mice liver tissues (right) as detected by qPCR. n = 10 biologically independent samples. f, Representative images (left) and quantification (right) of Cy3-conjugated K. pneumoniae probe FISH detection in mice liver tissues. n = 6 biologically independent samples. In a (excluding tight junction disappear rate), b (excluding liver with living bacteria) and f, data are presented as mean ± s.e.m. Each data point in bar plots represents one mouse. Tight junction disappearance rate and liver with living bacteria were analysed using Fisher’s exact test. Unless otherwise stated, statistical significance was calculated using one-way ANOVA. Adjustments were made for multiple comparisons. Source data
Fig. 3
Fig. 3. Live bacteria, especially K. pneumoniae, are enriched in tumour tissues of patients with HCC.
a, Top: representative images of bacterial culture of liver tissues from patient with LC under anaerobic and aerobic conditions. N = 15 biologically independent samples. From left to right and top to bottom, the culture plates are blood agar plates, chocolate blood agar plates, MacConkey agar plates and Columbia blood agar plates, respectively. Bottom: Cy3-conjugated EUB338 probe FISH detection, LPS and LTA IHC staining of liver tissues from patient with LC (n = 3 independent experiments with similar results). b, Top: representative images of bacterial culture of tumour tissues from patient with HCC under anaerobic and aerobic conditions. N = 54 biologically independent samples. From left to right and top to bottom, the culture plates are blood agar plates, chocolate blood agar plates, MacConkey agar plates and Columbia blood agar plates, respectively. Bottom: Cy3-conjugated EUB338 probe FISH detection, LPS and LTA IHC staining of HCC patient liver tissues (n = 3 independent experiments with similar results). c, Stacked bar plot of relative abundance of culturable bacterial strains from liver tissues from individuals with LC or with HCC as determined by microbial mass spectrometry identification. d, Stacked bar plot of relative abundance at genus level of bacteria from liver tissues from patients with LC or HCC as detected by 16S rRNA sequencing. N = 11 (LC), 35 (HCC). e, Absolute number of K. pneumoniae in liver tissues from patient with LC and HCC as detected by qPCR. n = 10 biologically independent samples. f, Representative images of Cy3-conjugated K. pneumoniae probe FISH detection in liver tissues from patient with LC (top) and HCC (bottom). n = 10 biologically independent samples. In f, data are presented as mean ± s.e.m. Each data point in bar plots represents one participant. Statistical significance was calculated using Student’s t-test. Source data
Fig. 4
Fig. 4. K. pneumoniae initiates gut barrier dysfunction by elevating colon macrophage-mediated MMP-2/-9 activities.
a, Design of 5 Gram-negative bacteria gavage in germ-free mice without DEN (PBS group n = 6; BT group n = 6; PM group n = 6; EC group n = 6; EH group n = 6; KP group n = 6) and related results (b,c). b, Gut permeability assays using 500 kDa FITC-dextran (top), live bacteria translocated into liver cultured in blood agar plates (middle) and Cy3-conjugated EUB338 probe FISH assay of liver tissues (bottom). n = 6 biologically independent samples. c, Quantitative analysis of TEM, Alcian blue staining, E-cad, CLDN3, CLDN1 IHC staining, and Cy3-conjugated EUB338 probe FISH of colon tissues. n = 10 biologically independent samples. d, THP-1-induced macrophage using phorbol ester (top row) and MMP-2/-9 activity in K. pneumoniae and THP-induced macrophage co-culture conditional medium using gelatin hydrolysis assay and gelatin zymography (bottom row). n = 3 independent experiments with similar results. Ctrl: BHI and macrophage co-culture conditional medium; EC: E. coli and macrophage co-culture conditional medium; KP: K. pneumoniae and macrophage co-culture conditional medium. e, Design of colon macrophage depletion using Clodrosome and its effect on K. pneumoniae-mediated gut barrier dysfunction in germ-free mice without DEN treatment (PBS group n = 6; KP group n = 6; KPC group n = 6) and related results (fh). f, In vivo imaging of body and liver after Cy5.5-d-Lys-labelled K. pneumoniae gavage (top), and live bacterial culture of liver tissues on blood agar plates and quantification (bottom). n = 6 biologically independent samples. g, Gut permeability assays using 500 kDa FITC-dextran (top left) (n = 6 biologically independent samples) and MMP-2/-9 activity in mouse faecal supernatant detected using gelatin hydrolysis assay (top middle), gelatin zymography (top right) (n = 3 independent experiments with similar results) and dynamic activity assay (bottom) (n = 6 biologically independent samples). h, Quantitative analysis of TEM, Alcian blue staining, E-cad and CLDN1 IHC staining, bacteria number per slide using Cy3-conjugated EUB338 probe (PBS group) and K. pneumoniae probe (KP and KPC groups) FISH of colon tissues. n = 10 biologically independent samples. In b, c (excluding tight junction disappear rate) and fh (excluding liver with live bacteria and tight junction disappear rate) data are presented as mean ± s.e.m. Each data point in bar plots represents one mouse. Liver with living bacteria and tight junction disappearance rate were analysed using Fisher’s exact test. MMP activity was analysed using two-way ANOVA. Unless otherwise stated, statistical significance was calculated using one-way ANOVA. Adjustments were made for multiple comparisons. Source data
Fig. 5
Fig. 5. K. pneumoniae promotes precancerous lesions and HCC in both germ-free and SPF mice.
a, Design of K. pneumoniae gavage for promoting precancerous lesions in germ-free mice without DEN treatment (GF/PBS group n = 10; GF/EC group n = 8; GF/KP group n = 10) and related results (bh). b, In vivo imaging of body and liver after Cy5.5-d-Lys-labelled K. pneumoniae gavage (left), live bacteria culture of liver tissues on blood agar plate (top right) and Cy3-conjugated EUB338 probe (GF/PBS group), E. coli probe (GF/EC group) or K. pneumoniae probe (GF/KP group) FISH detection in liver tissues (bottom right). c, Gut permeability assays using 500 kDa FITC-dextran (left) (n = 10 (GF/PBS), 8 (GF/EC), 10 (GF/KP)) and quantitative analysis of TEM (middle) (n = 6 biologically independent samples) and E-cad IHC staining (right) (n = 6 biologically independent samples). d, MMP-2/-9 activity in mouse faecal supernatant using gelatin hydrolysis assay (bottom left), gelatin zymography (top left) and dynamic activity assay (right). n = 3 biologically independent samples. e, Masson’s trichrome staining (top left) and COLIV IHC staining (top right) of colon tissues and COLIV protein level by western blot (bottom). n = 6 biologically independent samples. f, Representative images of liver gross morphology (top left) (dashed yellow circles indicate nodules), H&E staining of mice liver sections (bottom left), and nodule number and incidence of dysplasia (right). n = 10 (GF/PBS), 8 (GF/EC), 10 (GF/KP). g, IHC staining for PCNA and Ki-67 (left) (n = 6 biologically independent samples), and western blot assay of PCNA (right) (n = 3 biologically independent samples). h, Desmin (left) and α-SMA (middle) IHC staining, and Sirius red staining (right) of liver sections. n = 6 biologically independent samples. i, Design of K. pneumoniae gavage on precancerous lesions in SPF mice without DEN treatment (PBS group n = 6; EC group n = 6; KP group n = 6) and relevant results (jn). j, Gut permeability assays using 500 kDa FITC-dextran. n = 6 biologically independent samples. k, Live bacterial culture of liver tissues on blood agar plate (top), and Cy3-conjugated EUB338 probe (PBS group), E. coli probe (EC group) or K. pneumoniae probe (KP group) FISH detection in liver tissues (bottom). n = 6 biologically independent samples. l, TEM (left) and quantitative analysis (right) of colon tissues. n = 6 biologically independent samples. m, Representative images of liver gross morphology (top) (dashed yellow circles indicate nodules), H&E staining of mice liver sections (middle), and nodule number and incidence of dysplasia (bottom). n = 6 biologically independent samples. n, Representative images of IHC staining for PCNA and Sirius red staining of liver sections (left) with quantitative analysis (right). n = 6 biologically independent samples. o, Design of K. pneumoniae gavage on HCC in SPF mice with DEN treatment (DPBS group n = 7; DEC group n = 6; DKP group n = 7) and related results (p). p, Representative images of liver gross morphology (left) (dashed yellow circles indicate tumour) and H&E staining of mice liver sections (middle) with tumour incidence and tumour number quantitative analysis (right). n = 7 (DPBS), 6 (DEC), 7 (DKP). In c (excluding tight junction disappear rate), d, eh (excluding incidence of dysplasia), j,k,m (excluding incidence of dysplasia), n and p (excluding tumour incidence), data are presented as mean ± s.e.m. Each data point in bar plots represents one mouse. Tight junction disappearance rate, incidence of dysplasia and tumour incidence were analysed using Fisher’s exact test. MMP activity was analysed using two-way ANOVA. Unless otherwise stated, statistical significance was calculated using one-way ANOVA. Adjustments were made for multiple comparisons. Source data
Fig. 6
Fig. 6. K. pneumoniae promotes HCC via its surface protein PBP1B binding to and activating TLR4 in HCC cells.
a, Representative SEM (top) and TEM (bottom) images of Hep3B and Huh7 HCC cell lines after co-culture with K. pneumoniae (MOI = 10). After co-culture of HCC cells with K. pneumoniae, cell lysate was spread on BHI agar for bacterial culture. n = 3 independent experiments with similar results. b, Effect of pasteurized K. pneumoniae (MOI = 10) on HCC cell proliferation (top) (n = 3 biologically independent samples), colony formation (middle) (n = 3 biologically independent samples) and growth of HCC patient-derived organoid (bottom) (n = 20 biologically independent samples). c, Effect of pasteurized K. pneumoniae (MOI = 10) on PCNA expression in HCC cells. n = 3 (Ctrl), 6 (pasteurized KP). d, Screening of K. pneumoniae adhesins by biotin pull-down assay. e, Hep3B membrane protein was incubated with GST or GST–PBP1B together with GST magnetic beads for GST pull-down assay. Corresponding bands in GST–PBP1B and Hep3B cell membrane protein groups were subjected to mass spectrometry analysis. In d and e, n = 3 independent experiments with similar results. f, Binding affinity between PBP1B and TLR4 was detected using SPR. Kd, dissociation constant. g, Representative structure of PBP1B and TLR4 after molecular docking (left) and the residues involved in the interaction between PBP1B with TLR4 (right). The structure of TLR4 is coloured pink while the PBP1B is coloured yellow. The light green dash represents hydrogen bond. h, TLR4 from Hep3B and Huh7 cell lysates was pulled down by GST–PBP1B according to the GST pull-down assay. i, Immunoprecipitation of TLR4 from Hep3B or Huh7 cells lysates validated the binding between TLR4 and GST–PBP1B. In h and i, n = 3 independent experiments with similar results. j, Effect of PBP1B (0.05 μM) on HCC cell proliferation (top) (n = 3 biologically independent samples), colony formation (middle) (n = 3 biologically independent samples) and growth of HCC patient-derived organoid (bottom) (n = 20 biologically independent samples). n = 3 independent experiments with similar results. k, Effect of PBP1B (0.05 μM) on TLR4, MyD88, p-P65, P65 and PCNA protein expression in HCC cells, as determined by western blot. n = 3 biologically independent samples. l,m, TLR4i (30 μM) abolished the effect of PBP1B on HCC cell proliferation (l) and colony formation (m). n = 3 biologically independent samples. n, Effect of K. pneumoniae on TLR4 expression in liver tissues of both germ-free and SPF mice with or without DEN treatment by IHC staining. In b,c, jm, data are presented as mean ± s.e.m. Each data point in bar plots represents one mouse. Cell proliferation was analysed using two-way ANOVA. In b,c,j,k,m, comparisons between two groups were analysed using Student’s t-test. Unless otherwise stated, statistical significance was calculated using one-way ANOVA. Adjustments were made for multiple comparisons. Source data
Extended Data Fig. 1
Extended Data Fig. 1. Mixed HCC fecal microbiota transplantation and fecal microbiota from two individual HCC patients promote hepatocarcinogenesis in DEN-treated germ-free mice.
(a) Design of mixed FMT experiment to DEN-treated germ-free mice (DEN+PBS group n=6; DEN+HD group n=12; DEN+HCC group n=11) and related results (b-d). (b) Representative images of liver gross morphology (yellow circles indicate tumors) and H&E staining of mouse liver sections (yellow circles indicate tumor areas). Tumor incidence, tumor number and the maximum tumor diameter per mice. n=6 (DEN+PBS), 12 (DEN+HD), 11 (DEN+HCC). (c) IHC staining of Ki-67 and PCNA. n=6 biologically independent samples. (d) Desmin and α-SMA IHC staining, and Sirius red staining of liver sections. n=6 biologically independent samples. (e) Design of FMT experiment to germ-free mice with DEN treatment (PBS group n=9; DEN+PBS group n=10; DEN+IHD group n=12; DEN+IHCC group n=9) and related results (f-h). (f) Representative images of liver gross morphology (yellow circles indicate tumors) and H&E staining. Tumor incidence, tumor number, and maximum tumor diameter per mouse in liver. n=9 (PBS), 10 (DEN+PBS), 12 (DEN+IHD), 9 (DEN+IHCC). (g) Ki-67 and PCNA IHC staining. n=6 biologically independent samples. (h) α-SMA and Desmin IHC staining, and Sirius red staining of mouse liver sections. n=6 biologically independent samples. Data (excluding tumor incidence) are presented as mean ± SEM. Each data point in bar plots represents one mouse. Tumor incidence was calculated using Fisher’s exact test. Unless otherwise stated, statistical significance was calculated using one-way ANOVA. Adjustments were made for multiple comparisons. Source data
Extended Data Fig. 2
Extended Data Fig. 2. Individual HCC patient fecal microbiota initiates liver precancerous lesions in germ-free mice without DEN treatment.
(a) Design of FMT experiment to germ-free mice without DEN treatment (GF/PBS group n=6; GF/HD-FMT group n=12; GF/HCC-FMT group n=16). (b) Representative images of liver gross morphology (yellow circles indicate nodules), and H&E staining of mice liver sections with incidence of dysplasia and nodules number statistical results. n=6 (GF/PBS), 12 (GF/HD-FMT), 16 (GF/HCC-FMT). (c) IHC staining for PCNA and Ki-67. n=6 biologically independent samples. (d) Hepatic infiltration of Th1, Th17, and Th2 cells was evaluated by flow cytometry. n=3 biologically independent samples. (e) Desmin and α-SMA IHC staining, and Sirius red staining of liver sections. n=6 biologically independent samples. (f) Mouse Cancer Pathway Finder Array and (g) Inflammatory Response and Autoimmunity PCR Array of liver tissues. f and g, n=3 independent experiments with similar results. Data (excluding incidence of dysplasia and PCR array results) are presented as mean ± SEM. Each data point in bar plots represents one mouse. Incidence of dysplasia was calculated using Fisher’s exact test. Unless otherwise stated, statistical significance was calculated using one-way ANOVA. Adjustments were made for multiple comparisons. Source data
Extended Data Fig. 3
Extended Data Fig. 3. Individual HCC patient fecal microbiota initiates liver precancerous lesions in SPF mice without DEN treatment.
(a) Design of FMT experiment to SPF mice without DEN treatment (SPF/PBS group n=19; SPF/HD-FMT group n=16; SPF/HCC-FMT group n=16). (b) Representative images of liver gross morphology (yellow circles indicate nodules), and H&E staining of mice liver sections. Incidence of dysplasia and number of liver nodules. n=19 (SPF/PBS), 16 (SPF/HD-FMT), 16 (SPF/HCC-FMT). (c) IHC staining for PCNA and Ki-67. n=6 biologically independent samples. (d) Desmin and α-SMA IHC staining, and Sirius red staining of liver sections. n=6 biologically independent samples. (e) Hepatic infiltration of Th1 (n=3 biologically independent samples), Th17 (n=4 biologically independent samples), and Th2 (n=3 biologically independent samples) cells was evaluated by flow cytometry. (f) Mouse Cancer Pathway Finder Array and Inflammatory Response and Autoimmunity PCR Array of liver tissues. n=3 independent experiments with similar results. Data (excluding incidence of dysplasia and PCR array results) are presented as mean ± SEM. Each data point in bar plots represents one mouse. Incidence of dysplasia was calculated using Fisher’s exact test. Unless otherwise stated, statistical significance was calculated using one-way ANOVA. Adjustments were made for multiple comparisons. Source data
Extended Data Fig. 4
Extended Data Fig. 4. Five mixed HCC fecal microbiota transplantation initiates hepatocarcinogenesis in germ-free mice without DEN treatment.
(a) Design of FMT experiment to germ-free mice (PBS group n=10; HD-FMT group n=12; HCC-FMT group n=9). (b) Representative images of liver gross morphology (yellow circles indicate nodules) and H&E staining of mice liver sections. n=10 (PBS), 12 (HD-FMT), 9 (HCC-FMT). (c) IHC staining for Ki-67 and PCNA. n=6 biologically independent samples. (d) Mouse Cancer Pathway Finder PCR Array and Inflammatory Response and Autoimmunity PCR Array of liver tissues. n=3 independent experiments with similar results. (e) Th1, Th17, and Th2 cells infiltration in liver was determined by flow cytometry. n=3 biologically independent samples. (f) α-SMA and Desmin IHC staining, and Sirius red staining of liver sections. n=6 biologically independent samples. Data (excluding incidence of dysplasia and PCR array results) are presented as mean ± SEM. Each data point in bar plots represents one mouse. Incidence of dysplasia was calculated using Fisher’s exact test. Unless otherwise stated, statistical significance was calculated using one-way ANOVA. Adjustments were made for multiple comparisons. Source data
Extended Data Fig. 5
Extended Data Fig. 5. HCC patient fecal microbiota impairs gut barrier function, induces intestinal inflammation, and promotes bacteria translocation into liver in germ-free mice with or without DEN treatment.
(a) Gut permeability assays using 500 kDa FITC-dextran, CLDN 3 and CLDN 1 IHC staining of germ-free mice without DEN. n=6 biologically independent samples. (b) Gut permeability assays using 500 kDa FITC-dextran, CLDN 3 and CLDN 1 IHC staining of germ-free mice with DEN. n=6 biologically independent samples. (c) Mouse Inflammatory Response and Autoimmunity PCR Array of colon tissues. n=3 independent experiments with similar results. (d) Colon Th1, Th17, and Th2 cells in germ-free mice without DEN was evaluated by flow cytometry. n=3 biologically independent samples. (e) Workflow of fresh liver homogenate preparation for bacteria culture. (f) PBS contamination control used in tissues bacteria culture experiment. (g) Cy3-conjugated EUB338 probe FISH detection of liver tissues. n=6 biologically independent samples. Data (excluding PCR array result) are presented as mean ± SEM. Each data point in bar plots represents one mouse. Statistical significance was calculated using one-way ANOVA. Adjustments were made for multiple comparisons. Source data
Extended Data Fig. 6
Extended Data Fig. 6. HCC patient fecal microbiota impairs gut barrier function and promotes bacteria translocation into liver in SPF mice with or without DEN treatment as shown in Fig. 1f and Extended Data Fig. 3a.
(a) Gut permeability assay using 500 kDa FITC-dextran. n=6 biologically independent samples. (b) Representative pictures of Alcian blue staining, E-Cad, CLDN 3 IHC staining, and Cy3-conjugated EUB338 probe FISH of colon tissues with quantitative analysis. n=3 biologically independent samples. (c) Representative bacterial culture of liver tissues under anaerobic and aerobic conditions with quantitative analysis. n= 19 (SPF/PBS), 16 (SPF/HD-FMT), 16 (SPF/HCC-FMT), 20 (SPFD/PBS), 16 (SPFD/HD-FMT), 16 (SPFD/LC-FMT), 16 (SPFD/HCC-FMT). From left to right and top to bottom, the culture plates are blood agar plate, chocolate blood agar plate, MacConkey agar plate, and Columbia blood agar plate, respectively. And, representative images of Cy3-conjugated EUB338 probe FISH detection in mice liver tissues. n=6 biologically independent samples. Data (excluding liver with live bacteria) are presented as mean ± SEM. Each data point in bar plots represents one mouse. Liver with live bacteria was calculated using Fisher’s exact test. Unless otherwise stated, statistical significance was calculated using one-way ANOVA. Adjustments were made for multiple comparisons. Source data
Extended Data Fig. 7
Extended Data Fig. 7. Mixed HCC fecal microbiota transplantation and fecal microbiota from two individual HCC patients impair gut barrier function and promotes bacteria translocation into liver in germ-free mice with or without DEN treatment.
(a) Gut permeability assay using FITC-dextran. n=6 (DEN+PBS), 12 (DEN+HD), 11 (DEN+HCC). (b) Representative pictures of Alcian blue staining, CLDN 3 and E-Cad IHC staining of colon tissues with quantitative analysis. n=6 biologically independent samples. (c) Representative bacterial culture of liver tissues under anaerobic and aerobic conditions with quantitative analysis. n=6 (DEN+PBS), 12 (DEN+HD), 11 (DEN+HCC). From left to right and top to bottom, the culture plates are blood agar plate, chocolate blood agar plate, MacConkey agar plate, and Columbia blood agar plate, respectively. (d) Images of Cy3-conjugated EUB338 probe detection. n=6 biologically independent samples. a–d are related to Extended Data Fig. 1a. (e) Pictures of CLDN 3 and E-Cad IHC staining, and Alcian blue staining of colon tissues with quantitative analysis. n=6 biologically independent samples. (f) Bacterial culture of liver tissues under anaerobic and aerobic conditions with quantitative analysis. n=10 (PBS), 12 (HD-FMT), 9 (HCC-FMT). From left to right and top to bottom, the culture plates are blood agar plate, chocolate blood agar plate, MacConkey agar plate, and Columbia blood agar plate, respectively. (g) Gut permeability assay using FITC-dextran and (h) Cy3-conjugated EUB338 probe detection of liver tissue. n=6 biologically independent samples. e-h are related to Extended Data Fig. 4a. (i) Pictures of Alcian blue staining, CLDN 3 and E-Cad IHC staining of colon tissues with quantitative analysis. n=6 biologically independent samples. (j) Gut permeability assay using FITC-dextran. n=9 (PBS), 10 (DEN+PBS), 12 (DEN+IHD), 9 (DEN+IHCC). (k) Bacterial culture of liver tissues under anaerobic and aerobic conditions with quantitative analysis. n=9 (PBS), 10 (DEN+PBS), 12 (DEN+IHD), 9 (DEN+IHCC). i-k are related to Extended Data Fig. 1e. Data (excluding liver with live bacteria) are presented as mean ± SEM. Each data point in bar plots represents one mouse. Liver with living bacteria was calculated using Fisher’s exact test. Unless otherwise stated, statistical significance was calculated using one-way ANOVA. Adjustments were made for multiple comparisons. Source data
Extended Data Fig. 8
Extended Data Fig. 8. K. pneumoniae initiates gut barrier dysfunction through elevating colon macrophage mediated MMP-2/-9 activities and promotes precancerous lesions in germ-free mice.
(a) Representative pictures of TEM, Alcian blue staining, E-Cad, CLDN 3, CLDN 1 IHC staining, and Cy3-conjugated EUB338 probe FISH of colon tissues related to Fig. 4c. (b) Macrophage abundance in colon was evaluated by flow cytometry related to Fig. 4e. n = 6 biologically independent samples. (c) Cy3-conjugated conjugated EUB338 probe (PBS group), K. pneumoniae probe (KP and KPC groups) FISH detection in liver tissue related to Fig. 4f. n = 6 biologically independent samples. (d) Representative pictures of TEM, Alcian blue staining, E-Cad, CLDN 1 IHC staining, and Cy3-conjugated conjugated EUB338 probe (PBS group), K. pneumoniae probe (KP and KPC groups) FISH detection of colon tissues with quantitative analysis related to Fig. 4h. (e) Representative pictures of TEM and E-Cad IHC staining of liver tissues related to Fig. 5c. Masson’s trichrome staining and COL IV IHC staining of colon tissues related to Fig. 5e. (f) Representative pictures of PCNA and Ki-67 IHC staining related to Fig. 5g. (g) Representative pictures of Desmin and α-SMA IHC staining, and Sirius red staining of liver sections related to Fig. 5h. (h) Mouse Cancer Pathway Finder Array and Mouse Inflammatory Response and Autoimmunity PCR Array of liver tissues related to Fig. 5a. n = 3 independent experiments with similar results. Data (excluding PCR array results) are presented as mean ± SEM. Each data point in bar plots represents one mouse. Statistical significance was calculated using one-way ANOVA. Adjustments were made for multiple comparisons. Source data
Extended Data Fig. 9
Extended Data Fig. 9. Antagonizing K. pneumoniae colonic colonization or TLR4 inhibition reverse K. pneumoniae induced-HCC development.
(a) Design of K. oxytoca on K. pneumoniae induced HCC promotion in germ-free mice with DEN treatment (GFD/PBS group n=6; GFD/EC group n=6; GFD/KO group n=6; GFD/KP group n=7; GFD/KOP group n=8) and relevant results (b–e). (b) Images of liver gross morphology (yellow circles indicate tumor area), and H&E with tumor incidence, tumor number and tumor burden. n=6 (GFD/PBS), 6 (GFD/EC), 6 (GFD/KO) 7 (GFD/KP), 8 (GFD/KOP). (c) Alcian blue staining, E-Cad, CLDN 3, CLDN 1 IHC, and Cy3-conjugated EUB338 probe detection with quantitative analysis. n=6 biologically independent samples. (d) Gut permeability assay using FITC-dextran. n=6 (GFD/PBS), 6 (GFD/EC), 6 (GFD/KO) 7 (GFD/KP), 8 (GFD/KOP). (e) Live bacteria culture of liver tissues on blood agar plates with quantitative analysis. n=6 (GFD/PBS), 6 (GFD/EC), 6 (GFD/KO) 7 (GFD/KP), 8 (GFD/KOP). (f) Design of TLR4i on K. pneumoniae induced HCC promotion in germ-free mice with DEN treatment (GFD/PBS group n=6; GFD/EC group n=6; GFD/KP group n=7; GFD/KPi group n=7) and relevant results (g-k). (g) Images of liver gross morphology (yellow circles indicate tumor area), and H&E with tumor incidence, tumor number and tumor burden. n=6 (GFD/PBS), 6 (GFD/EC), 7 (GFD/KP), 7 (GFD/KPi). (h) E-Cad IHC and Cy3-conjugated EUB338 probe (GFD/PBS group), E. coli probe (GFD/EC), K. pneumoniae probe (GFD/KP) and GFD/KPi groups) detection of colon tissues with quantitative analysis. n=6 biologically independent samples. (i) Gut permeability assay using FITC-dextran. n=6 biologically independent samples. (j) Live bacteria culture of liver tissues on blood agar plates with quantitative analysis. n=6 (GFD/PBS), 6 (GFD/EC), 7 (GFD/KP), 7 (GFD/KPi). (k) Cy3-conjugated conjugated EUB338 probe (GFD/PBS group), E. coli probe (GFD/EC), K. pneumoniae probe (GFD/KP) and GFD/KPi groups) FISH, TLR4, PCNA, Ki-67 IHC, and Sirius red staining of liver sections. n=6 biologically independent samples. Data (excluding tumor incidence and liver with live bacteria) are presented as mean ± SEM. Each data point in bar plots represents one mouse. Tumor incidence and Liver with live bacteria were calculated using Fisher’s exact test. Unless otherwise stated, statistical significance was calculated using one-way ANOVA. Adjustments were made for multiple comparisons. Source data
Extended Data Fig. 10
Extended Data Fig. 10. TLR4 inhibition reverses HCC-FMT induced-HCC development.
(a) Design of TLR4i on HCC-FMT induced HCC promotion in germ-free mice with DEN treatment (GFD/PBS group n=8; GFD/HCC-FMT group n=15; GFD/HCC-FMTi group n=10) and relevant results (b–g). TLR4i was daily gavaged in this experiment. (b) Representative images of liver gross morphology (yellow circles indicate tumor area), and H&E staining of mice liver sections with tumor incidence, tumor number, and tumor burden. n=8 (GFD/PBS), 15 (GFD/HCC-FMT), 10 (GFD/HCC-FMTi). (c) Representative bacterial culture of liver tissues under anaerobic and aerobic conditions with quantitative analysis. n=8 (GFD/PBS), 15 (GFD/HCC-FMT), 10 (GFD/HCC-FMTi). From left to right and top to bottom, the culture plates are blood agar plate, chocolate blood agar plate, MacConkey agar plate, and Columbia blood agar plate, respectively. Gut permeability assay using 500 kDa FITC-dextran. n=6 biologically independent samples. (d) Representative pictures of Alcian blue staining, E-Cad IHC staining, and Cy3-conjugated EUB338 probe FISH detection of colon tissues with quantitative analysis. n=6 biologically independent samples. (e) Cy3-conjugated EUB338 probe FISH, Cy3-conjugated K. pneumoniae probe FISH, TLR4, PCNA, Ki-67 IHC of liver sections. n=6 biologically independent samples. (f) α-SMA, Desmin IHC staining, and Sirius red staining of liver sections. n=6 biologically independent samples. (g) Mouse Cancer Pathway Finder Array and Inflammatory Response and Autoimmunity PCR Array of liver tissues. n=3 independent experiments with similar results. Data (excluding tumor incidence, liver with live bacteria and PCR array results) are presented as mean ± SEM. Each data point in bar plots represents one mouse. Tumor incidence and Liver with live bacteria were calculated using Fisher’s exact test. Unless otherwise stated, statistical significance was calculated using one-way ANOVA. Adjustments were made for multiple comparisons. Source data

References

    1. Sung, H. et al. Global cancer statistics 2020: GLOBOCAN estimates of incidence and mortality worldwide for 36 cancers in 185 countries. CA Cancer J. Clin.71, 209–249 (2021). - PubMed
    1. Fujiwara, N., Friedman, S. L., Goossens, N. & Hoshida, Y. Risk factors and prevention of hepatocellular carcinoma in the era of precision medicine. J. Hepatol.68, 526–549 (2018). - PMC - PubMed
    1. Behary, J. et al. Gut microbiota impact on the peripheral immune response in non-alcoholic fatty liver disease related hepatocellular carcinoma. Nat. Commun.12, 187 (2021). - PMC - PubMed
    1. Nejman, D. et al. The human tumor microbiome is composed of tumor type-specific intracellular bacteria. Science368, 973–980 (2020). - PMC - PubMed
    1. Dejea, C. M. et al. Patients with familial adenomatous polyposis harbor colonic biofilms containing tumorigenic bacteria. Science359, 592–597 (2018). - PMC - PubMed

MeSH terms

LinkOut - more resources