. 2025 Jan 2;16(1):1.
doi: 10.1007/s12672-024-01698-3.

Integrated bioinformatics analysis identifies ALDH18A1 as a prognostic hub gene in glutamine metabolism in lung adenocarcinoma

Affiliations

Integrated bioinformatics analysis identifies ALDH18A1 as a prognostic hub gene in glutamine metabolism in lung adenocarcinoma

Hao Ren et al. Discov Oncol. .

Abstract

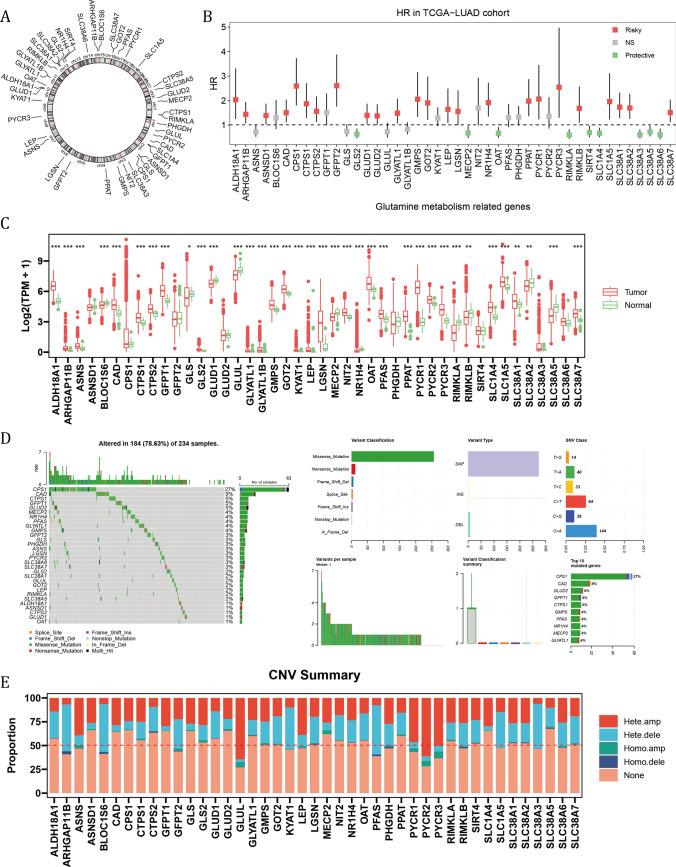
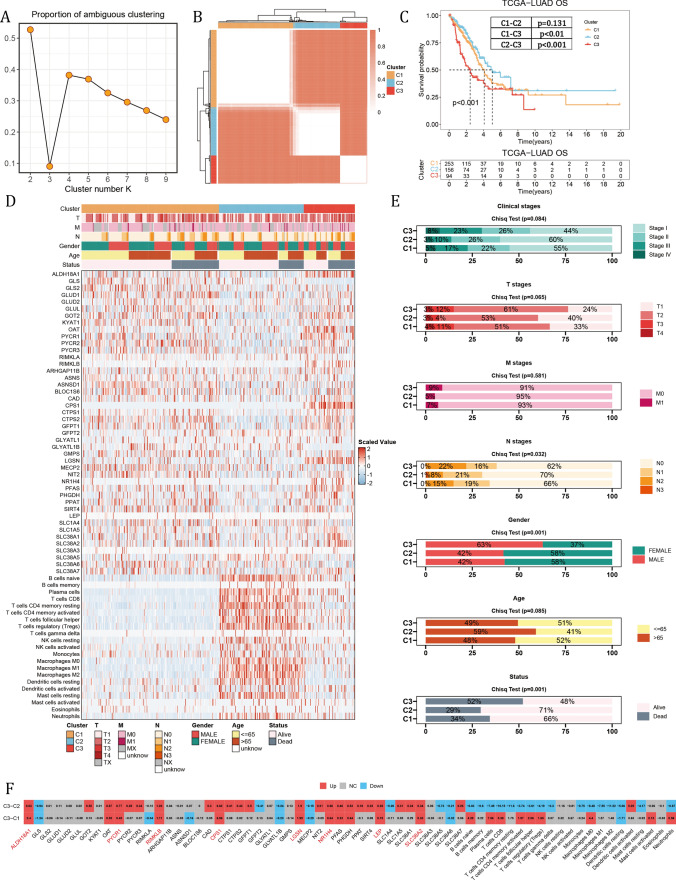
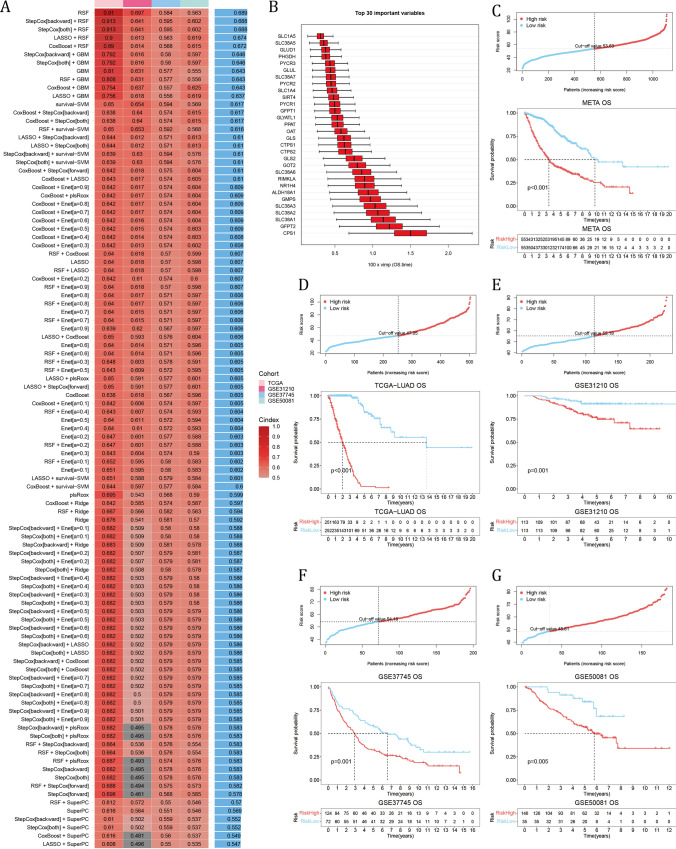
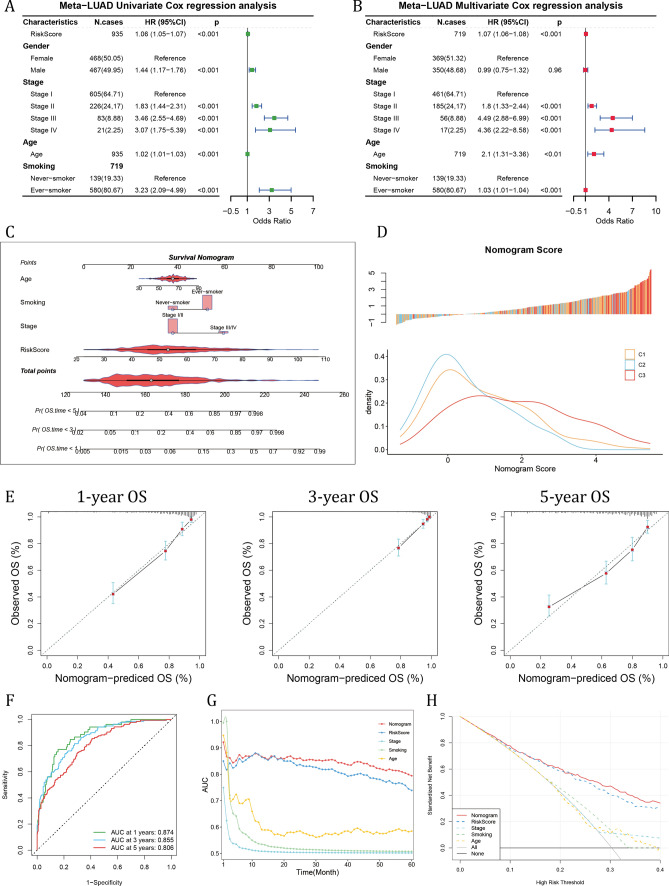
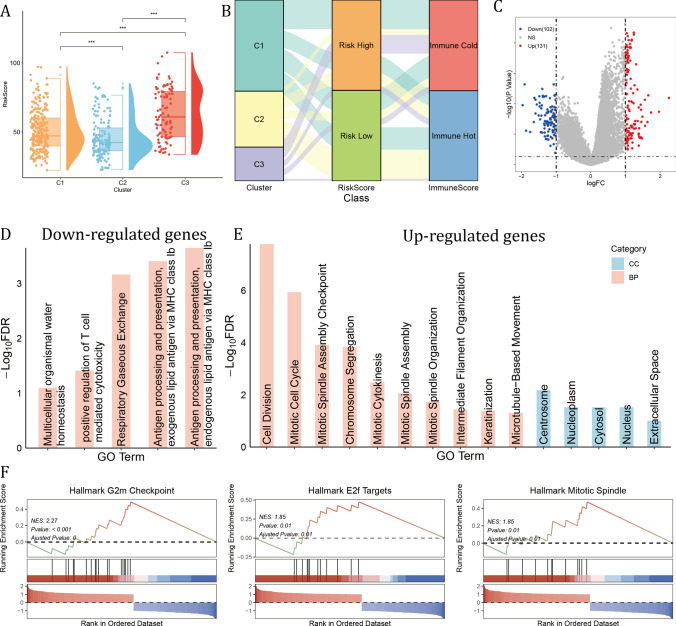
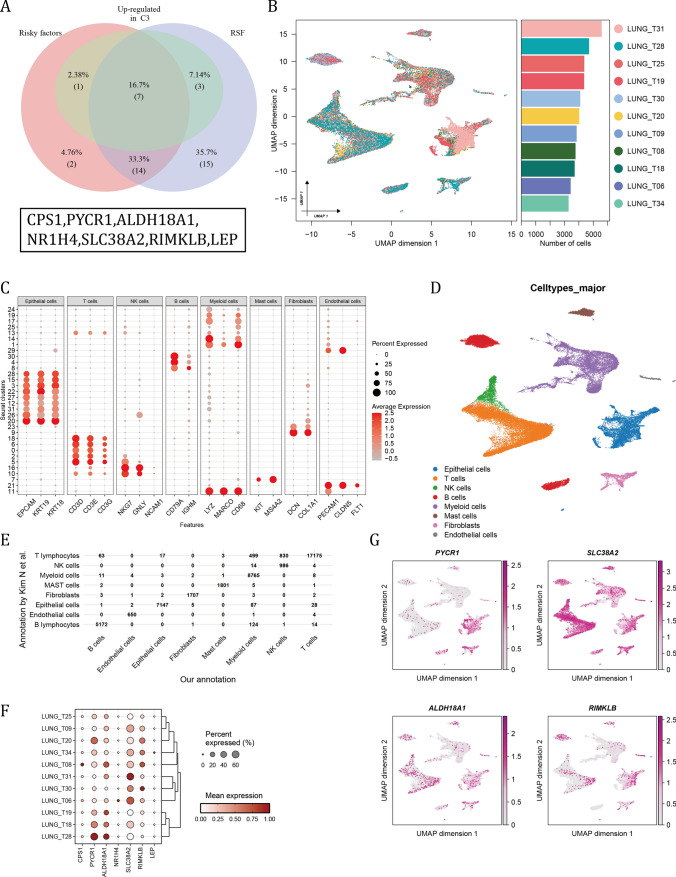
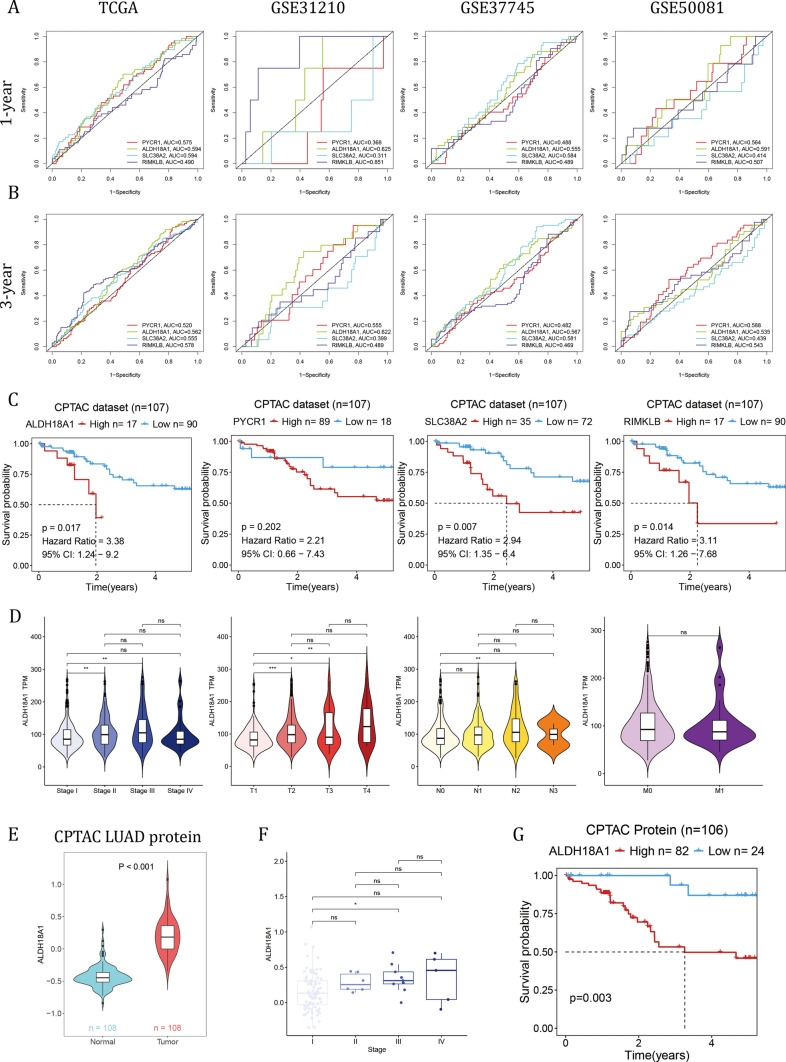
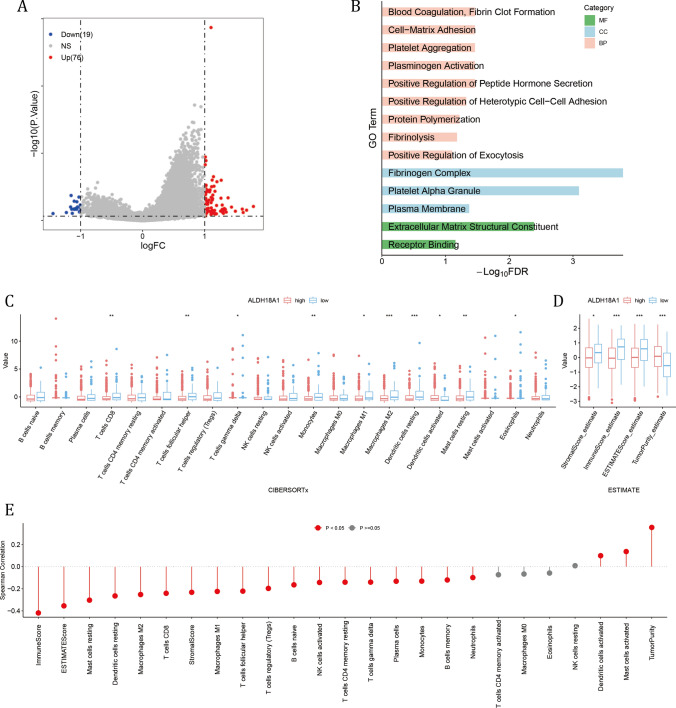
Glutamine metabolism is pivotal in cancer biology, profoundly influencing tumor growth, proliferation, and resistance to therapies. Cancer cells often exhibit an elevated dependence on glutamine for essential functions such as energy production, biosynthesis of macromolecules, and maintenance of redox balance. Moreover, altered glutamine metabolism can contribute to the formation of an immune-suppressive tumor microenvironment characterized by reduced immune cell infiltration and activity. In this study on lung adenocarcinoma, we employed consensus clustering and applied 101 types of machine learning methods to systematically identify key genes associated with glutamine metabolism and develop a risk model. This comprehensive approach provided a clearer understanding of how glutamine metabolism associates with cancer progression and patient outcomes. Notably, we constructed a robust nomogram based on clinical information and patient risk scores, which achieved a stable area under the curve (AUC) greater than 0.8 for predicting patient survival across four datasets, demonstrating high predictive accuracy. This nomogram not only enhances our ability to stratify patient risk but also offers potential targets for therapeutic intervention aimed at disrupting glutamine metabolism and sensitizing tumors to existing treatments. Moreover, we identified ALDH18A1 as a prognostic hub gene of glutamine metabolism, characterized by high expression levels in glutamine cluster 3, which is associated with poor clinical outcomes and worse survival, and is included in the risk model. Such insights underscore the critical role of glutamine metabolism in cancer and highlight avenues for personalized medicine in oncology research.


Conflict of interest statement

Declarations. Competing interests: The authors declare no competing interests.

Figures

Fig. 1
Fig. 1
The expression, clinical correlation and mutation landscape of glutamine metabolism related genes (GMRG). A The chromosomal locations of 44 GMRGs. B The hazard ratios of GMRGs compared between a given high and low GMRG groups with optimal survival cut-off. C The expression level of GMRGs compared between tumor and normal tissues. The Wilcoxon rank-sum test was used to assess statistical significance. D The mutational landscape and E copy number variation mutation landscape of GMRGs
Fig. 2
Fig. 2
Consensus clustering with GMRGs and CIBERSORTx results. A The proportion of ambiguous clustering. B The consensus clustering results. C The KM plot of three GM clusters. The Log-rank Test was used to assess statistical significance. D The summary of clinical information, GMRG expression and CIBERSORTx value among three GM clusters. E The comparison of proportion of clinical indicators among three GM clusters. The Chi-square test was used to assess statistical significance. F The differential expression of GMRGs and CIBERSORTx value of GM cluster 3 compared with cluster 1 and cluster 2. The Wilcoxon rank-sum test was used to assess statistical significance
Fig. 3
Fig. 3
Construction of the GM risk model. A Comparison of C-index among 101 machine learning models in 4 LUAD datasets. B The top 30 important variables in the RSF model. CG The cut-off risk score for each dataset (top). The KM analysis results of LUAD samples (bottom). The Log-rank Test was used to assess statistical significance
Fig. 4
Fig. 4
Validation of the efficiency of GM risk model and construction of GM risk score-based nomogram. A The univariable Cox regression and B multivariable Cox regression analyses of GM risk score together with other clinical indicators. C Construction of GM risk score-based nomogram. D The distribution of nomogram score in the TCGA-LUAD cohort in different GM clusters. E Calibration curve showed the correlation between nomogram predicted OS and actual OS at 1-, 3-, and 5-year OS. F The ROC results of nomogram in the meta-LUAD cohort. G The time-dependent AUC value of nomogram score. H The DCA results of nomogram compared with other indicators
Fig. 5
Fig. 5
GM cluster 3 samples had highest average risk score and aberrant proliferating activity. A Comparison of GM risk score among three GM clusters. The Wilcoxon rank-sum test was used to assess statistical significance. (***: p < 0.001) B Sankey plot showed the connection of GM clusters, GM risk score and Immune score by ESTIMATE. C The differentially expressed genes (DEGs) of GM cluster 3. D, E The gene ontology (GO) results of biological process (BP) and cellular component (CC) of cluster 3 DEGs. F The GSEA results of DEGs
Fig. 6
Fig. 6
Single-cell RNA data validated the GM hub genes in LUAD cancer cells. A The overlap of risky factors, up-regulated genes in cluster 3 and genes used in the RSF model. B Umap plot of the summary of the integration results of 11 LUAD samples. Boxplot showed the number of cells in each sample after quality control. (C) The expression patterns of canonical cell markers among cell clusters. D The annotated major cell types as referred to cluster markers. E Comparison of our annotation with the annotation by Kim N et al. F The relative expression of 7 GM hub genes among patients. G The expression level of 7 GM hub genes in different cell types
Fig. 7
Fig. 7
ALDH18A1 exhibited the strongest correlation with patient overall survival. A, B The ROC analysis results of four candidate hub genes at A 1-year OS and B 3-year OS in 4 LUAD datasets. C The KM analysis of ALDH18A1, PYCR1, SLC38A2 and RIMKLB at mRNA level in the CPTAC-LUAD cohort. D The correlation of ALDH18A1 with clinical stages, T, N and M. E The protein level of ALDH18A1 compared between tumor and normal tissues in the CPTAC cohort. F The correlation of ALDH18A1 protein level with clinical stages. The Wilcoxon rank-sum test was used to assess statistical significance. G The KM analysis of ALDH18A1 at protein level in the CPTAC-LUAD cohort. The Log-rank Test was used to assess statistical significance
Fig. 8
Fig. 8
High ALDH18A1 subgroup had abnormal proliferating activity and immune cold tumor microenvironment. A The DEGs between high and low ALDH18A1 subgroups. B The GO results of up-regulated DEGs in high ALDH18A1 subgroup. C, D Comparison of C CIBERSORTx results and D ESTIMATE results between two ALDH18A1 subgroups. The Wilcoxon rank-sum test was used to assess statistical significance. E The Spearman correlation results of ALDH18A1 value with CIBERSORTx and ESTIMATE results

Similar articles

Cited by

References

    1. Siegel RL, Miller KD, Fuchs HE, Jemal A. Cancer statistics, 2021. Cancer J Clin. 2021;71(1):7–33. - PubMed
    1. Bray F, Laversanne M, Sung H, Ferlay J, Siegel RL, Soerjomataram I, Jemal A. Global cancer statistics 2022: GLOBOCAN estimates of incidence and mortality worldwide for 36 cancers in 185 countries. Cancer J Clin. 2024;74(3):229–63. - PubMed
    1. Campbell JD, Alexandrov A, Kim J, Wala J, Berger AH, Pedamallu CS, Shukla SA, Guo G, Brooks AN, Murray BA, Imielinski M, Hu X, Ling S, et al. Distinct patterns of somatic genome alterations in lung adenocarcinomas and squamous cell carcinomas. Nat Genet. 2016;48(6):607–16. - PMC - PubMed
    1. Liu Y, Balagurunathan Y, Atwater T, Antic S, Li Q, Walker RC, Smith GT, Massion PP, Schabath MB, Gillies RJ. Radiological image traits predictive of cancer status in pulmonary nodules. Clin Cancer Res. 2017;23(6):1442–9. - PMC - PubMed
    1. Chen H, Chong W, Teng C, Yao Y, Wang X, Li X. The immune response-related mutational signatures and driver genes in non-small-cell lung cancer. Cancer Sci. 2019;110(8):2348–56. - PMC - PubMed

LinkOut - more resources