. 2025 Jan 2;16(1):5.
doi: 10.1038/s41467-024-54686-0.

Molecular and spatial analysis of tertiary lymphoid structures in Sjogren's syndrome

Collaborators, Affiliations

Molecular and spatial analysis of tertiary lymphoid structures in Sjogren's syndrome

Saba Nayar et al. Nat Commun. .

Abstract

Tertiary lymphoid structures play important roles in autoimmune and non-autoimmune conditions. While many of the molecular mechanisms involved in tertiary lymphoid structure formation have been identified, the cellular sources and temporal and spatial relationship remain unknown. Here we use combine single-cell RNA-sequencing, spatial transcriptomics and proteomics of minor salivary glands of patients with Sjogren's disease and Sicca Syndrome, with ex-vivo functional studies to construct a cellular and spatial map of key components involved in the formation and function of tertiary lymphoid structures. We confirm the presence of a fibroblast cell state and identify a pericyte/mural cell state with potential immunological functions. The identification of cellular properties associated with these structures and the molecular and functional interactions identified by this analysis may provide key therapeutic cues for tertiary lymphoid structures associated conditions in autoimmunity and cancer.


Conflict of interest statement

Competing interests: F.B. is an employee of Candel Therapeutics. C.D.B is the founder of Mestag Therapeutics. B.A.F. has undertaken consultancy for: Novartis, BMS, Servier, Galapagos, Roche, UCB, Sanofi, Janssen, A.Z., Otsuka, Amgen, Kiniksa and received research funding from Janssen, Servier, Galapagos, and Celgene. A.F. has consulted for Janssen and Sonoma, and has received research funding from: BMS, Roche, UCB, Nascient, Mestag, GSK, and Janssen. S.J.B. has undertaken consultancy for: Abbvie, Amgen, Argenx, Aurinia, Bain, BMS, EcoR1, Iqvia, J&J/Janssen, Kiniksa & Novartis. K.G.L. and A.P.F. are employees of F. Hoffmann-La Roche Ltd. The remaining authors declare no competing interests.

Figures

Fig. 1
Fig. 1. Cellular landscape of the minor salivary glands of SjS patients.
a Minor salivary gland (mSG) biopsy 10x single cell workflow pipeline, Created in BioRender. NAYAR, S. (2024) https://BioRender.com/l06g537. b Uniform manifold approximation and projection (UMAP) embedding of 17,011 single cells and gross-cell identities clustering of single-cell gene expression data from n = 7 Sjogren’s syndrome (SjS) salivary gland samples illustrating both immune and stromal cell clusters. c Multiplex immunofluorescence image illustrating major lineages identified in minor salivary gland tissue from Sjogren’s patients (n = 3) probed with a 6-plex panels for CD146 (green), VE-cadherin or CD20 (yellow), Pan-Cytokeratin/CK (magenta), CD138 (orange), and CD68 + CD11c (cyan), CD45 or CD8 (white), Podoplanin/PDPN+CD90 or CD3 (red) and CD4 (blue), Scale bar = 50 µm.
Fig. 2
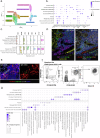
Fig. 2. Single cell resolution of fibroblast and mural cell subsets in human SjS salivary glands.
a Uniform manifold approximation and projection (UMAP) dimensional reduction and sub-clustering of fibroblast and mural cell transcriptomic data in Sjogren’s syndrome (SjS) minor salivary glands (mSG). b Expression of current identifying and newly discovered identifying genes across the fibroblast and mural subsets. c Expression of gene cassettes used to spatially identify immunofibroblast and CCL21 CCL19 pericytes in salivary glands. d Multiplex immunofluorescence image illustrating immune cells and pericytes identified in minor salivary gland tissue (n = 2) probed with a 6-plex panels for CD138 (green), CD20 or TNC (yellow), Pan-Cytokeratin/CK or CD82 (orange), VE-cadherin (cyan), Podoplanin/PDPN (white), CD3 or CD146 (red) and DAPI or CD45 (blue), Scale bar = 20 µm. e Multiplex immunofluorescence image of CD146 (grey) pericytes with ccl21rna (green), ccl19rna (red) and DAPI (blue) in immune aggregate within human salivary glands of patients (n = 2) with Sjögren’s syndrome, Scale bar = 20 µm. f Representative flow cytometric identification of CD146+TNC+ CD36+CCL21+ pericyte cell population in Sjogren’s syndrome minor salivary glands. g Gene-set overrepresentation analysis (using GO and Kegg gene sets) of the fibroblast and mural populations, the top 5 enriched gene sets for each cell subset are shown.
Fig. 3
Fig. 3. Immunofibroblasts and CCL21 CCL19 pericytes show differential dependence on signalling pathways.
a Select pathways from the gene-set overrepresentation analysis (using GO and Kegg gene sets) of fibroblast and mural populations highlighting the enrichment of interferon and TNF pathways in both immunofibroblasts and CCL21 CCL19 pericytes, and NFκB pathway enrichment restricted to immunofibroblasts. b Violin plot of expression of genes related to the enriched pathways shown in Fig. 3a across fibroblast and mural clusters. c Multiplex immunofluorescence image of ccl21rna (green), ccl19rna (red) vascular expression in DAPI (blue) and CD45+ (yellow) immune aggregate in TLS-induced salivary glands of wildtype (wt) and lymphotoxin beta receptor knockout (Ltbr–/–) mice, n = 2 per group, Scale bar = 100 µm. Ltbr–/– results in abrogation of TLS and decreased CCL19 expression within immune aggregates. Perivascular expression of CCL19 remained in the Ltβr–/–. d Flow cytometric analysis of TLS-induced salivary glands of wildtype (wt) and Ltbr–/– mice for CCL21+CD34+ immunofibroblast and CCL21+CD146+ pericytes to confirm the dependence of immunofibroblasts on LTβR signalling and CCL21 CCL19 pericyte independence. Data are mean ± s.e.m from two independent experiments with two mice analyzed per group. Number of asterisks indicate significance: *p < 0.05, Mann–Whitney test, two-tailed. e Clustering of cell type by SCENIC derived regulon activity displaying distinct clustering of the fibroblast and mural lineages. f Heatmap of the regulon activity of the top 15 regulons by activity for the fibroblast CCL19 TNFSF13B and the pericyte CCL21 CCL19 clusters.
Fig. 4
Fig. 4. Signalling pathways differentiate between key populations in Sjogren’s syndrome and Sicca syndrome.
a Volcano plot illustrating differentially expressed genes detected between pseudobulked Sjogren’s syndrome (SjS) and Sicca samples. Statistical testing completed using DESeq2 to fit a negative binomial generalised linear model with Wald test to calculate p-values and Benjamini-Hochberg method to correct for multiple comparisons. b Expression of genes related to signalling pathways and tertiary lymphoid structure formation in subsets from Sjogren’s syndrome or Sicca syndrome. c Select differentially expressed genes detected between single-cell clusters of immunofibroblasts or CCL21 CCL19 pericytes between SjS and sicca, data are plotted as z-scores of the summed aggregate of all samples for each cluster including all samples. d qPCR analysis for mRNA transcripts of IFNG, CXCL9, CCL21, CD40, CXL13, CCL19, TNFSF13B and TNFSF13B in in whole tissue RNA extracts from SjS and Sicca biopsies. mRNA transcripts were normalized to the housekeeping gene GAPDH RNA transcripts. Number of asterisks indicate significance: *p < 0.05; **p < 0.01, Mann–Whitney test, two-tailed. Data are representative as mean ± s.e.m, n = 10-15 (IFNG, CXCL9, CCL21, CD40, CXL13 and CCL19) and n = 8–10 (TNFSF13B and TNFSF13B).
Fig. 5
Fig. 5. Bulk RNA-sequencing of microdissected regions of minor salivary glands from Sjogren’s syndrome patients and control tonsil tissue.
a PCA plot of bulk-sequencing of microdissection samples. b Z-score mean expression of genes important to tertiary lymphoid organogenesis, in bulk-sequencing of microdissection data. c PCA plot of Nanostring Geomx protein expression data. d Z-score mean expression of proteins important to tertiary lymphoid organogenesis, in Nanostring Geomx data. e Cibersortx inferred cell subset proportions in the bulk sequencing samples using the single cell sequencing data as a reference atlas. Tonsil germinal center (GC) = 3, tertiary lymphoid structure germinal center (TLS GC) = 19, Segregated = 7, Non segregated = 4. Boxplots show the median, first and third quartiles, and whiskers extend to the largest value no further than 1.5 times the interquartile range.
Fig. 6
Fig. 6. Single-cell spatial proteomics to identify spatially resolved cellular and structural landscape of TLS development.
a Multiplex immunofluorescence image of salivary gland highlighting the development of immune aggregates (n = 2), Scale bar = 50 µm. b UMAP of single-cell proteomic phenotyping. c Cellular neighbourhood heatmap. d Spatial neighbourhood map (of a tertiary lymphoid structure (TLS)). e Abundance of neighbourhood 1 (CXCR5+B cell & Immunofibroblast enriched) as a function of developmental stage, data are representative as mean ± s.e.m, n = 2 per NS (non-segregated), S (segregated) and TLS developmental groups. f Multiplex immunofluorescence image of salivary gland (n = 2) highlighting key cell subsets across the development of immune aggregates, Scale bar = 20 µm.

Similar articles

Cited by

References

    1. Helmink, B. A. et al. B cells and tertiary lymphoid structures promote immunotherapy response. Nature577, 549–555 (2020). - PMC - PubMed
    1. Petitprez, F. et al. B cells are associated with survival and immunotherapy response in sarcoma. Nature577, 556–560 (2020). - PubMed
    1. Goc, J., Fridman, W.-H., Sautès-Fridman, C. & Dieu-Nosjean, M.-C. Characteristics of tertiary lymphoid structures in primary cancers. Oncoimmunology2, e26836 (2013). - PMC - PubMed
    1. Huibers, M. M. et al. The composition of ectopic lymphoid structures suggests involvement of a local immune response in cardiac allograft vasculopathy. J. Heart Lung Transpl.34, 734–745 (2015). - PubMed
    1. Nayar, S. et al. Immunofibroblasts are pivotal drivers of tertiary lymphoid structure formation and local pathology. Proc. Natl Acad. Sci.116, 13490–13497 (2019). - PMC - PubMed

Publication types

MeSH terms

Associated data