. 2025 Jan 2;16(1):267.
doi: 10.1038/s41467-024-55021-3.

π-PrimeNovo: an accurate and efficient non-autoregressive deep learning model for de novo peptide sequencing

Affiliations

π-PrimeNovo: an accurate and efficient non-autoregressive deep learning model for de novo peptide sequencing

Xiang Zhang et al. Nat Commun. .

Abstract

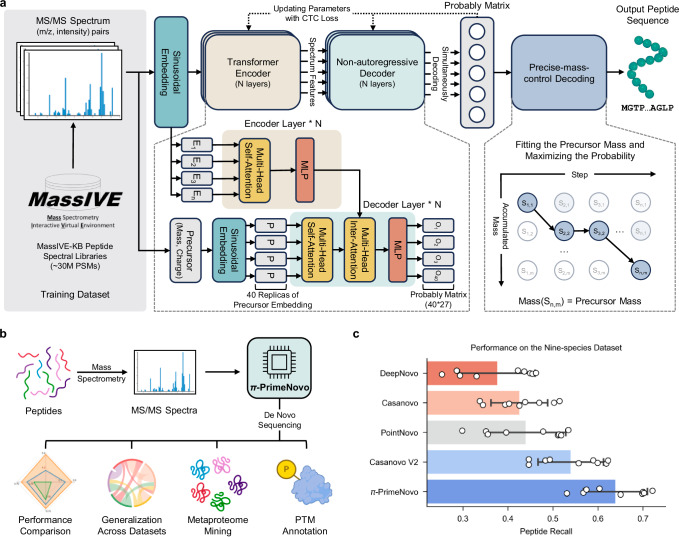
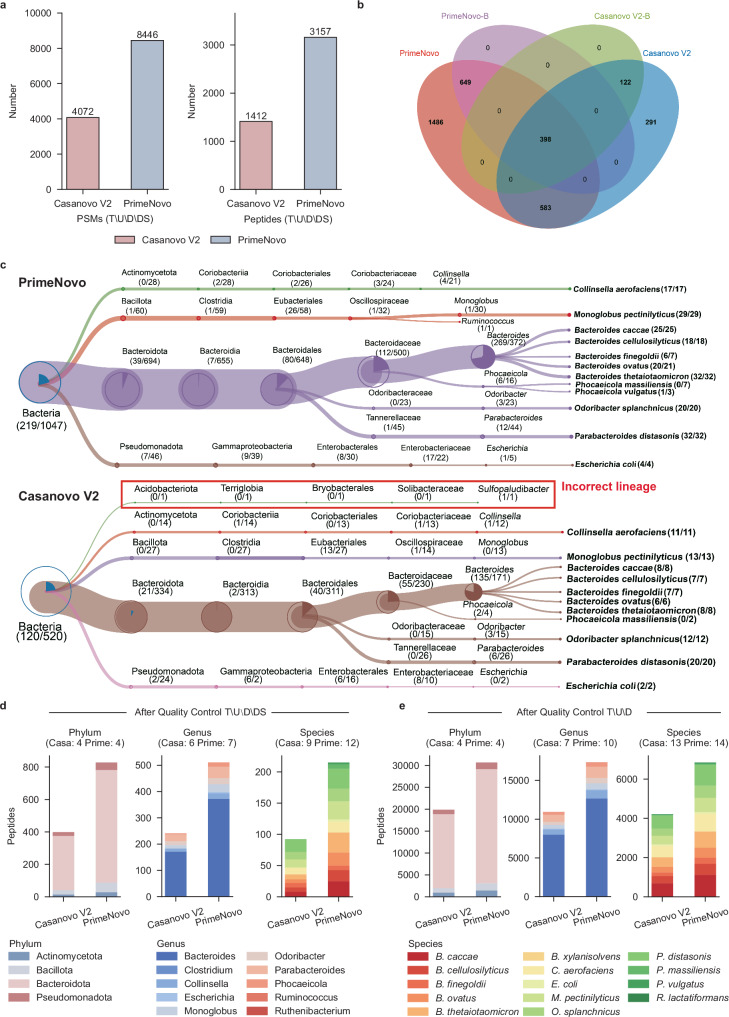
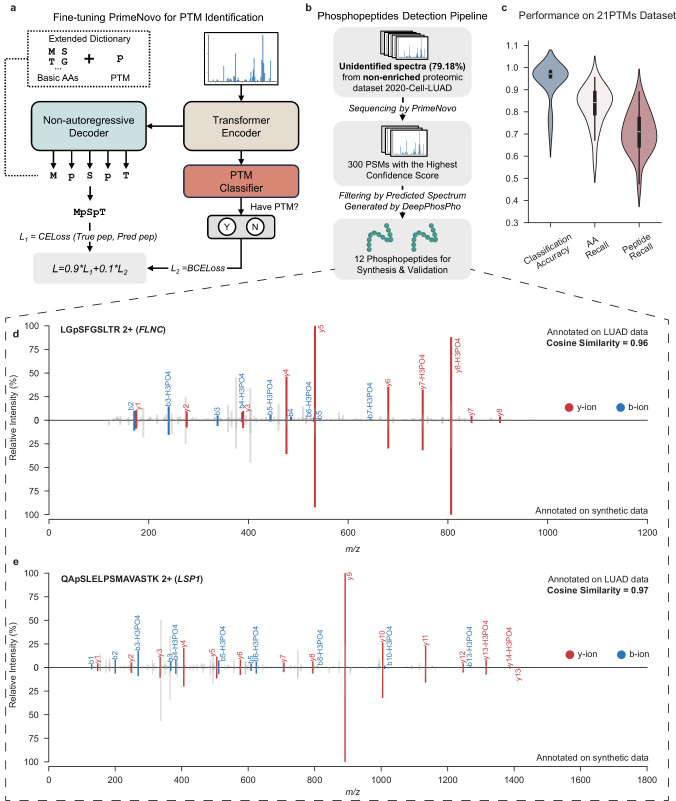
Peptide sequencing via tandem mass spectrometry (MS/MS) is essential in proteomics. Unlike traditional database searches, deep learning excels at de novo peptide sequencing, even for peptides missing from existing databases. Current deep learning models often rely on autoregressive generation, which suffers from error accumulation and slow inference speeds. In this work, we introduce π-PrimeNovo, a non-autoregressive Transformer-based model for peptide sequencing. With our architecture design and a CUDA-enhanced decoding module for precise mass control, π-PrimeNovo achieves significantly higher accuracy and up to 89x faster inference than state-of-the-art methods, making it ideal for large-scale applications like metaproteomics. Additionally, it excels in phosphopeptide mining and detecting low-abundance post-translational modifications (PTMs), marking a substantial advance in peptide sequencing with broad potential in biological research.


Conflict of interest statement

Competing interests: The authors declare no competing interests.

Figures

Fig. 1
Fig. 1. PrimeNovo stands as the pioneering biological non-autoregressive Transformer model, delivering precise peptide sequencing.
a Model architecture overview: Our model takes MS/MS spectra as input and generates the predicted peptide sequence. It comprises two key components: (1) a non-autoregressive Transformer model backbone optimized with connectionist temporal classification (CTC) loss, enabling simultaneous amino acid prediction at all positions. (2) The precise mass control (PMC) decoding unit, which utilizes predicted probabilities to precisely optimize peptide generation to meet mass requirements. b Applications and biological insights: PrimeNovo’s capabilities extend to downstream tasks and offer valuable insights for various biological investigations. c Average performance comparison: This chart illustrates the average performance of PrimeNovo alongside four other top-performing models on the widely utilized nine-species benchmark dataset (93,750 tested spectrum samples across all 9 species). Each bar represents the mean peptide recall for the respective approach. The black line indicates the 95% confidence interval (n = 9). Notably, results for DeepNovo, Casanovo, and Casanovo V2 are based on model weights released by the original authors, while PointNovo’s results are cited from the published work, as the original model weights were not shared by PointNovo’s authors. Source data are provided as a Source Data file. Some figures were created in BioRender.
Fig. 2
Fig. 2. A detailed comparison between PrimeNovo and previous deep learning-based approaches on the nine-species benchmark dataset.
a The performance comparison between PrimeNovo and other de novo algorithms for recall-coverage curves on the nine-species benchmark dataset. These curves illustrate recall (the averaged peptide recall)—coverage (the proportion of the predicted spectra to all annotated spectra ranked by the model’s confidence) relationships across all confidence levels for each test species. PrimeNovo CV represents our model trained on the nine-species benchmark dataset using a cross-validation strategy. PrimeNovo represents our model trained on the MassIVE-KB dataset. b The average prediction performance on each individual species for PrimeNovo and comparison models. PrimeNovo w/o PMC presents results obtained using CTC beam search decoding without PMC. c Comparison of Amino Acid level prediction recall across nine different species between Casanovo V2 and PrimeNovo. d Inference Speed Comparison: A comparison of inference speeds, measured in the number of spectra decoded per second, between PrimeNovo and Casanovo V2. The speed tests were conducted on the same computational hardware (single A100 NVIDIA GPU) and averaged over data from all test species. e and (f) Influence of Missing Peaks and Peptide Length: These plots reveal how the degree of missing peaks (less or equal to 8 for missing peaks and length ranging from 7 to 27) and the length of true labels affect the predictions of PrimeNovo and Casanovo V2. We plot a central curve that connects the mean values of the data points (n = 9714), with a light background representing the s.d. (scale factor=0.2) g. Performance on Amino Acids with Similar Masses: A comparison of Casanovo V2 and PrimeNovo in predicting amino acids with very similar molecular masses, such as K (128.094963) with Q (128.058578) and F (147.068414) with Oxidized M (147.035400). h Ablation study: An analysis of the impact of adding each module of our approach on the overall performance (of the nine-species benchmark dataset. (n = 9, data are presented as mean values ± sd). Source data are provided as a Source Data file.
Fig. 3
Fig. 3. PrimeNovo’s exceptional performance extends to unseen spectra from various biological sample sources.
a Average peptide recall: This section details the average peptide recall of PrimeNovo compared to baseline models across four distinct large-scale MS/MS datasets. b Enzyme-specific performance: Performance breakdown among six different proteolytic enzymes in the IgG1-Human-HC dataset. c Amino acid-level precision: The chart depicts the amino acid-level precision for PrimeNovo and Casanovo V2 on the IgG1-Human-HC (9719 tested spectrum samples) and HCC datasets (56,000 tested spectrum samples). The x-axis shows the coverage rate of predicted peptides based on each model’s confidence score. For instance, 20%-40% indicate the 20%-40% least confident predictions based on confidence scores. AA precision is then calculated within each coverage range. Note that data are presented as median values of each confidence level with interquartile range (50% percentile interval). d A Venn diagram illustrates the number of overlapping peptides among three de novo sequencing models and a traditional database searching algorithm. Each count represents identical peptides identified by both MaxQuant and the respective model for the same spectrum. e Model fine-tuning results: This chart demonstrates how performance on the HCC test dataset changes with the addition of more HCC training data during fine-tuning. The left side shows fine-tuning with only the HCC dataset, leading to catastrophic forgetting of the original data distribution (nine-species benchmark dataset). The right side shows fine-tuning with a mix of HCC and MassIVE-KB training data. The data points in the right figure show the performance of three different data ratios during the fine-tuning stage. We plot a central curve that connects the mean values of the data points, with a light background representing the s.d. f A comparison of performance between PrimeNovo and five other de novo models on a 3-species test dataset. g This diagram demonstrates the model’s generalization capability when trained exclusively with each training dataset. The left-hand side indicates each one of the four training data PrimeNovo is trained on. The thickness of each line indicates the performance on each of the four testing sets on the right-hand side, with a thicker line being better performance. The numbers on the stem indicate the averaged peptide recall over all four testing sets, highlighting the distributional transferability of each training data. The model trained on MassIVE-KB exhibited the highest average peptide recall, 65% (bolded). Source data are provided as a Source Data file.
Fig. 4
Fig. 4. Error analysis and model explainability offer valuable insights into the performance of PrimeNovo.
a Attention map and feature vector similarity: This section showcases the visualization of attention maps between the Transformer encoders of Casanovo V2 and PrimeNovo. It also includes a detailed similarity analysis of each column in the feature vector from the value matrix projection. The boxplot displays the minimum, maximum, median, and quartiles of the similarities scores (n = 421,232, outliers omitted). b Layerwise prediction refinement: A case study demonstrates how PrimeNovo’s non-autoregressive model progressively refines predictions layer by layer, highlighting the model’s capacity for self-correcting its predictions as a whole. Note that * represents the Glutamine deamidation modification on amino acid Q. c The points display the average prediction accuracy at the amino acid level across each layer in PrimeNovo, with the boxplot showing the minimum, maximum, median, and quartiles of the prediction accuracy (n = 88,236). d This diagram illustrates the proportion of peaks corresponding to b-y ions, as determined from predictions, based on all peaks within the PT test set ranked within the top 10 by their contribution scores. e Alignment between the model’s contribution scores and the theoretical b-y ion peaks derived from predictions is presented. The diagram’s lower half shows the magnitude of all contribution scores, emphasizing those matching the b-y ions. The upper half provides a comparison with the original spectrum. f A case study on how the theoretical ions, calculated from the predicted peptide, align with the input spectrum. The matched theoretical b-y ions are distinctly marked in red and blue for predictions made by PrimeNovo and Casanovo, respectively. This comparison seeks to identify potential sources of error in incorrect predictions. The diagram’s bottom left section highlights a high contribution score assigned to an incorrect peak, corresponding to a b-ion peak linked to an erroneous amino acid prediction in PrimeNovo’s final layer. Source data are provided as a Source Data file.
Fig. 5
Fig. 5. The advantages of PrimeNovo in metaproteomic analysis.
a Identification of PSMs and peptides through the quality control process T\U\D\DS, which involves the following steps: first, we identify sequences present in the target database. Then, we filter out results that are (1) unmatched with the precursor mass (mass error >0.1 Da); (2) found within the decoy database; (3) identified in database search results. Both the target and decoy databases were provided in the original study. Additionally, the T\U\D approach is similar but does not entail a comparison with the database search results. b The Venn diagram illustrates the overlap between peptides identified by PrimeNovo and Casanovo V2, as well as the bacterial-specific peptides (PrimeNovo-B and Casanovo V2-B). c The treeview representation of species-level identification. d The number of peptides identified at the phylum, genus, and species levels, with the note that taxa identified by fewer than three unique peptides are excluded. e The number of peptides at the phylum, genus, and species levels after the quality control process T\U\D.
Fig. 6
Fig. 6. De novo sequencing of peptides with PTMs.
a A fine-tuning pipeline for PrimeNovo’s PTM prediction. b The methodology for selecting high-quality phosphopeptides predicted by PrimeNovo. c Performance metrics on the 21PTMs dataset (n = 21), including classification accuracy, amino acid-level recall, and peptide-level recall. d and (e) A comparative analysis of the actual input spectrum and the spectrum of the synthesized peptide predicted by PrimeNovo. The diagrams' upper sections display the original input spectrum, whereas the lower sections illustrate the spectrum generated from the predicted peptide sequence. Overlapping peaks are highlighted in red and blue for b-y ions. The cosine similarity is calculated based on spectrum encoding using the GLEAMS package. Source data are provided as a Source Data file. Some figures were created in BioRender.

Similar articles

References

    1. Aebersold, R. & Mann, M. Mass spectrometry-based proteomics. Nature422, 198–207 (2003). - PubMed
    1. Cox, J. & Mann, M. MaxQuant enables high peptide identification rates, individualized p. Nat. Biotechnol.26, 1367–1372 (2008). - PubMed
    1. Eng, J. K., McCormack, A. L. & Yates, J. R. An approach to correlate tandem mass spectral data of peptides with amino acid sequences in a protein database. J. Am. Soc. Mass Spectrom.5, 976–989 (1994). - PubMed
    1. Perkins, D. N., Pappin, D. J., Creasy, D. M. & Cottrell, J. S. Probability-based protein identification by searching sequence databases using mass spectrometry data. Electrophoresis20, 3551–3567 (1999). - PubMed
    1. Zhang, J. et al. PEAKS DB: de novo sequencing assisted database search for sensitive and accurate peptide identification. Mol. Cell. Proteom.11, M111.010587 (2012). - PMC - PubMed

Publication types

LinkOut - more resources