. 2025 Jan 2;16(1):313.
doi: 10.1038/s41467-024-55267-x.

Deep learning-based aberration compensation improves contrast and resolution in fluorescence microscopy

Affiliations

Deep learning-based aberration compensation improves contrast and resolution in fluorescence microscopy

Min Guo et al. Nat Commun. .

Abstract

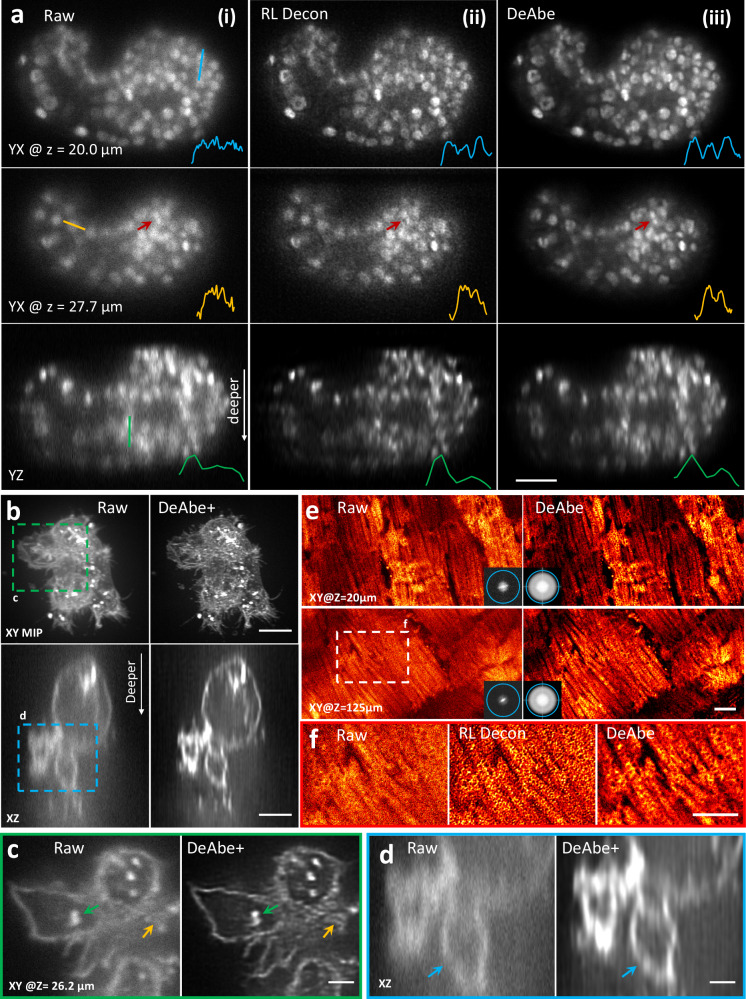
Optical aberrations hinder fluorescence microscopy of thick samples, reducing image signal, contrast, and resolution. Here we introduce a deep learning-based strategy for aberration compensation, improving image quality without slowing image acquisition, applying additional dose, or introducing more optics. Our method (i) introduces synthetic aberrations to images acquired on the shallow side of image stacks, making them resemble those acquired deeper into the volume and (ii) trains neural networks to reverse the effect of these aberrations. We use simulations and experiments to show that applying the trained 'de-aberration' networks outperforms alternative methods, providing restoration on par with adaptive optics techniques; and subsequently apply the networks to diverse datasets captured with confocal, light-sheet, multi-photon, and super-resolution microscopy. In all cases, the improved quality of the restored data facilitates qualitative image inspection and improves downstream image quantitation, including orientational analysis of blood vessels in mouse tissue and improved membrane and nuclear segmentation in C. elegans embryos.


Conflict of interest statement

Competing interests: The authors declare no competing interests.

Figures

Fig. 1
Fig. 1. Concept and simulations illustrating deep learning-based aberration compensation.
a Schematic. Left: Fluorescence microscopy volumes are collected and near-diffraction-limited images from the shallow side of each stack are synthetically degraded to resemble aberrated images deeper into the stack. A neural network (e.g., 3D RCAN) is trained to reverse this degradation given the ground truth on the shallow side of the stack, and the trained neural network (DeAbe model) subsequently applied to images throughout the stack, improving contrast and resolution. Right: More detailed view of synthetic degradation process. Zernike basis functions and associated coefficients (coeffs) are used to add random aberrations by modifying the ideal point spread function (iPSF) to generate an aberrated PSF (aPSF). Ground truth images (GT) are Fourier transformed (FT) and multiplied by the ratio of the Fourier transformed aberrated and ideal PSFs (essentially a modified optical transfer function, mOTF). Inverse Fourier transforming (IFT) the result and adding noise generates the synthetically aberrated images. See “Methods” for further details. OBJ: objective lens. b Simulated three-dimensional phantoms comparing maximum intensity projections of aberrated input image (left, random aberration with root mean square (RMS) wavefront distortion of 2 radians and Poisson noise added for an SNR of ~16, corresponding PSF in inset), network prediction (DeAbe) given aberrated input (middle), and ground truth (GT, right). Higher magnification views of dashed rectangular region are shown in (c) (maximum intensity projection) and (d) (single plane), additionally showing restoration given blind deconvolution (Blind Decon), Richardson-Lucy deconvolution with diffraction-limited PSF (RL Decon 1), Richardson-Lucy deconvolution with aberrated PSF (RL Decon 2). Yellow arrows indicate a reference structure for visual comparison. Twenty iterations were used for RL deconvolution and ten for blind deconvolution. e As in (c, d) but showing axial plane along dashed blue line in (b). f Quantitative comparisons for the restorations shown in (be) using structural similarity index (SSIM, top) and peak signal-to-noise ratio (PSNR, bottom). Means and standard deviations are shown for 100 simulations (10 independent phantom volumes, each aberrated with 10 randomly chosen aberrations). Scale bars: 5 μm (b) and 2.5 μm (c–e). See also Supplementary Figs. 1–5.
Fig. 2
Fig. 2. Benchmarking DeAbe against experimental ground truth and adaptive optics (AO) correction.
a Phalloidin-stained PtK2 cells: aberrated (i), DeAbe prediction (ii), and ground truth (GT, iii) images are shown. Inset in (i) shows applied aberration; right hand insets in i)-iii) show Fourier transforms, blue ellipse with 1/500 nm−1 horizontal extent and 1/400 nm−1 vertical extent. Note images have been rotated so viewing is normal to the coverslip surface, which results in anisotropic resolution in the lateral plane. b Higher magnification insets of green rectangular region in (a). c Higher magnification views of the yellow rectangular region in (b). d Higher magnification view of blue rectangular region in (a). e Line profiles along red arrowheads in (d) comparing aberrated image (blue), DeAbe prediction (red), and ground truth (GT, black). f Decorrelation resolution analysis of images in (a). Means, standard deviations and individual data points from 12 images are shown. Arrows in (b) and (d) highlight details, facilitating comparison. XY: lateral views of sample (single planes). See also Supplementary Figs. 10–13. 5 dpf zebrafish embryos expressing a GFP membrane marker were fixed and imaged, with image volumes restored via DeAbe or corrected via AO. g Depth coded lateral (XY) maximum intensity projection of volume after DeAbe compensation. Volume spans 20 μm. h Single lateral plane 13 μm into imaging volume. DeAbe prediction is shown. Note images are displayed in the native view, resulting in isotropic resolution in the lateral plane. ik Higher magnification views of green, orange, and blue rectangular regions in (h), comparing raw (iv), DeAbe prediction (v), or AO correction (vi). l Axial cross section along dashed white line in (g). Arrows in (il) highlight membrane regions for comparisons. m Lateral resolution estimates from decorrelation analysis. Means, standard deviations, and individual data points derived from 15 volumes are shown. See also Supplementary Fig. 14. Scale bars: 10 μm and 0.4 μm−1 vertical/ 0.5 μm−1 horizontal (insets) (a); 5 μm (b, d, g, h); 2 μm (c, i, j, k, l). Data shown are representative samples from N = 12 experiments for (a–d) and N = 15 for (g–l).
Fig. 3
Fig. 3. Computational aberration compensation on variety of fluorescence microscopy image volumes.
a Live C. elegans embryos expressing a pan-nuclear GFP histone marker were imaged with light sheet microscopy (i, left column) and the raw data processed with Richardson-Lucy deconvolution (ii, 10 iterations, middle column) or with a trained DeAbe model (iii, right column). First two rows show single planes 20.0 and 27.7 μm into the sample, third row shows axial view. Comparative line profiles through blue, yellow, and green lines are shown in insets, comparing ability to discriminate nuclei. Red arrow highlights nuclei for visual comparison. See also Supplementary Movie 3. b NK-92 cells stained with Alexa Fluor 555 wheat germ agglutinin and embedded in collagen matrices were fixed and imaged with instant SIM, a super-resolution imaging technique. Left: raw data, right: after application of DeAbe and deconvolution (DeAbe + , 20 iterations Richardson-Lucy). Lateral maximum intensity projections (MIP, top) or single axial planes (bottom) are shown in (b), and (c, d) show higher magnification views corresponding to green (c) or blue (d) dashed rectangular regions in (b). Colored arrows in (c, d) highlight fine features obscured in the raw data and better revealed in the DeAbe+ reconstructions. See also Supplementary Movie 5, Supplementary Fig. 19. e Live cardiac tissue containing cardiomyocytes expressing Tomm20-GFP was imaged with two photon microscopy. Raw data (left) are compared with DeAbe prediction (right) at indicated depths, with insets showing corresponding Fourier transform magnitudes. Blue circles in Fourier insets in (e) indicate 1/300 nm−1 spatial frequency just beyond resolution limit. See also Supplementary Movie 6. f Higher magnification views of white dashed rectangular region in (e), emphasizing recovery of mitochondrial boundaries by DeAbe model. See also Supplementary Fig. 21, Supplementary Movie 7. Scale bars: 10 μm (a, e); 5 μm (b, f); 2 μm (c, d); (e) diameter of Fourier circle: 300 nm−1. Data shown are representative samples from N = 3 experiments.
Fig. 4
Fig. 4. Computational aberration compensation on mm-scale cleared mouse embryo volumes.
a Fixed and iDISCO-cleared E11.5-day mouse embryos were immunostained for neurons (TuJ1, cyan) and blood vessels (CD31, magenta), imaged with confocal microscopy and processed with a trained DeAbe model. See also Supplementary Movie 8. b Axial view corresponding to dotted rectangular region in (a), comparing raw data and depth-compensated, de-aberrated, and deconvolved data (DeAbe + ). See also Supplementary Figs. 23, 24. c Higher magnification lateral view at axial depth of 1689 μm indicated by the orange double headed arrowheads in (b). d Higher magnification views of white dotted region in (c), comparing raw (left) and DeAbe+ processing (right) for neuronal (top) and blood vessel (bottom) stains. e Orientation (θ, transverse angle) analysis on blood vessel channel of DeAbe+ data, here shown on single lateral plane at indicated axial depth. See also Supplementary Fig. 25, Supplementary Movie 9. f Higher magnification lateral view of white dotted region in (e) (note that axial plane is different), comparing intensity (left) and orientation (right) views between raw (top row) and DeAbe+ prediction (middle row). Righthand insets show higher magnification views of vessel and surrounding region highlighted by dotted lines. Bottom row indicates histogram of all orientations in the vessel highlighted with dotted ellipse, full-width-at-half maximum (FWHM) in peak region of histogram is also shown. g Directional variance of blood vessel stain within the indicated plane, with higher magnification region of interest (ROI) views at right. Histogram of directional variance in both regions also shown. See also Supplementary Fig. 26. Scale bars: 500 μm (a, b, c, e); 100 μm (d), 50 μm inset; 300 μm (f), 50 μm inset; 300 μm (g), 50 μm inset. Data shown are representative samples from N = 3 experiments for (ad) and N = 1 for(eg).
Fig. 5
Fig. 5. Incorporating aberration compensation into multi-step restoration dramatically improves image quality in volumetric time-lapse imaging.
a C. elegans embryos expressing GFP-labeled membrane marker (green) and mCherry-labeled nuclear marker (magenta) were imaged with dual-view light-sheet microscopy (diSPIM) and the raw data (left) from single-view recordings processed through neural networks that progressively de-aberrated, deconvolved, and isotropized spatial resolution (3-step DL, right). Single planes from lateral (top) and axial (bottom) perspectives are shown (b) Higher magnification axial views deep into embryo, corresponding to dashed rectangle in (a). c Examples of automatic segmentation on raw (left, 319 cells), 3-step deep learning (DL) prediction (middle, 421 cells), and manually corrected segmentation based on DL prediction (right, 421 cells). Single planes corresponding to upper planes in (a) are shown. Red, blue ellipses highlight regions for visual comparison. See also Supplementary Figs. 28, 29, Supplementary Movies 10, 11. d Number of cells detected by automatic segmentation of membrane marker vs. time for raw data (purple) and after applying first two DL steps (Steps 1, 2; blue, green curves). Means and standard deviations are derived from 3 embryos and manually derived ground truth (black) is also provided. See also Supplementary Fig. 32. e Maximum intensity projection (MIP) images of C. elegans embryos expressing membrane-localized GFP under control of the ttx3−3b promoter, imaged with diSPIM, comparing raw single-view recordings (left) and multi-step restoration that progressively de-aberrated, deconvolved, and super-resolved the data (right, 3-step DL). Embryo boundary outlined in light blue for clarity. See also Supplementary Figs. 34, 35, Supplementary Movie 12. Higher magnification MIP (f) or lateral (g) or axial (h) planes corresponding to dashed lines, rectangle in (e) are also shown. i Time series based on 3-step DL MIP predictions highlight developmental progression of AIY (blue) and SMDD (magenta) neurites as they enter the nerve ring region. Top, bottom parts of each panel at each time point show MIP (neurites highlighted as dotted lines) vs. neurite model, respectively. See also Supplementary Fig. 36. Scale bars: 5 μm (a, c, e, f, h); 2 μm (b, d, g). Data shown are representative samples from N = 3 experiments.

Update of

Similar articles

Cited by

References

    1. Ji, N. Adaptive optical fluorescence microscopy. Nat. Methods14, 374 (2017). - PubMed
    1. Hampson, K. M. et al. Adaptive optics for high-resolution imaging. Nat. Rev. Methods Prim.1, 1–26 (2021). - PMC - PubMed
    1. Wang, K. et al. Rapid adaptive optical recovery of optimal resolution over large volumes. Nat. Methods11, 625–628 (2014). - PMC - PubMed
    1. Zheng, W. et al. Adaptive optics improves multiphoton super-resolution imaging. Nat. Methods14, 869–872 (2017). - PMC - PubMed
    1. Weigert, M. et al. Content-aware image restoration: pushing the limits of fluorescence microscopy. Nat. Methods15, 1090–1097 (2018). - PubMed

Publication types

LinkOut - more resources