. 2025 Jan 2;16(1):137.
doi: 10.1038/s41467-024-55419-z.

Time-series single-cell transcriptomic profiling of luteal-phase endometrium uncovers dynamic characteristics and its dysregulation in recurrent implantation failures

Affiliations

Time-series single-cell transcriptomic profiling of luteal-phase endometrium uncovers dynamic characteristics and its dysregulation in recurrent implantation failures

Dandan Cao et al. Nat Commun. .

Abstract

Understanding human endometrial dynamics in the establishment of endometrial receptivity remains a challenge, which limits early diagnosis and treatment of endometrial-factor infertility. Here, we decode the endometrial dynamics of fertile women across the window of implantation and characterize the endometrial deficiency in women with recurrent implantation failure. A computational model capable of both temporal prediction and pattern discovery is used to analyze single-cell transcriptomic data from over 220,000 endometrial cells. The time-series atlas highlights a two-stage stromal decidualization process and a gradual transitional process of the luminal epithelial cells across the window of implantation. In addition, a time-varying gene set regulating epithelium receptivity is identified, based on which the recurrent implantation failure endometria are stratified into two classes of deficiencies. Further investigation uncovers a hyper-inflammatory microenvironment for the dysfunctional endometrial epithelial cells of recurrent implantation failure. The holistic characterization of the physiological and pathophysiological window of implantation and a computational tool trained on this temporal atlas provide a platform for future therapeutic developments.


Conflict of interest statement

Competing interests: X.X. was an employee of Geneplus-Shenzhen. All the other authors declare no competing interests.

Figures

Fig. 1
Fig. 1. Cellular landscape of human endometrium across the window of implantation.
a Schematic summary of the experimental design. Endometrial cells from fertile control and RIF were processed by single-cell 3’ transcriptomic sequencing. Created in BioRender. Gong (2024) https://BioRender.com/c12o660. b UMAP plots of a total of 220,248 cells and epithelial, stromal, NK/T, and myeloid subsets color-coded by major cell types (left) and subpopulations (right), respectively. c The expression of marker genes for the major cell types. d The RNA velocity trajectory (left) and latent time (right) for epithelial cell subpopulations. e Immunostaining of luminal marker genes (CDH1, LGR5, EDG7) and glandular marker gene (FOXA2) in endometrium of proliferative phase (n = 3). G: gland. f Immunostaining of epithelial cell marker EPCAM and stromal cell marker VIM in LH + 5 endometrial tissue (n = 1). Results for other time points could be found in Supplementary Fig. 5 (n = 4 in total). Source data are provided as a Source Data file.
Fig. 2
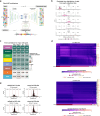
Fig. 2. StemVAE reconstruction uncovers endometrial cell time-association across WOI.
a Architecture of StemVAE. Composed of a deep nonlinear encoder and two decoders, StemVAE represents single-cell expression data labeled with sampling time into a lower-dimensional latent space for expression and time reconstruction. b Predicted time distribution for the fertile controls collected at different time points. A predicted time∈[−1,1] was generated by StemVAE for each cell from each individual. Density plots showing predicted time distribution of all cells from samples collected at a given time LH + 3/ + 5/ + 7/ + 9/ + 11. c Spearman’s rank correlation coefficient of predicted time and sampling time for each major cell type under different training modes of StemVAE. hvg: highly variable genes; rc: random cell; vp: time-associated genes from variancePartition. Nonparametric Spearman’s rank sum test was used. P values  ≤  0.05 were represented as *, ≤0.01 as **, ≤0.001 as ***, ≤0.0001 as ****. d Heatmap showing the dynamic time-associated gene expression along the time axis for epithelial (top) and stromal cells (bottom). Cells were ordered according to the predicted time within each group. e Predicted time distribution for epithelial and stromal cells of independent samples collected at LH + 7 based on the training model on 18 fertile controls. E34 was an independent donor recruited for validation; E35 was the repeated endometrium biopsy of donor LH7_1 one year later since the first sampling.
Fig. 3
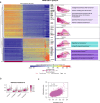
Fig. 3. Characteristics of stromal dynamics across the window of implantation.
a An integrated scheme showing the heatmap of denoised and scaled expression of time-associated genes in stromal cell (left), expression trend of each gene cluster (middle), and significantly enriched biological terms/pathways from KEGG, Reactome, and MSigDB Hallmark (right). The color scale of heatmap represents the Z-score of normalized expression of included genes in the heatmap. Fisher exact test with Benjamini–Hochberg adjust was used for enrichment analysis. P values  ≤  0.05 were represented as *, ≤0.01 as **, ≤0.001 as ***, ≤0.0001 as ****. Exact p values can be found in Supplementary Data 3. b Violin plot showing the distribution of senescence score of stromal, epithelial, and endothelial cells across WOI. c Scatter plot showing the significant correlation relationship between senescence score and inflammation score. Pearson’s correlation test at 95% confidence interval was used.
Fig. 4
Fig. 4. Characteristics of epithelial dynamics across the window of implantation.
a An integrated scheme showing the heatmap of denoised and scaled expression of time-associated genes in luminal epithelial cell (left), expression trend of each gene cluster (middle), and significantly enriched biological terms/pathways from KEGG, Reactome and MSigDB Hallmark (right). The color scale of heatmap represents the Z-score of normalized expression of included genes in the heatmap. Fisher exact test with Benjamini–Hochberg adjust was used for enrichment analysis. P values  ≤  0.05 were represented as *, ≤0.01 as **, ≤0.001 as ***, ≤0.0001 as ****. Exact p values can be found in Supplementary Data 3. b Expression trend of selected transcription factors, unreported, and known epithelial receptive genes. c Expression validation of candidate receptive genes CDH1 and MT1X across WOI. For each group, independent samples (n = 3) were included. Data are presented as mean values +/− SEM. d Increased expression of CDH1 and MT1X in receptive Ishikawa cells compared with non-receptive HEC-1-B cells. For each group, independent samples (n = 3) were collected. Data are presented as mean values +/− SD. Two-sided Student’s t test was used with 95% confidence interval. Source data are provided as a Source Data file.
Fig. 5
Fig. 5. Stromal and epithelial cell regulation on endometrial immune microenvironment across WOI through cell-cell communication analysis.
a Heatmap showing the dynamic average expression of time-associated ligand/receptors (LR) in stromal cells according to the CellChat database. The color scale of heatmap represents the Z-score of normalized mean expression of genes across the time points. b Significant interacting pairs between time-associated stromal LRs and immune LRs. c Dynamic expression of selected stromal cell interacting molecules in NK/T and myeloid cells. d Heatmap showing the dynamic average expression of time-associated ligand/receptors (LR) in luminal epithelial cells according to the CellChat database. The color scale of heatmap represents the Z-score of normalized mean expression of genes across the time points. e Significant interacting pairs between time-associated epithelial LRs and immune LRs. f Dynamic expression of selected epithelial interacting molecules in NK/T and myeloid cells. Partially created in BioRender. Gong (2024) https://BioRender.com/g77u078 (c, f).
Fig. 6
Fig. 6. Pathological endometrial characteristics of RIF patients at WOI.
a UMAP plots of 45282 cells in the fertile LH7 group and 90,754 cells in the RIF group showing the major cell types. b Heatmap showing the clustering of RIF patients based on the cell percentage distribution of epithelial and stromal cells predicted by StemVAE. Window displacement (from LH + 7 to LH + 9) could be seen in the RIF endometrium. The color scale of heatmap represents cell percentage. c The estimated decidualization score in stromal cells and receptivity score in epithelial cells using respective gene sets between fertile (n = 6) and RIF endometrium (n = 3 for RIFClass1, n = 7 for RIFClass2). N indicates independent samples. The boxes extend from the first quartile (Q1) to third quartile (Q3), with the band inside the boxes representing the median. The whiskers extend to the smallest and largest values within 1.5 times the inter-quartile range (IQR), where IQR is the difference between Q3 and Q1. The two-sided Student’s t test was used to determine the statistical significance, p values  ≤  0.05 were represented as *, ≤0.01 as **. d The GSEA hallmark pathway (Interferon gamma response) enriched in RIFClass2-derived cells, ordered by -log10FDR. e UMAP plot of IFNG expression in fertile and RIF cells. The color scale represents normalized gene expression. f Fold change of IFNG expression between fertile and RIFClass2 derived NK, CD4_T, CD8_T and Treg cells. g UMAP plot of IFNGR1 expression in fertile and RIF-derived epithelial cells. h Violin plot of IFNGR1 expression between fertile and RIFClass2 derived luminal epithelial cells. Two-sided t test at 95% confidence interval was used. P values  ≤  0.0001 were represented as ****. i The GSEA hallmark pathways (ordered by -log10FDR) enriched for upregulated genes (upper panel) and downregulated genes (lower panel) in RIFClass2-derived IFNGR1+ luminal epithelial cells when compared to that of fertile women. Source data are provided as a Source Data file.

Similar articles

Cited by

References

    1. Noyes, R. W., Hertig, A. T. & Rock, J. Dating the endometrial biopsy. Am. J. Obstet. Gynecol.122, 262–263 (1975). - PubMed
    1. Wilcox, A. J., Baird, D. D. & Weinberg, C. R. Time of implantation of the conceptus and loss of pregnancy. N. Engl. J. Med.340, 1796–1799 (1999). - PubMed
    1. Croxatto, H. B. et al. Studies on the duration of egg transport by the human oviduct. II. Ovum location at various intervals following luteinizing hormone peak. Am. J. Obstet. Gynecol.132, 629–634 (1978). - PubMed
    1. Achache, H. & Revel, A. Endometrial receptivity markers, the journey to successful embryo implantation. Hum. Reprod. Update12, 731–746 (2006). - PubMed
    1. Brosens, J. J. et al. Uterine selection of human embryos at implantation. Sci. Rep.4, 3894 (2014). - PMC - PubMed

Publication types

Associated data

LinkOut - more resources