. 2025 Jan 2;16(1):17.
doi: 10.1038/s41467-024-55103-2.

Parameters for one health genomic surveillance of Escherichia coli from Australia

Collaborators, Affiliations

Parameters for one health genomic surveillance of Escherichia coli from Australia

Anne E Watt et al. Nat Commun. .

Erratum in

Abstract

Genomics is a cornerstone of modern pathogen epidemiology yet demonstrating transmission in a One Health context is challenging, as strains circulate and evolve within and between diverse hosts and environments. To identify phylogenetic linkages and better define relevant measures of genomic relatedness in a One Health context, we collated 5471 Escherichia coli genome sequences from Australia originating from humans (n = 2996), wild animals (n = 870), livestock (n = 649), companion animals (n = 375), environmental sources (n = 292) and food (n = 289) spanning over 36 years. Of the 827 multi-locus sequence types (STs) identified, 10 STs were commonly associated with cross-source genomic clusters, including the highly clonal ST131, pandemic zoonotic lineages such as ST95, and emerging human ExPEC ST1193. Here, we show that assessing genomic relationships at ≤ 100 SNP threshold enabled detection of cross-source linkage otherwise obscured when applying typical outbreak-oriented relatedness thresholds ( ≤ 20 SNPs) and should be considered in interrogation of One Health genomic datasets.


Conflict of interest statement

Competing interests: The authors declare that there are no conflicts of interest regarding the generation and publication of this manuscript.

Figures
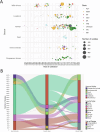
Fig. 1
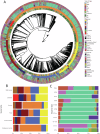
Fig. 1. Composition of the collection.
A Timeline of samples in the dataset by source and state or territory of origin. B Alluvial diagram visualising the broad source of genomes (left column), species, or type grouping of samples (centre column) and extraintestinal or intestinal sample isolation (right column). Labels for species or type have been omitted for groups with less than 10 samples, these include bovine, food, environmental, soil, marsupial, feline, reptile, caprine and ‘liquid’.
Fig. 2
Fig. 2. Genomic overview of the collection.
A Phylogenetic tree (cgMLST-derived; see “methods”) visualizing the relatedness of the isolates under investigation. Coloured bars indicate (from innermost to outermost) i) the Australian State from which a genome originates; ii) Phylogroup association; iii) Source Niche; iv) Source Type and v) Sample type (whether Extraintestinal, Intestinal, Other or Unknown). Tree is midpoint rooted. Metadata is shown on this tree only to demonstrate its broad associations with phylogenetic structure; data on individual genomes is available in Supplementary Data 1. B Intersection of phylogroup and isolate source. C Source Niche of the top ten sequence types. See legend to the right of panel A for phylogroup and Source Niche colours associated with panels (B and C). Note that for panel B, cryptic E. coli phylogroups are omitted.
Fig. 3
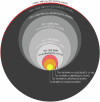
Fig. 3. Euler diagram visualising the frequency of SNP distances amongst multi-source isolate pairs.
Area for a given circle is proportional to the number of pairs at a given threshold. The highest distance detected among the ten STs under analysis was 11,350; note that SNP distances were computed only for strain pairs sharing an ST.* - Actual value = 0.03%. Note that large SNP distances (e.g., those exceeding 1000 SNPs) are less accurate than smaller SNP distances and should only be used as a guide.
Fig. 4
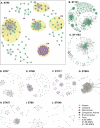
Fig. 4. Network analyses for STs commonly associated with multi-sectoral clusters representing their intra-source and inter-source dissemination.
Genomic clusters include two or more instances of genomes which have a pairwise SNP distance of ≤ 100 SNPs and are coloured by source. A. Highlights ST95, a common pathogen of humans and poultry. Examples of multi-source and mono-source clusters are highlighted in yellow. B–J Display the networks for other STs commonly identified in the dataset with multi-sectoral clusters. SNP distances for clusters is available in Supplementary Data 2. (https://github.com/maxlcummins/APG-OHEC-Retro-M1/blob/v1.0.1/Supplementary_Material/Supplementary_Table_2.txt).
Fig. 5
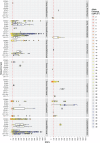
Fig. 5. Phylogenetic distance by across sources and sequence types.
This series of box plots compare the phylogenetic distances of isolate pairs (the unit under study). STs for a given pair are shown on the y-axis, SNP distances are shown on the x-axis and the colour of a data point representing a pair of isolates indicates the cgMLST distance for that pair. Counts of strain pairs for given combinations of STs and pairs of sources are available in Supplementary Data 3. Central lines within boxplots represents the mean, while the bounds of the box indicate the first and third quartiles (25th and 75th percentiles). Whiskers extend to the minimum and maximum values. A red dotted line at 100 SNPs indicates a threshold of relatedness used to indicate moderate phylogenetic overlap. Panels visualise these parameters for pairs of isolates from the denoted pairs of sources – only isolate pairs from different sources are shown.

Similar articles

Cited by

References

    1. Djordjevic, S. P. et al. Genomic surveillance for antimicrobial resistance—a One Health perspective. Nat. Rev. Genet.25, 142–157 (2024). - PubMed
    1. Adisasmito, W. B. et al. One Health: A new definition for a sustainable and healthy future. PLoS Pathog.18, e1010537 (2022). - PMC - PubMed
    1. Dubreuil, J. D., Isaacson, R. E. & Schifferli, D. M. Animal Enterotoxigenic Escherichia coli. EcoSal Plus7, 10.1128/ecosalplus.ESP-0006-2016 (2016). - PMC - PubMed
    1. Nagy, B. & Fekete, P. Z. Enterotoxigenic Escherichia coli in veterinary medicine. Int. J. Med. Microbiol.295, 443–454 (2005). - PubMed
    1. Nagy, B. & Fekete, P. Z. Enterotoxigenic Escherichia coli (ETEC) in farm animals. Vet. Res30, 259–284 (1999). - PubMed

Publication types

LinkOut - more resources