Clinical Trial
. 2025 Jan 2;16(1):226.
doi: 10.1038/s41467-024-55583-2.

The spatially informed mFISHseq assay resolves biomarker discordance and predicts treatment response in breast cancer

Affiliations
Clinical Trial

The spatially informed mFISHseq assay resolves biomarker discordance and predicts treatment response in breast cancer

Evan D Paul et al. Nat Commun. .

Abstract

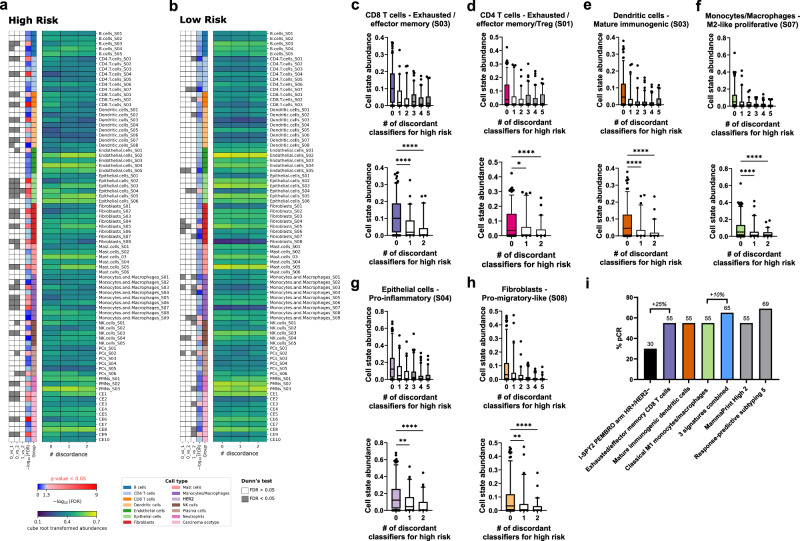
Current assays fail to address breast cancer's complex biology and accurately predict treatment response. On a retrospective cohort of 1082 female breast tissues, we develop and validate mFISHseq, which integrates multiplexed RNA fluorescent in situ hybridization with RNA-sequencing, guided by laser capture microdissection. This technique ensures tumor purity, unbiased whole transcriptome profiling, and explicitly quantifies intratumoral heterogeneity. Here we show mFISHseq has 93% accuracy compared to immunohistochemistry. Our consensus subtyping and risk groups mitigate single sample discordance, provide early and late prognostic information, and identify high risk patients with enriched immune signatures, which predict response to neoadjuvant immunotherapy in the multicenter, phase II, prospective I-SPY2 trial. We identify putative antibody-drug conjugate (ADC)-responsive patients, as evidenced by a 19-feature T-DM1 classifier, validated on I-SPY2. Deploying mFISHseq as a research-use only test on 48 patients demonstrates clinical feasibility, revealing insights into the efficacy of targeted therapies, like CDK4/6 inhibitors, immunotherapies, and ADCs.


Conflict of interest statement

Competing interests: E.D.P., B.H., N.Val., N.M., D.G., S.G., H.I., T.O., M.G., L.B., S.B., J.B., K.B., D.D., Z.K., M.K., D.L., V.Mam., V.Man., N.Voj., M.R. and P.Č. are current, or former employees of MultiplexDX, a biotechnology company that is developing a lab developed diagnostic test called Multiplex8+ ( https://www.multiplexdx.com/products/multiplex-eight-plus ), which is based on the research presented in the manuscript. P.Č. and E.D.P. are inventors and MultiplexDX, s.r.o is the assignee on patent applications that were filed in relation to the technology and research outlined in the manuscript. These include a family of patents entitled “METHOD FOR DIAGNOSING DISEASES USING MULTIPLEX FLUORESCENCE AND SEQUENCING” (WO/2020/070325, EP3775277, CA3114689, AU2019354863, SG11202103466T, KR1020210071003, CN113366118, BR112021006454, US20230037279, JP2022513333, IL282067, and NZ774986) as well as submitted EPO and PCT patents that are not published. T.T., F.P., and J.N.K. are members of the Scientific Advisory board at MultiplexDX. F.P. reports consulting services and serving on the advisory board for AstraZeneca. J.N.K. declares consulting services for Owkin, France, DoMore Diagnostics, Norway, Panakeia, UK, Scailyte, Switzerland, Cancilico, Germany, Mindpeak, Germany, and Histofy, UK; furthermore, he holds shares in StratifAI GmbH, Germany, has received a research grant by GSK, and has received honoraria by AstraZeneca, Bayer, Eisai, Janssen, MSD, BMS, Roche, Pfizer and Fresenius. All other authors declare no competing interests. Ethics & Inclusions: This study complies with all relevant ethical regulations for human research participants in accordance with the Declaration of Helsinki. The collection and use of human tissue in the retrospective clinical validation study on 1082 patients and the RUO testing cohort of 48 patients were approved by the Ethics Committee of the Bratislava Self-Governing Region (Ref. No. 05320/2020/HF). Additionally, the retrospective cohort received approval from the Ethics Commission of the Medical University of Graz on behalf of Biobank Graz (No. 34-354 ex 21/21, 1158−2022). Informed consent was obtained for tissues in the retrospective study from tissue sources including biobanks (PATH Biobank and Biobank Graz), a hospital (Malaga), and commercial companies (AMSBio and Precision for Medicine). For the RUO cohort, all 48 patients signed informed consent forms, with their oncologists approving them prior to tissue processing. The RUO testing occurred through routine testing with collaborating hospitals in Slovakia and included consultations and participation of local oncologists and researchers for patient selection, collecting clinicopathological data, obtaining informed consent, and explaining results. No discrimination occurred in the selection of patients for RUO testing and both clinical partners and MultiplexDX ensured sensitive patient information was anonymized when appropriate and secured both physically and electronically. A local pathologist (Dr. Karol Kajo) was also consulted with in both the retrospective and RUO cohorts to identify invasive breast cancer or unique histology in more challenging cases.

Figures

Fig. 1
Fig. 1. Study design, workflow, and analytical validity.
a A retrospective cohort of 1,082 formalin-fixed paraffin-embedded (FFPE) breast cancer samples underwent multiplexed RNA-FISH-guided laser capture microdissection (LCM) coupled with RNA-sequencing. Annotation of the tumor on a hematoxylin and eosin (H&E) section and the biomarker expression derived from multiplexed RNA-FISH were used to select regions of interest (ROIs) for LCM from cresyl violet sections. These tumor-enriched samples were then sequenced to characterize gene expression signatures to provide diagnostic, prognostic, and predictive inferences from the cohort clinical data. DEGs, Differential expressed genes; IHC, immunohistochemistry. Created with BioRender.com. b Analytical validity of mFISHseq compared to immunohistochemistry assessed by receiver operating characteristic (ROC) curves in 1013 breast tumors stratified into 70:30 training (n = 701) and test (n = 312) datasets. AUC, area under the curve. The table shows biomarker thresholds defined in the training set by maximizing concordance (Cohen’s κ) between RNA-SEQ transcripts per million (TPM) expression values and immunohistochemistry results for each biomarker. These thresholds were then applied to the test set. Source data are provided as a Source Data file.
Fig. 2
Fig. 2. Consensus subtyping yields intrinsic molecular subtypes associated with survival.
Overall survival (OS) according to consensus subtyping with respect to the IHC (immunohistochemistry) surrogate subtype according to IHC results, including Luminal A (a, n = 432), Luminal B (b, n = 313), HER2+ (c, n = 87), and TNBC (d, n = 181) stratified by nodal status (left and right panels depict node negative and positive, respectively). (e) Sankey diagram shows the IHC surrogate subtypes and the proportion (%) of samples reclassified by consensus subtyping. (f) Overall survival of consensus molecular subtypes (n = 1013). Survival curves were analyzed using the log-rank test to assess statistical significance. (g) Forest plots showing univariate and multivariate Cox proportional hazards models comparing prognostic utility of IHC surrogate vs Consensus molecular subtypes (n = 1013). Multivariate models included both tumor size (pT1 vs pT2-pT4) and node status (pN0 vs pN1-pN3). Hazard ratios show the overall survival estimates with 95% CIs, where the center of the interval represents the point estimate. P-values were obtained from the Wald test. Source data are provided as a Source Data file.
Fig. 3
Fig. 3. Consensus prognostic risk categories show clinically relevant differences in survival.
a Concordance of each classifier for high- and low-risk samples as illustrated by the number of concordant classifiers and (b) after consolidating into majority (agreement in ≥3 prognostic classifiers) and minority (agreement in 1-2 prognostic classifiers) categories. c Distribution of mRNA expression for estrogen receptor (ESR1, yellow, left panel), progesterone receptor (PGR, green, left/middle panel), HER2 receptor (ERBB2, red, right/middle panel), and Ki67 marker of proliferation (MKI67, orange, right panel) in patients that were classified as high risk by a particular number of concordant classifiers (i.e., 0-5 concordant classifiers). Statistical comparisons were performed using the Kruskal-Wallis test. *p < 0.05, **p < 0.01, ***p < 0.001, ****p < 0.0001. Data are presented as scatter dot plots with the dotted line as the median. d Exploratory decision tree describing criteria for consensus classification of patients into high-, low-, and ultra-low-risk categories. e Kaplan Meier plots show progression free survival (PFS) and overall survival (OS) for each consensus prognostic risk category (high, low, and ultra-low). All analyses contain 567 patient samples that would be eligible for prognostic multigene tests in a real-world clinical setting (ER or PR+, HER2−, and 0-3 positive lymph nodes). Survival curves were analyzed using the log-rank test to assess statistical significance. Source data are provided as a Source Data file.
Fig. 4
Fig. 4. Clinical and molecular parameters associated with discordant risk assignment.
a Venn diagram depicting the number of overlapping genes among each of the four multigene prognostic classifiers. b Dot plot of clinical parameters significantly associated with high and low risk. Statistical analysis was performed using a Chi-square test. Stacked bar graphs illustrate the proportion of selected clinical parameters associated with discordance in either high or low risk, including tumor size (n = 575) (c), node status (n = 575) (d), tumor grade (n = 573) (e), histological subtypes (n = 509) (f), clinical risk as described in the MINDACT trial (n = 568) (g), and treatment with chemotherapy (n = 556) (h). The percentages at the top of each bar denote the proportion of patients with pT2-pT3 tumors (c), node positive status (d), grade 1 (G1) tumors (e), invasive lobular carcinoma (f), low clinical risk (g), and adjuvant chemotherapy treatment (h). Missing or ambiguous clinical data resulted in some clinical parameters having <575 patients. The heatmaps (i) show the significant genes/gene signatures associated with discordance in 1 or 2 prognostic classifiers relative to patients with unanimous agreement (group labeled as 0) for either high (left heatmap) or low (right heatmap) risk. The legends refer to the row metadata for gene/gene signature group, −log10 (adjusted p-value) for all significant Kruskal-Wallis tests (adjusted p-value < 0.05), results from Dunn’s multiple comparison tests for each pairwise comparison (gray box, adjusted p-value < 0.05; white box, adjusted p-value > 0.05), and the z-score normalized expression. Note that the data in the high- and low-risk heatmaps are the same as presented in Supplementary Fig. 11, but the labels for low risk have been changed from 5, 4, and 3 to 0, 1, and 2. Source data are provided as a Source Data file.
Fig. 5
Fig. 5. Cell types and states associated with discordance and immunotherapy response.
The heatmaps show the significantly different cell types/states in patients that have one or two (groups 1-2) prognostic classifiers that are discordant with patients that are unanimously classified (group 0) as either high (a) or low (b) risk as the reference group. The legends refer to the row metadata for group (cell type), −log10 (FDR) with red values denoting significant results from a Kruskal-Wallis test (FDR < 0.05), results from Dunn’s multiple comparison tests for each pairwise comparison (gray box, FDR < 0.05; white box, FDR > 0.05; note that post hoc comparisons are depicted even if the Kruskal-Wallis test was not significant), and the cube root transformed cell type/state abundances. The data in the high (a) and low (b) risk heatmaps are the same as presented in Supplementary Fig. 12, but the labels for low risk have been changed from 5, 4, and 3 to 0, 1, and 2. Box and whisker plots illustrate the exemplary cell types/states that are differentially expressed when comparing high- and low-risk samples (top panel graphs) as well as patients that have 1 or 2 discordant classifiers for high risk relative to those who have unanimous agreement (bottom panels). Cell types/states include CD8 T cells – Exhausted/effector memory (SO3) (c), CD4 T cells – Exhausted / effector memory / Treg (SO1) (d), Dendritic cells – Mature immunogenic (S03) (e), Monocytes/Macrophages – M2-like proliferative (S07) (f), Epithelial cells – Pro-inflammatory (SO4) (g), Fibroblasts – Pro-migratory-like (SO8) (h). Statistical comparisons are only shown for bottom panels and were performed using the Kruskal-Wallis test (n = 575). *p < 0.05, **p < 0.01, ***p < 0.001, ****p < 0.0001. Boxes denote the interquartile range with the line plotted as the median, whiskers show the 5 and 95 percentiles, and dots are individual samples outside this range. (i) Bar graphs show the percentage of patients (n = 40) who achieved pathological complete response following neoadjuvant treatment with paclitaxel combined with pembrolizumab in the I-SPY2 trial stratified by biomarker subgroups. Source data are provided as a Source Data file.
Fig. 6
Fig. 6. Comparison of laser capture microdissection (LCM) with bulk processing on biomarker expression, molecular subtyping, and prognostic classifiers.
a Photomicrographs depict examples of hematoxylin and eosin-stained resected tumor specimens with low, intermediate, or high tumor content represented in shaded annotations. Scale bars represent 2 mm length. Bar plots with individual data points show change in gene expression of PGR, ESR1, ERBB2, and MKI67 in specimens that were classified as IHC (immunohistochemistry) positive (b) or IHC negative (c). Error bars represent mean ± SEM. d Dot plots show the dynamic range of gene expression for each biomarker in LCM vs no LCM matched samples. Dotted lines represent the median. e Bar plots with individual data points showing expression of cell-type specific markers in LCM vs no LCM samples containing either low, intermediate, or high tumor content. Error bars represent mean ± SEM. Sankey diagrams illustrate change in mFISHseq consensus subtypes (f) and PAM50 risk of recurrence by subtype (ROR-S) classification (g) for LCM vs no LCM samples. All analyses were performed with a sample size of n = 41, except for panel (f), which was performed with n = 40 due to an indeterminate consensus subtype classification. Source data are provided as a Source Data file.
Fig. 7
Fig. 7. Single cell distribution and specificity of genes included in each multigene classifier.
Stacked bar graphs show the number of genes classified as Cell Enriched, Cell Enhanced, Cell Group Enriched, Cell Group Enhanced, Low Specificity, and Not detected using slightly modified criteria from The Human Protein Atlas (see Supplementary Methods). The distribution and specificity overview of the metadata from Supplementary Figs. 28–33 is provided for each classifier, including (a) mFISHseq, (b) AIMS, (c) PAM50 and PAM50 ROR-S, (d) OncotypeDX, (e) GENE70, and (f) GGI. Bars are colored based on the major cell type defined by The Human Protein Atlas portal. Source data are provided as a Source Data file.
Fig. 8
Fig. 8. Development and validation of a classifier for T-DM1 sensitivity.
a Univariate logistic regression analysis of 71 prespecified ADC-related genes/gene signatures and their association with pathologic complete response (pCR) in the T-DM1 arm of the I-SPY2 trial (n = 52). Significance was assessed using the likelihood ratio test. b The 19 genes/gene signatures selected in the multivariate logistic regression with elastic net modeling using 10-fold cross validation and their association with pCR. Green bars denote signatures associated with pCR; red bars indicate signatures associated with no pCR; black bars depict signatures not associated with either pCR or no pCR. c Receiver operating characteristic (ROC) curves showing performance of two T-DM1_pred classifiers in the test set relative to ERBB2 mRNA alone in the T-DM1 arm (n = 52). Univariate T-DM1_pred is a single score derived from all 19 features, while multivariate T-DM1_pred includes all 19 features in a multivariate regression model. d ROC curves showing performance of the T-DM1_pred classifier in the test set relative to ERBB2 mRNA alone in both the pertuzumab (n = 44) and taxane/anthracycline (n = 31) control arms. AUC, area under the curve. e Scatter plots showing the distribution of selected genes/gene signature scores of the T-DM1_pred classifier in patient samples (n = 52) according to pCR. Red lines denote the median. Statistical comparisons were performed using the Mann-Whitney test. *p < 0.05, **p < 0.01, ***p < 0.001, ****p < 0.0001. Source data are provided as a Source Data file.
Fig. 9
Fig. 9. Deployment of mFISHseq as a research-use only (RUO) test.
a Table outlining the number of genes and gene signatures and their relevant drug targets/pathways that were used for RUO testing. b Proportion of 48 patients according to treatment setting (left bar), consensus molecular subtype (middle bar, includes 58 samples total to account for 10 patients that had 2 subtypes collected by LCM), and TNBC subtype (right bar, contains 36 samples total comprised of 31 patients with 4 patients who had two subtypes collected by LCM and one patient that had both a primary and metastatic tumor analyzed). c Frequency of therapies that were recommended as the top three according to expression of genes and gene signatures tailored to each patient. Expression of 20 ADC antigen targets d as well as targets relevant to payloads for topoisomerase and microtubule inhibitors (e), endocytosis (f), lysosome activity (g), and resistance (h). The center line of the box and whisker plots represents the median, the box denotes the interquartile range, and the whiskers extend to the minimum and maximum values of the dataset. Dots show individual data points. i Examples of patients belonging to putative ADC treatment-responsive groups based on expression of ADC relevant biomarkers (shown as a percentile score). Patients 1, 18, 15, and 23 are predicted to respond to sacituzumab govitecan (SG), trastuzumab deruxtecan (T-DXd), both SG and T-DXd, and neither SG nor T-DXd, respectively. Note that these are hypothetical ADC treatment-responsive groups and no patients in the RUO cohort were recommended ADCs based on this framework. Source data are provided as a Source Data file.

Update of

References

    1. Yersal, O. & Barutca, S. Biological subtypes of breast cancer: Prognostic and therapeutic implications. World J. Clin. Oncol.5, 412–424 (2014). - PMC - PubMed
    1. Sørlie, T. et al. Gene expression patterns of breast carcinomas distinguish tumor subclasses with clinical implications. PNAS98, 10869–10874 (2001). - PMC - PubMed
    1. Sørlie, T. et al. Repeated observation of breast tumor subtypes in independent gene expression data sets. PNAS100, 8418–8423 (2003). - PMC - PubMed
    1. Perou, C. M. et al. Molecular portraits of human breast tumours. Nature406, 747–752 (2000). - PubMed
    1. Litton, J. K., Burstein, H. J. & Turner, N. C. Molecular testing in breast cancer. Am. Soc. Clin. Oncol. Educ. Book39, e1–e7 (2019). - PubMed

Publication types

MeSH terms