. 2025 Jan 2;16(1):33.
doi: 10.1038/s41467-024-55336-1.

Wearable electrodriven switch actively delivers macromolecular drugs to fundus in non-invasive and controllable manners

Affiliations

Wearable electrodriven switch actively delivers macromolecular drugs to fundus in non-invasive and controllable manners

Xuan Qin et al. Nat Commun. .

Abstract

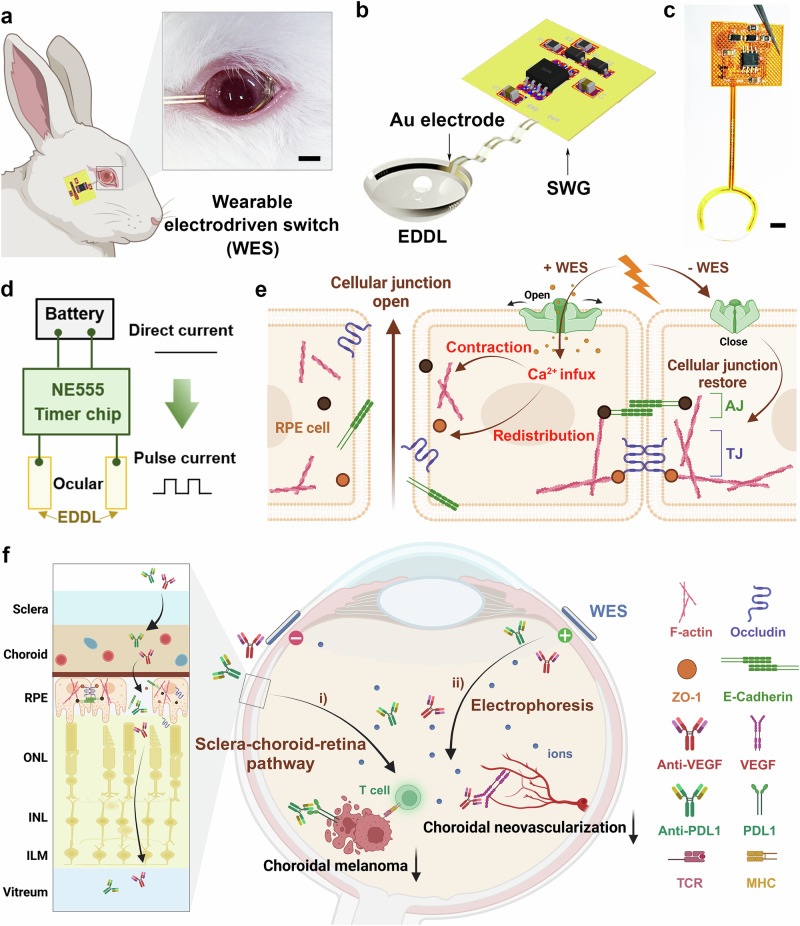
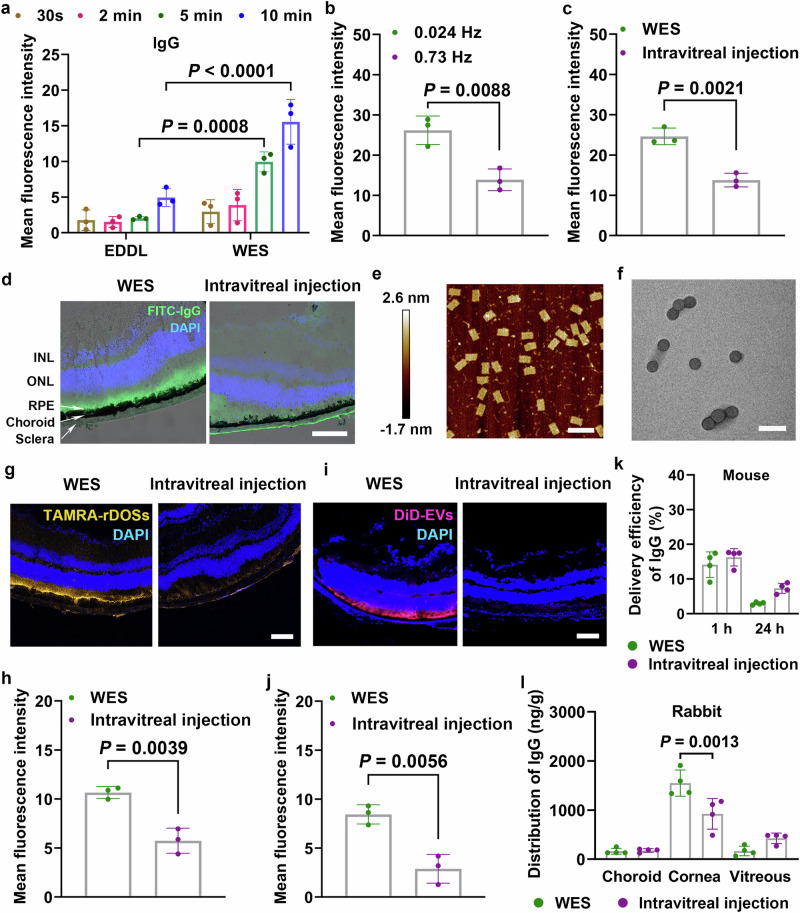
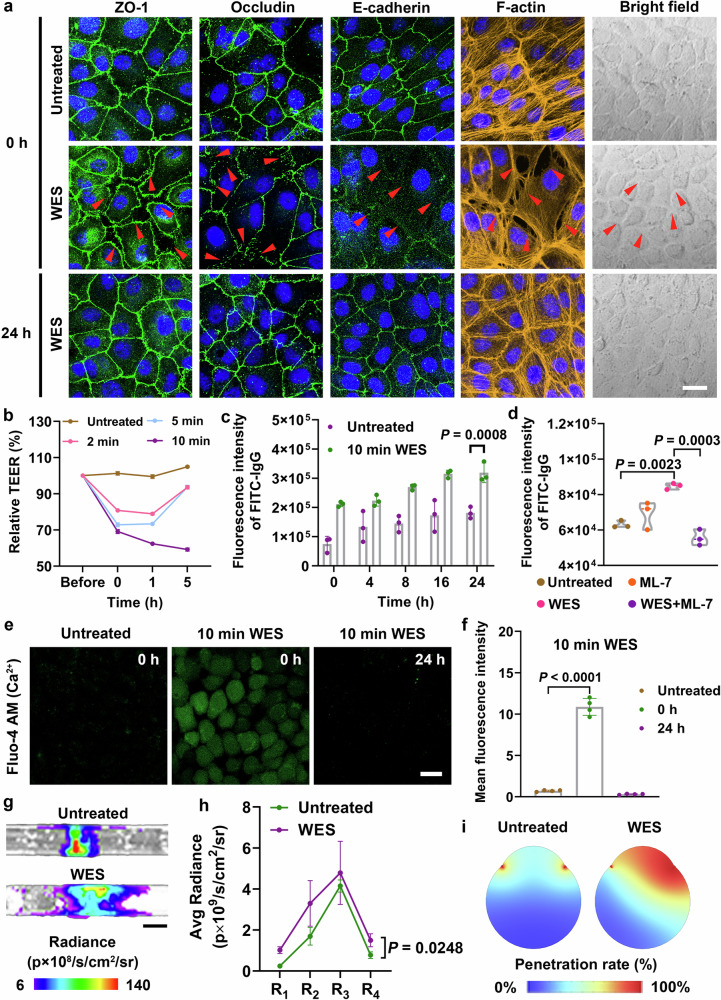
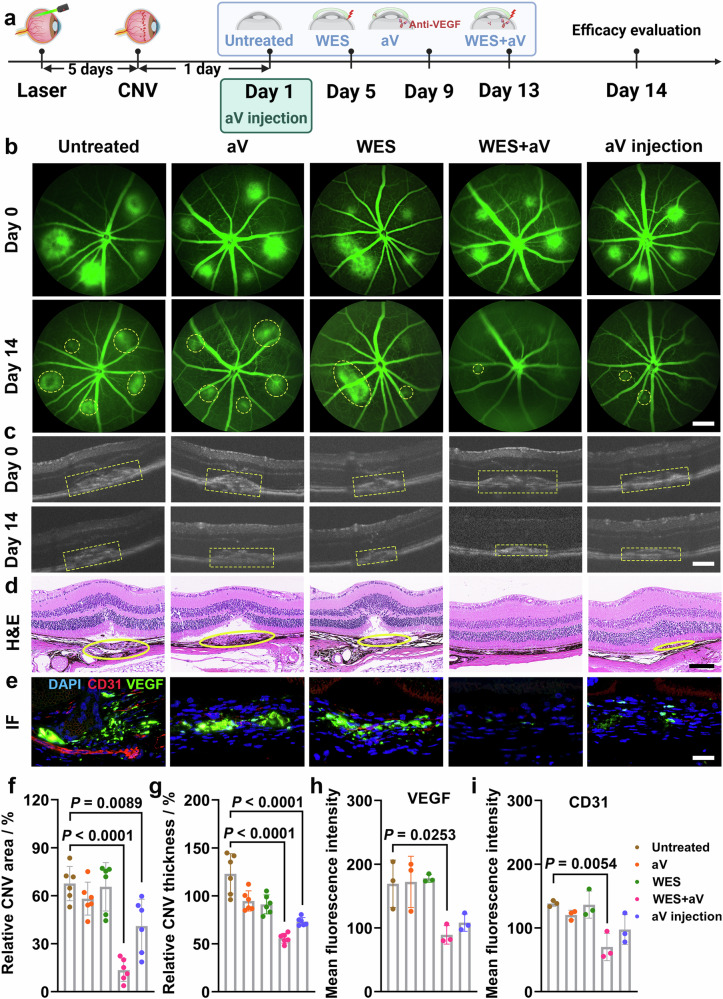
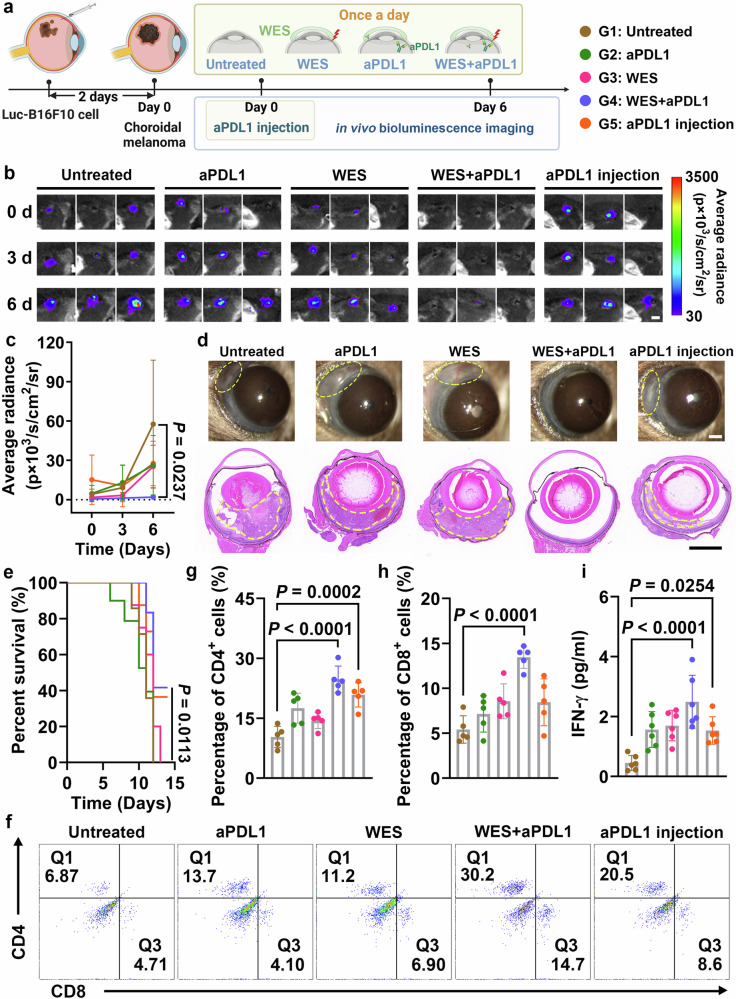
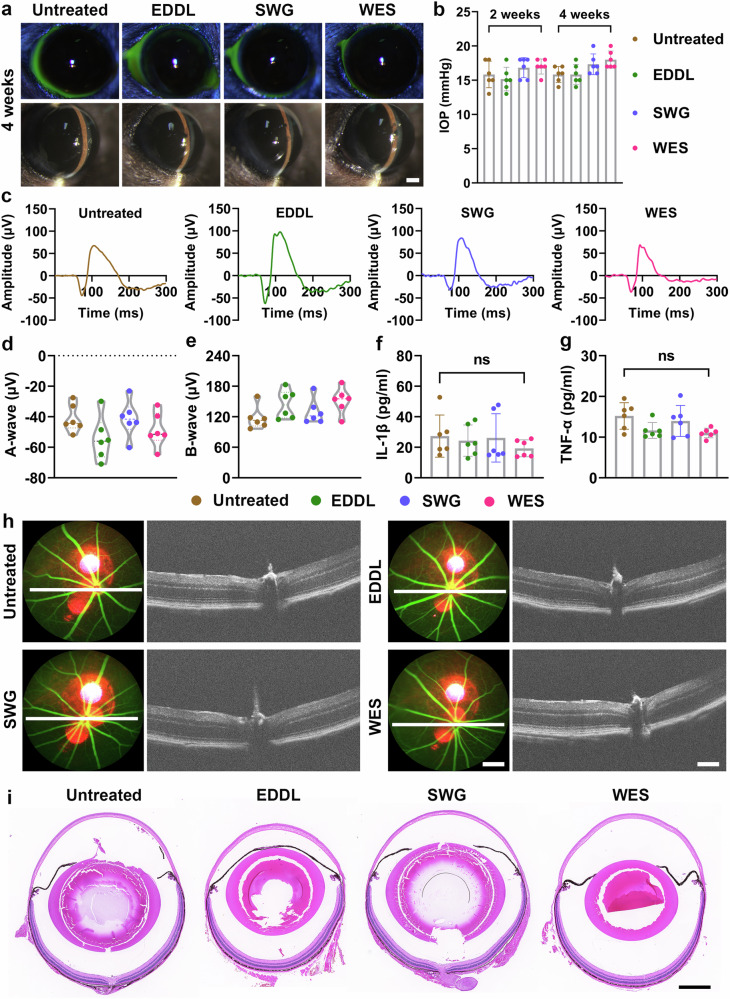
Current treatments for fundus disorders, such as intravitreal injections, pose risks, including infection and retinal detachment, and are limited in their ability to deliver macromolecular drugs across the blood‒retinal barrier. Although non-invasive methods are safer, their delivery efficiency remains suboptimal (<5%). We have developed a wearable electrodriven switch (WES) that improves the non-invasive delivery of macromolecules to the fundus. The WES system, which integrates an electrodriven drug delivery lens with a square wave generator, leverages electrical stimulation to enhance drug penetration through the sclera-choroid-retina pathway. In our study, WES achieved a delivery efficiency of 14% for immunoglobulin G, comparable to that of intravitreal injection (16%). Moreover, WES-enhanced anti-VEGF administration resulted in an 86% inhibition of choroidal neovascularization, and anti-PDL1 delivery inhibited choroidal melanoma growth more effectively than intravenous injections, with no adverse effects on ocular health. These findings suggest that WES holds transformative potential for the non-invasive treatment of chronic fundus diseases.


Conflict of interest statement

Competing interests: The authors declare no competing interests.

Figures

Fig. 1
Fig. 1. Design of wearable electrodriven switch (WES) for enhancing macromolecular drug delivery to the fundus.
a Optical image of the EDDL used to deliver electrical stimulation to the sclera of the rabbit eye. Scale bar, 4 mm. b Structural diagram of the WES. The WES system consists of the EDDL and the SWG. The SWG is mounted on a flexible polyimide (PI) substrate and is responsible for generating monophasic square pulse current (PC) to facilitate electrical stimulation. The Au electrode is embedded within a polydimethylsiloxane (PDMS) lens, produced through cast moulding at ambient temperature, forming the EDDL. c Optical image of the WES. Scale bar, 500 µm. d Block illustrating the working principle of the WES. The SWG, powered by a lithium-ion battery, converts direct current (DC) into monophasic square PC signals using an NE555-type timer chip integrated into the circuit design. The frequency and duty cycle of these output signals are modifiable via a multilayer ceramic capacitor and two ceramic resistors embedded in the flexible printed circuit. The stable electrical output from the SWG is conveyed to the EDDL, which makes contact with the sclera to enable stimulation. e, f Mechanism of WES-boosted macromolecular drug delivery to the fundus. WES enhances the efficiency of macromolecular drug delivery to the fundus through the sclera-choroid-retina pathway via two main mechanisms, namely, the reversible opening of the outer blood-retinal barrier (e) and electrophoresis effects (f). MHC, major histocompatibility complex. TCR, T cell receptor. ZO-1, zonula occludens-1. F-actin, filamentous actin. Prof. Houyu Wang established the cartoons.
Fig. 2
Fig. 2. The capability of WES to deliver macromolecular drugs to fundus.
a Statistical analysis showing the distribution of FITC-IgG in the fundus after varying WES durations (n = 3 biological replicates). The exact P-value between the EDDL and WES group at 10 min was 2.67 × 10−5. b Statistical analysis showing the distribution of FITC-IgG in eyeballs subjected to different frequencies of WES (n = 3 biological replicates). c Statistical analysis showing the distribution of FITC-IgG in eyeballs delivered by WES and intravitreal injection, respectively (n = 3 biological replicates). d Representative confocal images illustrating the distribution of FITC-IgG in the fundus following WES and intravitreal injection delivery, respectively. Scale bar, 100 µm. INL, inner nuclear layer. ONL, outer nuclear layer. e, f Morphological of the rDOSs (e) and EVs (f). Scale bar, 200 nm. g, h Representative confocal images (g) and statistical analyses (h) illustrating the distribution of TAMRA-rDOSs in the fundus following WES and intravitreal injection delivery, respectively (n = 3 biological replicates). Scale bar, 100 µm. i, j Representative confocal images (i) and statistical analyses (j) illustrating the distribution of DiD-EVs in the fundus following WES and intravitreal injection delivery, respectively (n = 3 biological replicates). k Comparative analysis of IgG delivery efficiency in mouse eyeballs after 10 min WES and intravitreal injection at 1 h and 24 h (n = 4 biological replicates). l Distribution of IgG in the rabbit eye choroid, cornea, and vitreous 1 h post-10 min WES and intravitreal injection delivery (n = 4 biological replicates). The data were presented as the means ± standard deviations (SDs). Error bars = SD. P-values in (a) and (l) were calculated via one-way ANOVA with a Tukey post-hoc test. P-values in (b), (c), (h) and (j) were calculated via an unpaired two-tailed t test. Every imaging experiment was conducted three times, yielding findings that were similar each time. P < 0.05 was shown. Source data are provided as a Source data file.
Fig. 3
Fig. 3. The mechanism of WES to enhance macromolecular drug delivery to fundus.
a Representative immunofluorescence images illustrating the distribution of tight junction (TJ)- and adherens junction (AJ)-associated proteins, including ZO-1 (green), Occludin (green), E-Cadherin (green) and F-actin (yellow), following 10 min WES at 0 h and 24 h. Blue, DAPI-labelled cell nuclei. Scale bar, 20 µm. b Changes in the transepithelial electrical resistance (TEER) of ARPE-19 cells subjected to different durations of WES (n = 3 biological replicates). c Bar graphs showing the fluorescence intensity of FITC-IgG crossing ARPE-19 cell monolayers into the lower chamber of the Transwell system under various conditions (n = 3 biological replicates). d Comparative analysis of the fluorescence intensity of FITC-IgG in the lower chamber of the Transwell at 3 h posttreatment (n = 3 biological replicates). WES + ML-7: group treated with a combination of the ML-7 inhibitor and 10 min WES. e Representative fluorescence images of intracellular Ca2+ in ARPE-19 cells, as indicated by the Fluo-4 AM probe, after 0 h and 24 h of 10 min WES treatment. Scale bar, 20 µm. f Statistical analysis of the mean fluorescence intensity indicating the dynamic changes in intracellular Ca2+ over a 24 h period after 10 min of WES (n = 4 biological independent experiments). The exact P-value between the Untreated and 0 h group was 3.79 × 10−9. g Representative fluorescence imaging of DiD-EVs in simulated vitreous fluid treated with 10 min WES and via free diffusion. Scale bar, 5 mm. h Statistical analysis of mean fluorescence intensity in four regions in the pipeline after different treatments (n = 3 biological replicates). i Finite element model results depicting drug distribution in eyeballs delivered by 10 min WES or untreated group. The data were presented as the means ± SDs. Error bars = SD. P-values in (c, d, f) were calculated via one-way ANOVA with a Tukey post-hoc test. P-value in (h) was calculated via a paired two-tailed t test. Every imaging experiment was conducted three times, yielding findings that were similar each time. P < 0.05 was shown. Source data are provided as a Source data file.
Fig. 4
Fig. 4. Therapeutic effects of WES in a laser-induced CNV mouse model.
a Diagram illustrating the construction of laser-induced CNV mouse models and various treatments. b Representative FFA images showing individual CNV lesions in mice before and after different treatments, with yellow circles indicating CNV lesion areas. Scale bar, 10 µm. c Representative OCT images displaying individual CNV lesions in mice before and after treatment, with the yellow rectangular box indicating CNV lesion thickness. Scale bar, 100 µm. d Representative H&E-stained retinal slices used to assess laser-induced CNV lesions in mice, with yellow circles highlighting CNV lesion thickness. Scale bar, 100 µm. e Representative IF images of VEGF (green) and CD31 (yellow) in the retinas of CNV-bearing mice (blue, DAPI-labelled cell nuclei). Scale bar, 50 µm. f Quantitative analysis of the relative CNV area before and after 14 days of treatment in five groups (n = 6 mice per group). The exact P-value between the Untreated and WES + aV group was 6.85 × 10−7. g Quantitative analysis of relative CNV thickness before and after 14 days of treatment in five groups (n = 6 mice per group). The exact P-value between the Untreated and WES + aV group was 3.70 × 10−9. The exact P-value between the Untreated and aV injection group was 9.97 × 10−7. h, i Quantitative analysis of the mean fluorescence intensity of VEGF (h) and CD31 (i) in five groups (n = 3 biological replicates) after 14 days of treatment. The data were presented as the means ± SDs. The error bars represent the SDs. P-values in (fi) were calculated via one-way ANOVA with a Tukey post-hoc test. Every imaging experiment was conducted three times, yielding findings that were similar each time. P < 0.05 was shown. Prof. Houyu Wang established the cartoons. Source data are provided as a Source data file.
Fig. 5
Fig. 5. Therapeutic effects of WES in choroidal melanoma.
a Diagram illustrating the creation of choroidal melanoma mouse models and various treatment methods. b Representative in vivo bioluminescence images of mice with Luc-B16F10 choroidal melanoma after different treatments. Scale bar, 4 mm. c Statistical analysis of average bioluminescence signal intensity in tumours over 6 days following various treatments (n = 5 mice per group). d Slit lamp photomicrographs and H&E staining of tumours on day 6 posttreatment, with tumours circled in yellow. Scale bar of slit lamp photomicrographs, 500 µm. Scale bar of H&E staining, 200 µm. e Survival rates of the mice after different treatments. f Representative flow cytometry analysis of CD8+ and CD4+ T cells collected from mouse eyes on day 6. g, h Statistical analysis of percentages of CD4+ (g) and CD8+ (h) T cells among CD3+ cells via flow cytometry (n = 5 mice per group). The exact P-value between the Untreated and WES + aPDL1 group in (g) was 2.46 × 10−6. The exact P-value between the Untreated and aPDL1 injection group in (h) was 1.72 × 105. i Statistical analysis of IFN-γ concentrations in choroidal melanoma after different treatments via ELISA kits (n = 6 mice per group). The exact P-value between the Untreated and WES + aPDL1 group was 1.96 × 105. The data are presented as the means ± SDs. The error bars represent the SDs. P-values in (c, gi) were calculated via one-way ANOVA with a Tukey post-hoc test. The P-value in (e) was calculated via the Log-rank test of survival curves. Every imaging experiment was conducted three times, yielding findings that were similar each time. P < 0.05 was shown. Prof. Houyu Wang created the cartoons. Source data are provided as a Source data file.
Fig. 6
Fig. 6. In vitro and in vivo safety assessment of WES.
a Representative images of fluorescein cornea staining and slit lamp microscopy in different groups over one month. Scale bar, 500 µm. b Statistical analysis of intraocular pressures (IOPs) in mouse eyes after 4 weeks of various treatments (n = 6 mice per group). ce Representative electroretinography (ERG) recordings (c) and statistical analysis of A-wave (d) and B-wave (e) amplitudes across the four groups after one month (n = 6 mice per group). f, g Quantitative analysis of the inflammatory cytokines IL-1β (f) and TNF-α (g) in the eyes of each group after 4 weeks (n = 6 mice per group). P-values in (f) and (g) were calculated via one-way ANOVA with a Tukey post-hoc test. h Representative FFA and OCT images of the groups after 4 weeks, with the FFA scale bar at 10 µm and the OCT scale bar at 100 µm. i Representative H&E-stained slices of eyeballs collected from mice in different groups. Scale bar, 200 µm. The data were presented as the means ± SDs. All imaging experiments were repeated three times with similar results. Source data are provided as a Source data file.

Similar articles

Cited by

References

    1. Fleckenstein, M. et al. Age-related macular degeneration. Nat. Rev. Dis. Primers.7, 31 (2021). - PubMed
    1. Wong, T. Y. et al. Diabetic retinopathy. Nat. Rev. Dis. Primers.2, 16012 (2016). - PubMed
    1. Falkenberg, K. D. et al. The metabolic engine of endothelial cells. Nat. Metab.1, 937–946 (2019). - PubMed
    1. Ferrara, N. Vascular endothelial growth factor and age-related macular degeneration: from basic science to therapy. Nat. Med.16, 1107–1111 (2010). - PubMed
    1. Tian, Y. et al. Reduction of choroidal neovascularization via cleavable VEGF antibodies conjugated to exosomes derived from regulatory T cells. Nat. Biomed. Eng.5, 968–982 (2021). - PubMed

Publication types

MeSH terms

Substances

LinkOut - more resources