

CHST3, PGBD5, and SLIT2 can be identified as potential genes for the diagnosis and treatment of osteoporosis and sarcopenia
- PMID: 39747879
- PMCID: PMC11696926
- DOI: 10.1038/s41598-024-83231-8
CHST3, PGBD5, and SLIT2 can be identified as potential genes for the diagnosis and treatment of osteoporosis and sarcopenia
Abstract
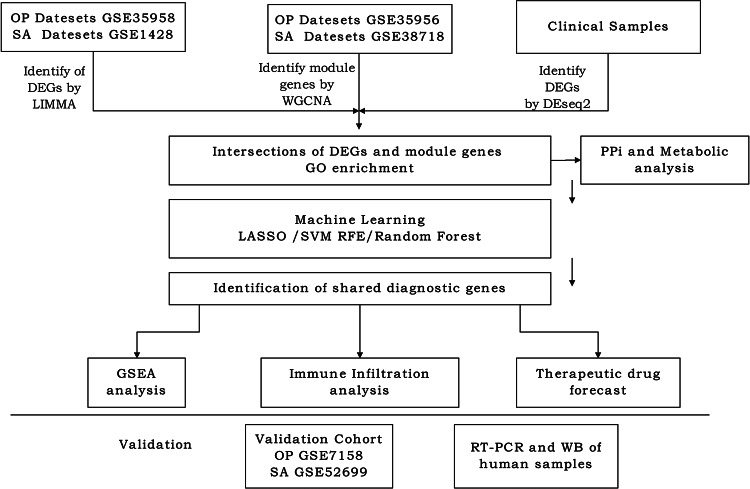
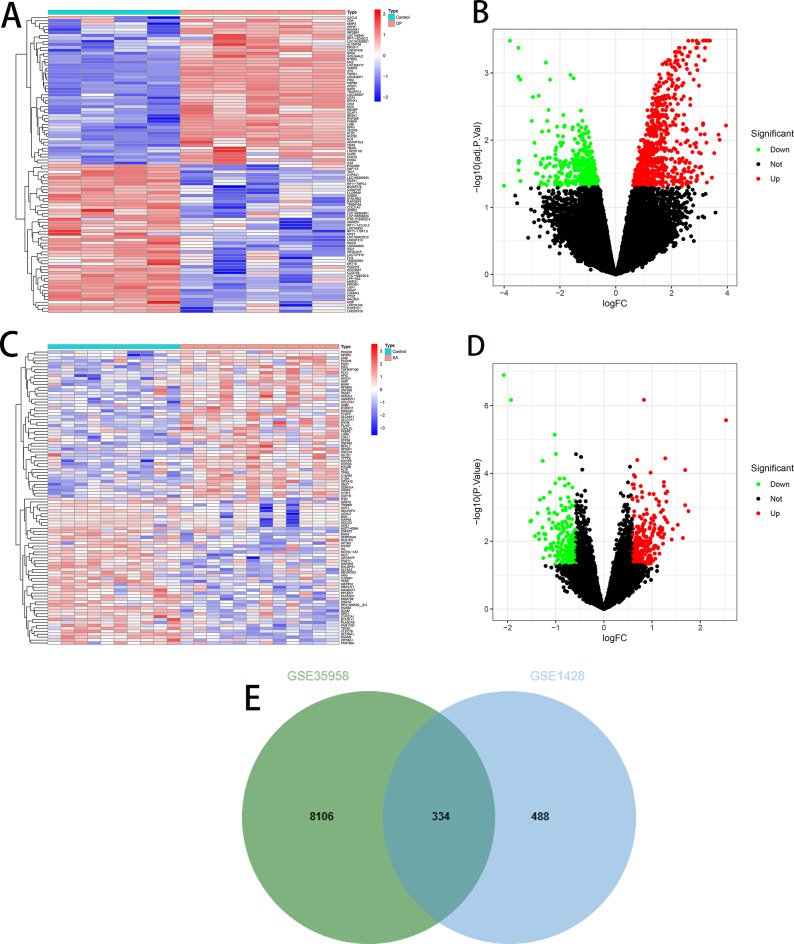
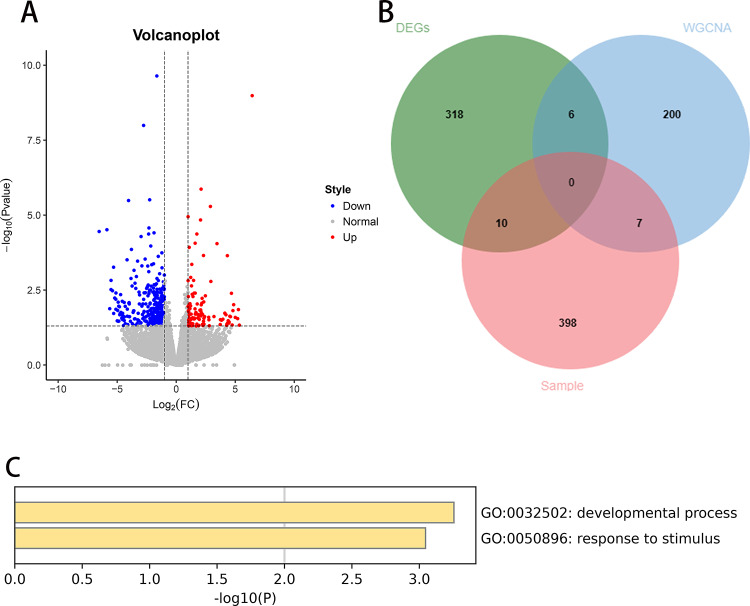
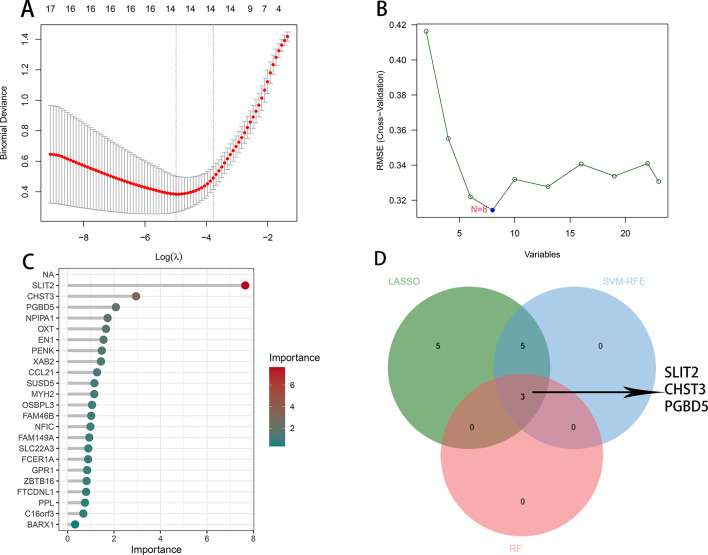
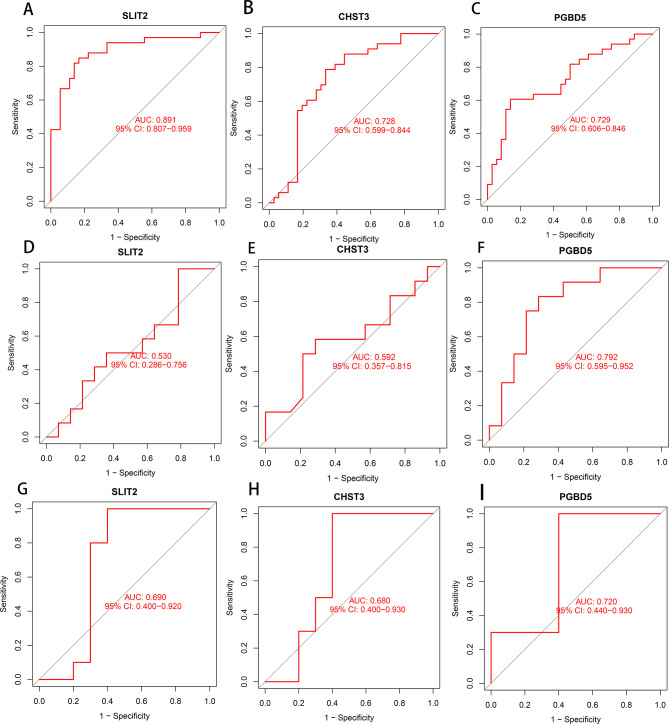
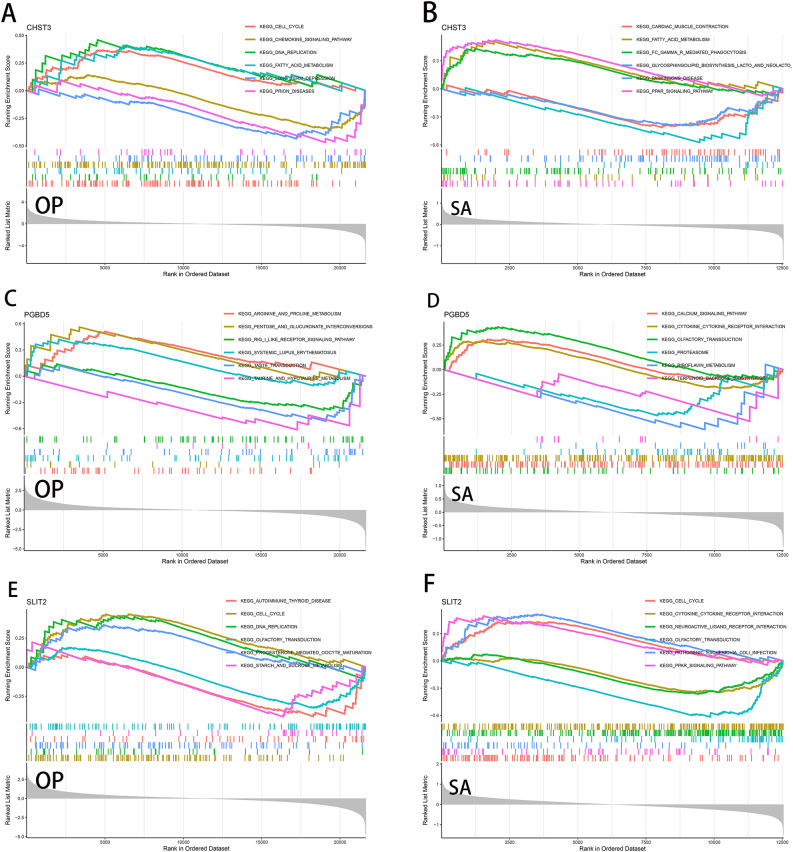
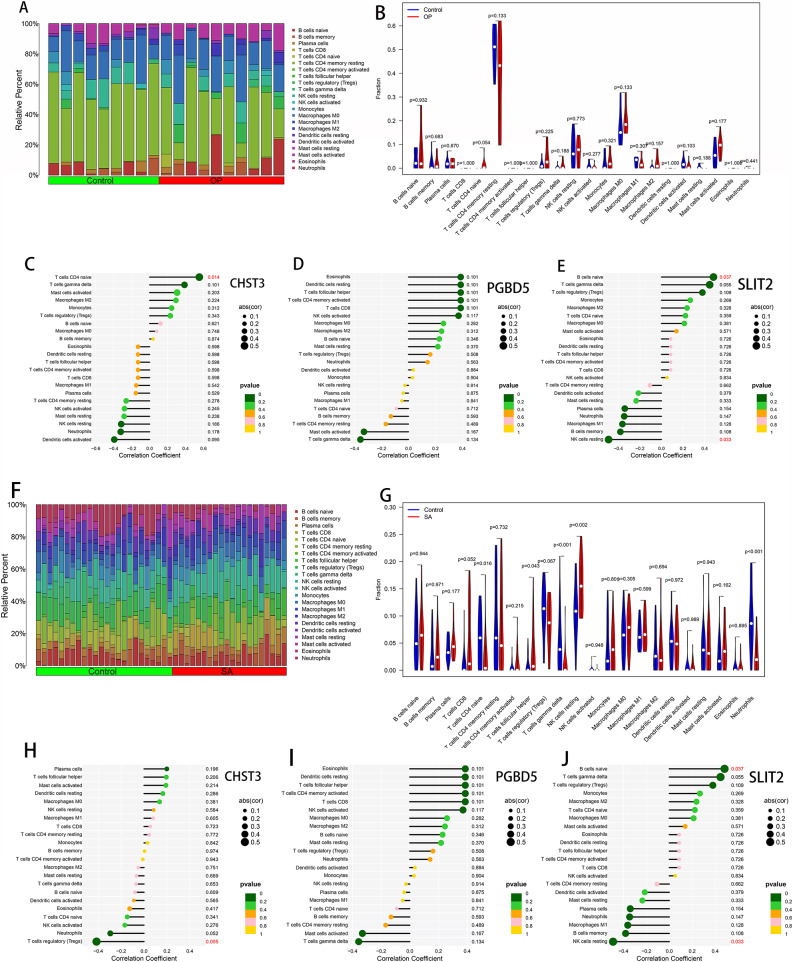
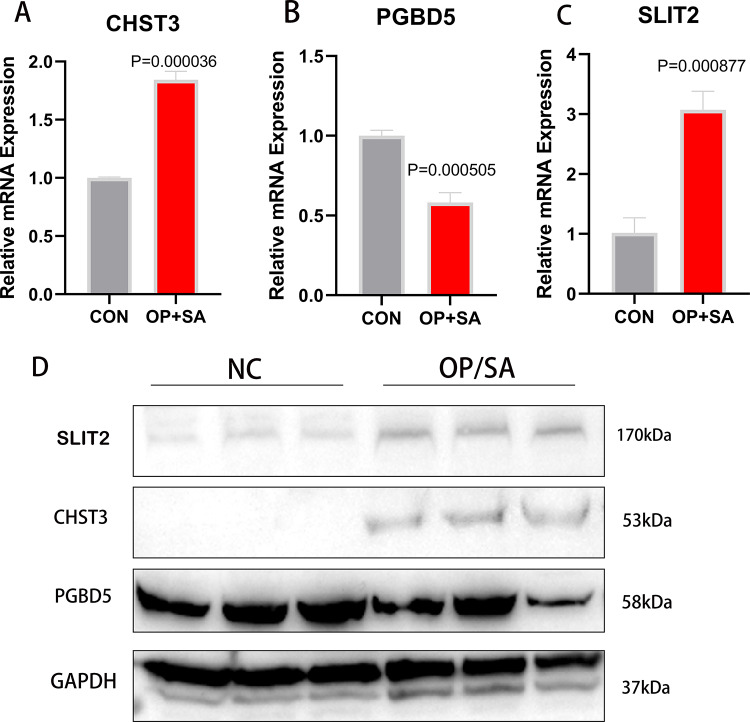
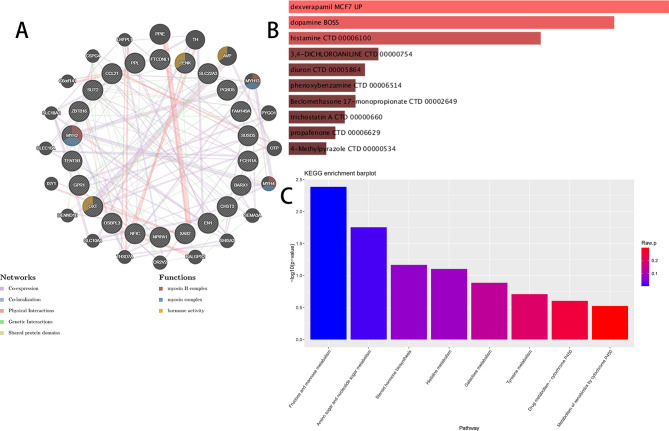
Osteoporosis and sarcopenia are common diseases in the older. This study aims to use transcriptomics and explore common diagnostic genes of osteoporosis and sarcopenia and predict potentially effective treatment drugs. Three datasets for osteoporosis and sarcopenia were downloaded from the GEO database, and transcriptome sequencing was performed on clinical samples. A total of 23 differentially expressed genes (DEGs) were selected using the LIMMA, WGCNA, and the DEseq2 package. Three machine learning methods were employed to determine the final common diagnostic genes for the diseases. Receiver operating characteristic (ROC) curves were used to evaluate the predictive performance of genes. Single-gene enrichment analysis (GSEA), immune infiltration abundance calculation, and related metabolic analysis were used to study the pathogenesis of the two diseases. Finally, the CMap database was used to predict potential therapeutic drugs for the diseases, and further validation was conducted through RT-PCR and WB. Three genes for the diseases CHST3, PGBD5, and SLIT2 were identified, showing good predictive performance in both internal and external validations. GSEA analysis revealed that genes were enriched primarily in pathways related to cell cycle regulation, fatty acid metabolism, DNA replication, and carbohydrate synthesis. CHST3 and SLIT2 were involved in the immune response, but PGBD5 seemed unrelated to the immune response. Potential therapeutic drugs were predicted, and the RT-PCR, WB results further validated our hypotheses. CHST3, PGBD5, and SLIT2 can serve as potential genes for the diagnosis and treatment of osteoporosis and sarcopenia; furthermore, these results provide new clues for further experimental research and treatment.
Keywords: Diagnostic genes; Osteoporosis; Pathogenesis; Sarcopenia; Transcriptomics.
© 2024. The Author(s).
Conflict of interest statement
Declarations. Competing interests: The authors declare no competing interests. Ethics approval and consent to participate: This study was approved by the Ethics Committee of the Affiliated Fifth People’s Hospital of Chengdu University of Traditional Chinese Medicine (Approval Number: Ethical Review 2023-013-Science 01). Prior to the commencement of the experiment, the patients were informed about precautions and signed a written informed consent form.
Figures


Similar articles
-
Identification of shared key genes and pathways in osteoarthritis and sarcopenia patients based on bioinformatics analysis.Zhong Nan Da Xue Xue Bao Yi Xue Ban. 2025 Mar 28;50(3):430-446. doi: 10.11817/j.issn.1672-7347.2025.240669. Zhong Nan Da Xue Xue Bao Yi Xue Ban. 2025. PMID: 40628511 Chinese, English.
-
Identification of osteoporosis ferroptosis-related markers and potential therapeutic compounds based on bioinformatics methods and molecular docking technology.BMC Med Genomics. 2024 Apr 22;17(1):99. doi: 10.1186/s12920-024-01872-0. BMC Med Genomics. 2024. PMID: 38650009 Free PMC article.
-
Deciphering Shared Gene Signatures and Immune Infiltration Characteristics Between Gestational Diabetes Mellitus and Preeclampsia by Integrated Bioinformatics Analysis and Machine Learning.Reprod Sci. 2025 Jun;32(6):1886-1904. doi: 10.1007/s43032-025-01847-1. Epub 2025 May 15. Reprod Sci. 2025. PMID: 40374866
-
Clinical symptoms, signs and tests for identification of impending and current water-loss dehydration in older people.Cochrane Database Syst Rev. 2015 Apr 30;2015(4):CD009647. doi: 10.1002/14651858.CD009647.pub2. Cochrane Database Syst Rev. 2015. PMID: 25924806 Free PMC article.
-
Signs and symptoms to determine if a patient presenting in primary care or hospital outpatient settings has COVID-19.Cochrane Database Syst Rev. 2022 May 20;5(5):CD013665. doi: 10.1002/14651858.CD013665.pub3. Cochrane Database Syst Rev. 2022. PMID: 35593186 Free PMC article.
References
Publication types
MeSH terms
Substances
Grants and funding
LinkOut - more resources
Full Text Sources
Medical
Miscellaneous
