

Structural characterization of two γδ TCR/CD3 complexes
- PMID: 39747888
- PMCID: PMC11697310
- DOI: 10.1038/s41467-024-55467-5
Structural characterization of two γδ TCR/CD3 complexes
Abstract
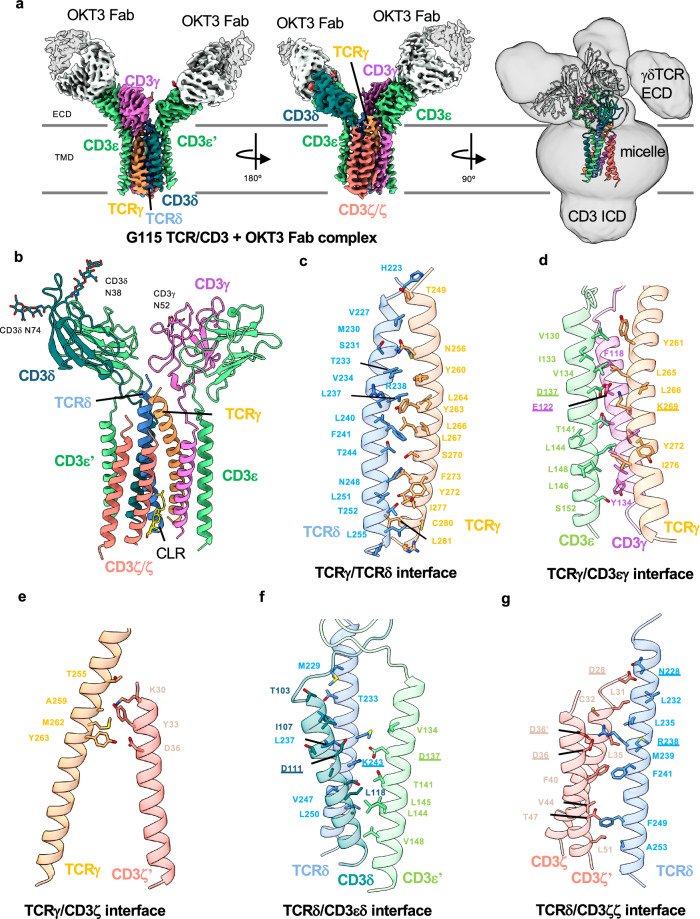
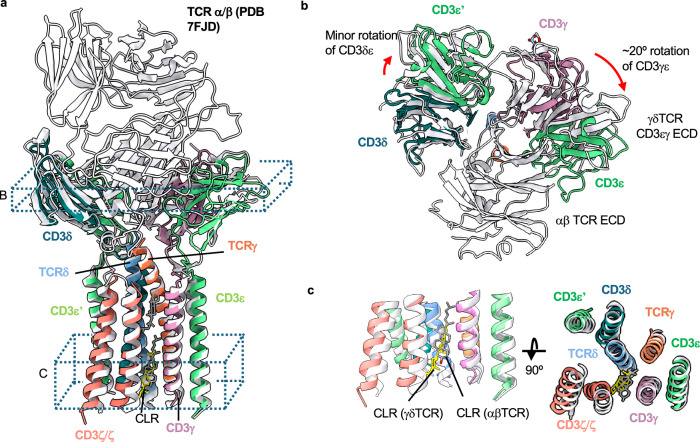
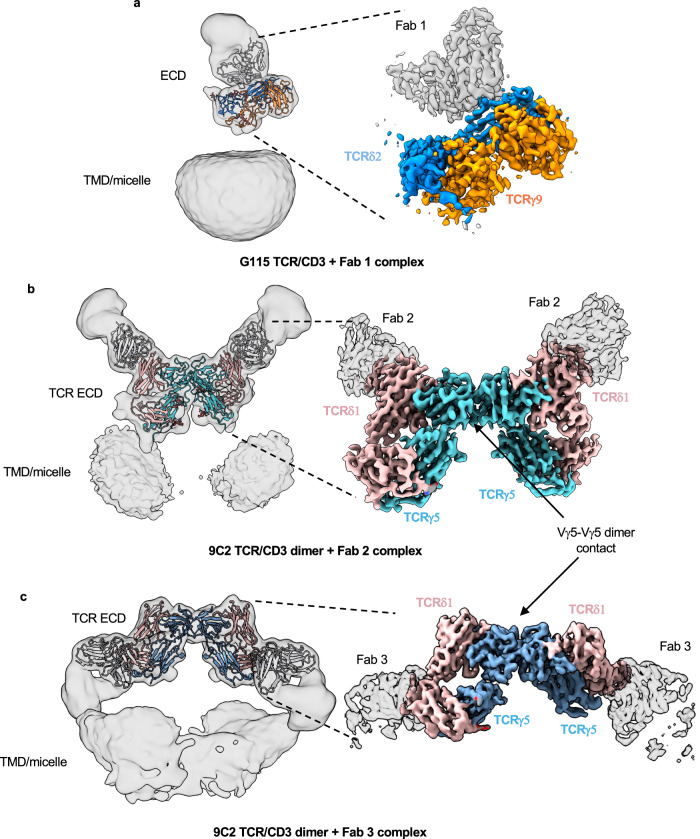
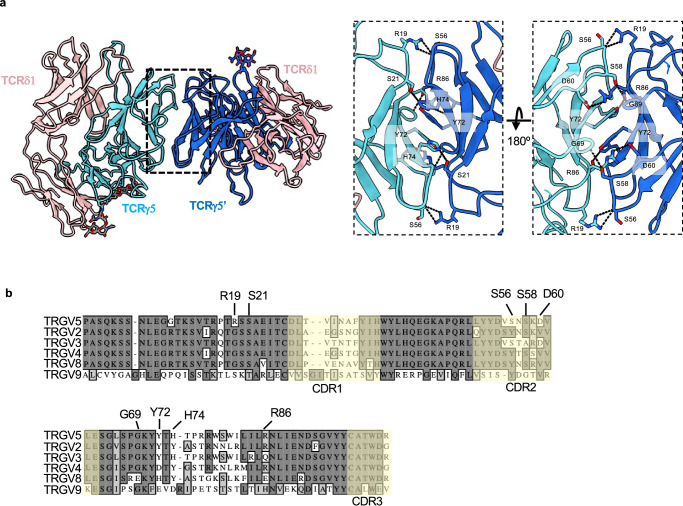
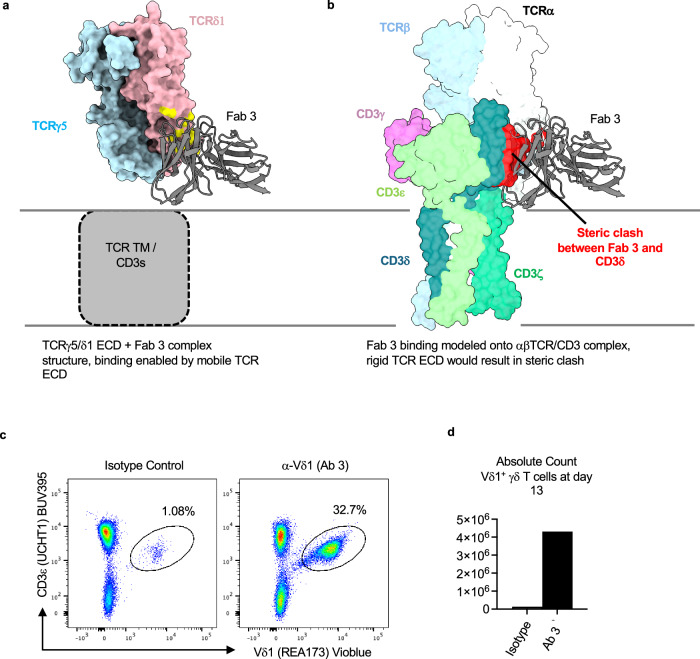
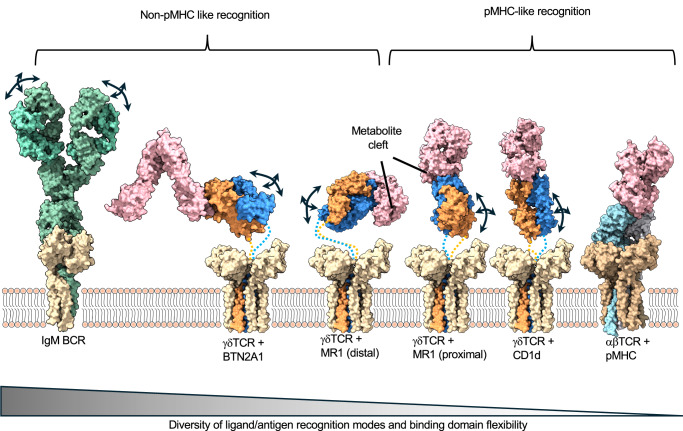
The T-cell receptor (TCR)/CD3 complex plays an essential role in the immune response and is a key player in cancer immunotherapies. There are two classes of TCR/CD3 complexes, defined by their TCR chain usage (αβ or γδ). Recently reported structures have revealed the organization of the αβ TCR/CD3 complex, but similar studies regarding the γδ TCR/CD3 complex have lagged behind. Here, we report cryoelectron microscopy (cryoEM) structural analysis of two γδ TCRs, G115 (Vγ9 Vδ2) and 9C2 (Vγ5 Vδ1), in complex with CD3 subunits. Our results show that the overall subunit organization of the γδ TCR/CD3 complexes is similar to αβ TCRs. However, both γδ TCRs display highly mobile extracellular domains (ECDs), unlike αβ TCRs, which have TCR ECDs that are rigidly coupled to its transmembrane (TM) domains. We corroborate this finding in cells by demonstrating that a γδ T-cell specific antibody can bind a site that would be inaccessible in the more rigid αβ TCR/CD3 complex. Furthermore, we observed that the Vγ5 Vδ1 complex forms a TCR γ5 chain-mediated dimeric species whereby two TCR/CD3 complexes are assembled. Collectively, these data shed light on γδ TCR/CD3 complex formation and may aid the design of γδ TCR-based therapies.
© 2024. The Author(s).
Conflict of interest statement
Competing interests: All authors are employees of Regeneron Pharmaceuticals and own options and/or stock. JCL and WCO are officers of Regeneron Pharmaceuticals.
Figures
Similar articles
-
Structure of a fully assembled γδ T cell antigen receptor.Nature. 2024 Oct;634(8034):729-736. doi: 10.1038/s41586-024-07920-0. Epub 2024 Aug 15. Nature. 2024. PMID: 39146975 Free PMC article.
-
Structures of human γδ T cell receptor-CD3 complex.Nature. 2024 Jun;630(8015):222-229. doi: 10.1038/s41586-024-07439-4. Epub 2024 Apr 24. Nature. 2024. PMID: 38657677 Free PMC article.
-
Iron overload in HFE-related hemochromatosis severely impairs Vδ2+ γδ T-cell homeostasis.Blood. 2025 Jul 10;146(2):219-232. doi: 10.1182/blood.2024025345. Blood. 2025. PMID: 40163804
-
αβ and γδ T cell receptors: Similar but different.J Leukoc Biol. 2020 Jun;107(6):1045-1055. doi: 10.1002/JLB.2MR1219-233R. Epub 2020 Jan 29. J Leukoc Biol. 2020. PMID: 31994778 Review.
-
Systemic treatments for metastatic cutaneous melanoma.Cochrane Database Syst Rev. 2018 Feb 6;2(2):CD011123. doi: 10.1002/14651858.CD011123.pub2. Cochrane Database Syst Rev. 2018. PMID: 29405038 Free PMC article.
Cited by
-
Disrupting the balance between activating and inhibitory receptors of γδT cells for effective cancer immunotherapy.Nat Rev Cancer. 2025 Aug;25(8):590-612. doi: 10.1038/s41568-025-00830-x. Epub 2025 Jun 2. Nat Rev Cancer. 2025. PMID: 40456901 Review.
-
The Structural Biology of T-Cell Antigen Detection at Close Contacts.Immunol Rev. 2025 May;331(1):e70014. doi: 10.1111/imr.70014. Immunol Rev. 2025. PMID: 40181535 Free PMC article. Review.
-
Gamma delta T cells and their immunotherapeutic potential in cancer.Biomark Res. 2025 Mar 28;13(1):51. doi: 10.1186/s40364-025-00762-6. Biomark Res. 2025. PMID: 40148988 Free PMC article. Review.
-
Three-Dimensional Modeling of Camelus dromedarius T Cell Receptor Gamma (TRG)_Delta (TRD)/CD1D Complex Reveals Different Binding Interactions Depending on the TRD CDR3 Length.Antibodies (Basel). 2025 May 29;14(2):46. doi: 10.3390/antib14020046. Antibodies (Basel). 2025. PMID: 40558100 Free PMC article.
-
Harnessing the immunotherapeutic potentials of gamma delta T cells against hematological malignancies.Hemasphere. 2025 Aug 7;9(8):e70182. doi: 10.1002/hem3.70182. eCollection 2025 Aug. Hemasphere. 2025. PMID: 40785982 Free PMC article. Review.
References
-
- Triebel, F. et al. A novel human V delta gene expressed predominantly in the Ti gamma A fraction of gamma/delta+ peripheral lymphocytes. Eur. J. Immunol.18, 2021–2027 (1988). - PubMed
Publication types
MeSH terms
Substances
Associated data
- Actions
- Actions
- Actions
- Actions
LinkOut - more resources
Full Text Sources
