. 2025 Jan 2;16(1):201.
doi: 10.1038/s41467-024-55755-0.

Orthologous marker groups reveal broad cell identity conservation across plant single-cell transcriptomes

Affiliations

Orthologous marker groups reveal broad cell identity conservation across plant single-cell transcriptomes

Tran N Chau et al. Nat Commun. .

Abstract

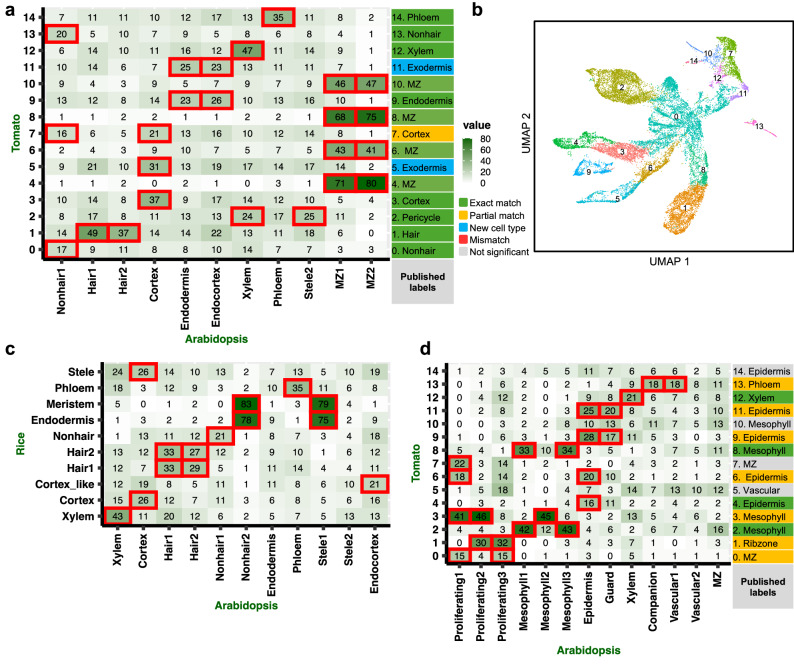
Single-cell RNA sequencing (scRNA-seq) is widely used in plant biology and is a powerful tool for studying cell identity and differentiation. However, the scarcity of known cell-type marker genes and the divergence of marker expression patterns limit the accuracy of cell-type identification and our capacity to investigate cell-type conservation in many species. To tackle this challenge, we devise a novel computational strategy called Orthologous Marker Gene Groups (OMGs), which can identify cell types in both model and non-model plant species and allows for rapid comparison of cell types across many published single-cell maps. Our method does not require cross-species data integration, while still accurately determining inter-species cellular similarities. We validate the method by analyzing published single-cell data from species with well-annotated single-cell maps, and we show our methods can capture majority of manually annotated cell types. The robustness of our method is further demonstrated by its ability to pertinently map cell clusters from 1 million cells, 268 cell clusters across 15 diverse plant species. We reveal 14 dominant groups with substantial conservation in shared cell-type markers across monocots and dicots. To facilitate the use of this method by the broad research community, we launch a user-friendly web-based tool called the OMG browser, which simplifies the process of cell-type identification in plant datasets for biologists.


Conflict of interest statement

Competing interests: The authors declare no competing interests.

Figures

Fig. 1
Fig. 1. The OMG pipeline and dataset.
a Cell type annotation in three steps: (1) identify the top 200 marker genes for each cell cluster. (2) use OrthoFinder to generate orthologous gene groups for different species. (3) perform a pairwise comparison using an overlapping orthologous marker gene (OMG) and Fisher’s exact test to identify clusters with significant shared OMGs, helping identify cell type for a query sample. b The bar chart shows the number of tissues, cell types, and cells across 15 species. The x-axis lists the species. The y-axis on the left side of the plot represents the number of tissues and cell types, ranging from 0 to 80. The y-axis on the right side represents the number of cells, with values scaling up to 400k. Each plant has three bars colored in red, purple, and blue, representing the number of tissues, cell types, and cells respectively. The exact number of tissues, cell types, and cells for each species is displayed at the top of each column.
Fig. 2
Fig. 2. Cell type identification in another plant species.
a Using Arabidopsis OMGs to predict tomato root cell types. Each box displays the number of conserved OMGs between the two cell types being compared. The red highlighted boxes indicate FDR-adjusted p < 0.01 based on the Fisher’s exact upper-tailed test. Labels on the right indicate the cell type labels based on published annotation. b UMAP of 15 default tomato root clusters. Specifically, we merge all the meristematic zones (clusters 4, 6, 8, 10, in a) into a single cluster (cluster MZ). Similarly, we have recreated the cortex, hair, and non-hair clusters based on the original assignment in the published study. c Pairwise comparison of cell clusters from rice and Arabidopsis, with the number in each cell reflecting common OMGs between clusters, darker colors indicate more OMGs and red boxes highlight significant overlapping (adjust p value < 0.01). The 9 matched clusters are marked by a black star (*). The putative meristematic clusters are marked by two red stars (**). The heatmap demonstrates the OMG method’s specificity: for instance, the Arabidopsis xylem cluster shares 43, 15, and 24 OMGs with rice’s xylem, cortex, and stele clusters respectively, but only the xylem-to-xylem comparison shows significant overlap by the Fisher’s exact upper-tailed test. d The heatmap shows prediction of tomato shoot clusters (y-axis) using Arabidopsis shoot OMGs (x-axis). Numbers in each cell represent shared OMGs between clusters. Red boxes indicate significant sharing between Arabidopsis and tomato clusters, tested by the Fisher’s exact test. Published tomato cell-type labels are shown on the right (0–14). The match between predicted and published labels is indicated by green boxes (full match), yellow boxes (partial match), and gray boxes (non-significant by statistical test).
Fig. 3
Fig. 3. Mapping cell types across 15 diverse species.
a Pairwise comparison of cell clusters across 15 species based on the shared OMGs. The color scale represents the negative logarithm of the FDR-adjusted p value. Odd Ratios (OR) represent the likelihood of a particular cell type appearing in a specified group relative to its presence in all other groups. Proportion indicates the frequency of the predominant cell type within each group. Groups are named according to the most prevalent cell type, as indicated by their respective OR and proportion values. b, c, d Cell type-specific clustering (phloem, xylem, and cortex) across 15 species.
Fig. 4
Fig. 4. GO enrichment for genes in different plant cell types.
The dot plot illustrates the significance and enrichment levels of GO terms across 13 cell identities from the heatmap in Fig. 3a. The x-axis represents different cell types, while the y-axis displays GO terms summarized using the bag of words method for interpretation and visualization. The size of each dot indicates the number of genes associated with a particular GO term, with larger dots representing more genes. The color of the dots reflects the significance of the enrichment, using a gradient color scale to denote varying p values within a range of 0–0.5.

Similar articles

Cited by

References

    1. Ryu, K. H., Huang, L., Kang, H. M. & Schiefelbein, J. Single-cell RNA sequencing resolves molecular relationships among individual plant cells. Plant Physiol.179, 1444–1456 (2019). - PMC - PubMed
    1. Zhang, T. Q., Chen, Y., Liu, Y., Lin, W. H. & Wang, J. W. Single-cell transcriptome atlas and chromatin accessibility landscape reveal differentiation trajectories in the rice root. Nat. Commun.12, 2053 (2021). - PMC - PubMed
    1. Ortiz-Ramírez, C. et al. Ground tissue circuitry regulates organ complexity in maize and Setaria. Science (1979)374, 1247–1252 (2021). - PMC - PubMed
    1. Zhang, T. Q., Chen, Y. & Wang, J. W. A single-cell analysis of the Arabidopsis vegetative shoot apex. Dev. Cell56, 1056–1074.e8 (2021). - PubMed
    1. Cantó-Pastor, A. et al. A suberized exodermis is required for tomato drought tolerance. Nat. Plants10, 118–130 (2024). - PMC - PubMed

Publication types

MeSH terms

Substances

LinkOut - more resources