. 2025 Jan 2;16(1):231.
doi: 10.1038/s41467-024-55617-9.

L3MBTL3 and STAT3 collaboratively upregulate SNAIL expression to promote metastasis in female breast cancer

Affiliations

L3MBTL3 and STAT3 collaboratively upregulate SNAIL expression to promote metastasis in female breast cancer

Jianpeng Xiao et al. Nat Commun. .

Abstract

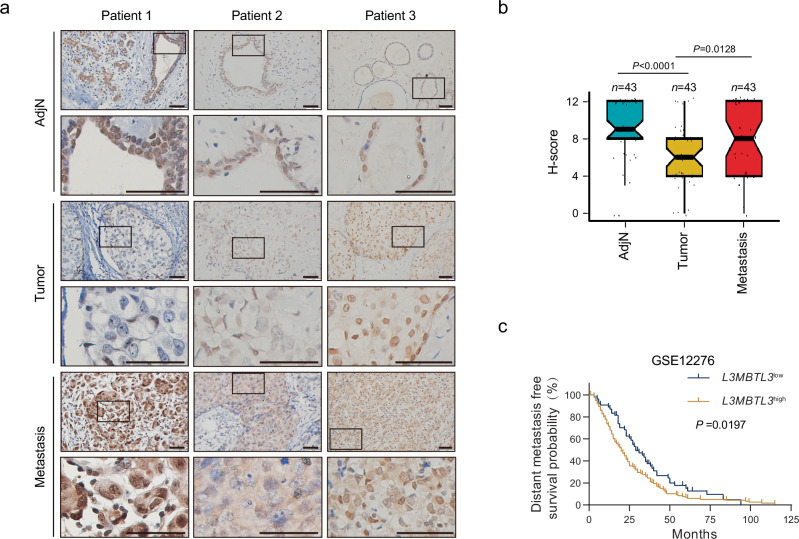
The STAT3 pathway promotes epithelial-mesenchymal transition, migration, invasion and metastasis in cancer. STAT3 upregulates the transcription of the key epithelial-mesenchymal transition transcription factor SNAIL in a DNA binding-independent manner. However, the mechanism by which STAT3 is recruited to the SNAIL promoter to upregulate its expression is still elusive. In our study, the lysine methylation binding protein L3MBTL3 is positively associated with metastasis and poor prognosis in female patients with breast cancer. L3MBTL3 also promotes epithelial-mesenchymal transition and metastasis in breast cancer. Mechanistic analysis reveals that L3MBTL3 interacts with STAT3 and recruits STAT3 to the SNAIL promoter to increase SNAIL transcription levels. The interaction between L3MBTL3 and STAT3 is required for SNAIL transcription upregulation and metastasis in breast cancer, while the methylated lysine binding activity of L3MBTL3 is not required for these functions. In conclusion, L3MBTL3 and STAT3 synergistically upregulate SNAIL expression to promote breast cancer metastasis.


Conflict of interest statement

Competing interests: The authors declare no competing interests.

Figures

Fig. 1
Fig. 1. High L3MBLT3 expression is associated with metastasis and poor clinical outcomes in patients with BC.
a Human BC tissues consisting of primary BC samples (Tumor) paired tumor-adjacent tissue samples (AdjN) and BC lymph node metastasis samples (Metastasis) were subjected to immunohistochemical staining for L3MBLT3 (scale bar, 50 μm). b H-scores of the L3MBTL3 protein in 43 BC patient of primary BC samples (Tumor), paired tumor-adjacent tissue (AdjN) and BC lymph node metastasis samples (Metastasis). The line within each box represents the median. Upper and lower edges of each box represent 75th and 25th percentile, respectively. The whiskers indicated the minima and maxima (n = 43, mean ± SD, one-way ANOVA test). c Distant metastasis free survival of BC patients with high and low L3MBLT3 expression (GSE12276, n = 204). L3MBLT3high, n = 148; L3MBLT3low, n = 56. Statistical analysis according to log-rank test. Source data are provided as a Source Data file.
Fig. 2
Fig. 2. L3MBTL3 promotes EMT, migration, invasion and metastasis in BC.
a Western blot showing the expression level of L3MBTL3, the EMT factor SNAIL and the epithelial cell marker E-cad in mammary gland cells (Normal), luminal and basal-like cells. b Western blot showing the L3MBTL3 expression level in L3MBTL3 overexpressing MCF7 cells and L3MBTL3 knockout and rescued MDA-MB-231 and SUM159PT cells. Brightfield images showing the cell morphology of c L3MBTL3 overexpression MCF7 cells, d L3MBTL3 knockout MDA-MB-231 and SUM159PT cells, and e L3MBTL3 rescued MDA-MB-231 and SUM159PT cells. Scale bar, 100μm. fh The migration assays in (f) L3MBTL3 overexpression MCF7 cells (two-tailed unpaired Student’s t test). The migration and invasion assays in L3MBTL3 (g) knockout (two-tailed unpaired Student’s t test) or (h) rescued MDA-MB-231 and SUM159PT cells (one-way ANOVA test). n = 3 biological replicates, mean ± SD. Western blot showing the expression of L3MBTL3 in (i) L3MBTL3 knockdown or in (l) human L3MBTL3 rescued 4T1 stable cell lines. In (l), the double asterisks (**) indicated mouse L3mbtl3 protein, and the single asterisks (*) indicated human L3MBTL3 protein. jp The lung metastasis foci (scale bar, 5 mm) and HE staining of lung sections (scale bar, 4 mm) in the spontaneous lung metastasis model induced by NC and L3MBTL3 knockdown or NC, L3MBTL3 knockdown and human L3MBTL3 rescued 4T1 cells. The (j, m) metastasis foci and the (o) metastatic area in the lung sections were indicated by single asterisks (*). The (k, n) numbers of metastatic nodules and the (p) percentage of the metastatic area in the lung section were quantified and shown as scatter plot. For (k), n = 9 mice, mean ± SD, Welch’s t test; for (n, p), n = 5 mice, mean ± SD, Kruskal-Wallis one-way test. For (a, b, i, j), the β-ACTIN or β-TUBULIN antibody were used as a loading control. For (a, b, c, d, e, i, l), each experiment included three biological replicates with similar results. Source data are provided as a Source Data file.
Fig. 3
Fig. 3. L3MBTL3 promoted the EMT and IL6-JAK-STAT3 pathway.
a Differences in pathway according to GSEA between the control (C) and L3MBTL3 knockout (L3-KO4 or L3-KO5) groups in SUM159PT cells. Normalized enrichment score (NES) > 1.4, P < 0.05. GSEA plots depicting the enrichment of b EMT and c IL6-JAK-STAT3 pathway genes downregulated in L3MBTL3 knockout SUM159PT cells and d the enrichment of EMT genes upregulated in L3MBTL3 overexpression MCF7 cells and L3MBTL3 rescued SUM159PT cells. Statistical analysis according to Gene Set Enrichment Analysis. e Heatmaps of 30 DEGs related to EMT genes in control (C) and L3MBTL3 knockout (L3-KO4 and L3-KO5) SUM159PT cells. f Heatmap of GSVA enrichment scores of genes involved in the EMT or IL6-JAK-STAT3 pathways in L3MBTL3-high and L3MBTL3-low tumors from TCGA BC dataset (TCGA BRCA 2017, n = 1218) and GEO dataset (GSE202203, n = 3207). g Scatter plots showing the positive correlation between L3MBTL3 transcript levels and the EMT or IL6-JAK-STAT3 pathways in TCGA BC dataset (TCGA BRCA 2017, n = 1218) and GEO dataset (GSE202203, n = 3207). Statistical analysis according to two-tailed Spearman correlation test. Source data are provided as a Source Data file.
Fig. 4
Fig. 4. L3MBTL3 interacts with STAT3 and activating STAT3 enhances this interaction.
a In L3MBTL3-rescued MDA-MB-231 cells, immunoprecipitation of the Flag-L3MBTL3 interacting protein was visualized by silver gel staining. b Venn diagram of the L3MBTL3 interactors, human TFDB geneset and dbEMT geneset. c The 6 hub L3MBTL3 interaction proteins indentilfied by PPI analysis (Cytoscape v 3.9.1). d Coimmunoprecipitation showed that endogenous L3MBTL3 interacted with endogenous STAT3 or p-STAT3Y705 in MDA-MB-231 and SUM159PT cells. e Coimmunoprecipitation showed that exogenous Flag-L3MBTL3 interacted with exogenous HA-STAT3 in 293T cells. f Coimmunoprecipitation showed that exogenous Flag-L3MBTL3 interacted with endogenous STAT3 and p-STAT3Y705 in L3MBTL3-rescued MAD-MB-231 cells. g A GST pull-down assay showed that, compared to wildtype STAT3, STAT3 C (the constitutively active form) had greater L3MBTL3 binding ability, but STAT3Y705F (the inactive form) had less L3MBTL3 binding ability. The asterisk (*) indicated the non-specific band. h Coimmunoprecipitation showed that, compared to wildtype STAT3, exogenous Flag-L3MBTL3 had a greater ability to bind to HA-STAT3Y705E (mimic p-STAT3 Y705, active form), but had a lower ability to bind to HA-STAT3Y705F (deactive form). i Coimmunoprecipitation showed that the binding ability of L3MBTL3 to STAT3 or p-STAT3Y705 increased after MAD-MB-231 and SUM159PT cells were treated with IL6. The β-TUBULIN antibody was used as a loading control. Asterisks (*) indicated the non-specific bands. For (a, d, e, f, g, h, i), each blotting experiment included three biological replicates with similar results. Source data are provided as a Source Data file.
Fig. 5
Fig. 5. L3MBTL3 upregulated the expression of SNAIL in BC.
a ChIP-seq profiles (top) and heatmaps (bottom) showing the occupancy of genome-wide L3MBTL3 peaks in SUM159PT cells and STAT3 in MDA-MB-231 cells. The occupancy sites ranged from −2.5 kb before the transcription start site (TSS) to 2.5 kb after the transcription end site (TES). Technical replicates of L3MBTL3 rep-1 and L3MBTL3 rep-2 were used. b Venn diagram of the common L3MBTL3- and STAT3-occupied genes detected by ChIP-seq in SUM159PT cells and DEGs detected by RNA-seq in L3MBTL3 rescued SUM159PT cells. Technical replicates of L3MBTL3 rep-1 and L3MBTL3 rep-2 were used. Q-PCR analysis showing the transcript levels of SNAIL, E-cad, OCLN, and DSP in (c) L3MBTL3-overexpression MCF7 cells and (f) L3MBTL3 knockout and (h) rescued MDA-MB-231 and SUM159PT cells. n = 3 biological replicates, mean ± SD. Statistical analysis according to two-tailed unpaired t test (c, f) and one-way ANOVA test (h). d WB analyses showing the protein levels of SNAIL and E-cad in L3MBTL3-overexpression MCF7 cells. The antibody β-TUBULIN was used as a loading control. e Immunofluorescence showing the E-cad expression in L3MBTL3-overexpression MCF7 cells. Nuclei were stained with DAPI (scale bar, 20 μm). WB analyses showing the protein levels of SNAIL in L3MBTL3 (g) knockout and (i) rescued MDA-MB-231 and SUM159PT cells. For (d, e, g, i), each experiment included three biological replicates with similar results. j Scatter plots showing the positive correlation between L3MBTL3 and SNAIL transcript levels in TCGA BC dataset (TCGA BRCA 2017, n = 1218) and GEO dataset (GSE202203, n = 3207, two-tailed Spearman correlation test). k Distant metastasis free survival in breast cancer dataset (GSE12276, n = 204) was analyzed according to L3MBLT3 and SNAIL transcription level (L3MBTL3low SNAILlow, n = 37; L3MBTL3low SNAILhigh, n = 19; L3MBTL3high SNAILlow, n = 91; L3MBTL3high SNAILhigh, n = 57). The Distant metastasis free survival of L3MBTL3high SNAILhigh group (n = 57) was much lower than L3MBTL3high SNAILlow group (n = 91). The Distant metastasis free survival of L3MBTL3 high SNAILhigh group (n = 57) was much lower than L3MBTL3low SNAILlow group (n = 37). Statistical analysis according to log-rank test. Source data are provided as a Source Data file.
Fig. 6
Fig. 6. L3MBTL3 recruits STAT3 to SNAIL to promote transcription.
a UCSC genome browser tracks of L3MBTL3 ChIP-seq signals in the vicinity of the SNAIL gene in SUM159PT and MB-MDA-231 cells. Regions P1, P2, P3, P4 and P5 showed the locations of the specific amplicons analyzed by the ChIP assay. Rep-1 and rep-2 were used for technical replicates. b ChIP assays were performed in SUM159PT cells using L3MBTL3 antibody. Primers specific for the P1, P2, P3, P4 and P5 regions on the SNAIL gene promoter were used. ChIP assays were performed in (c) L3MBTL3 knockout SUM159PT cells or d L3MBTL3 rescued MDA-MB-231 cells using L3MBTL3 and p-STAT3Y705 antibodies. Primer specific for the P3 region on the SNAIL gene promoter were used. Luciferase reporter gene assay was performed in (e) 293T cells transfected with pGL3-SNAIL (−600, +80) reporter plasmid and the L3MBTL3 expression plasmids, or (f) 293T cells transfected with pGL3-SNAIL (−600, +80) reporter plasmid and the L3MBTL3 expression plasmids and treated or untreated with NIF, or (g) Vector and L3MBTL3 overexpression MCF7 cells transfected with the pGL3-SNAIL (−600, +80) reporter and negative control (NC) or STAT3 siRNA (siSTAT3 1 and siSTAT3 2). Western blot showed the L3MBTL3, STAT3 and p-STAT3Y705 levels. The β-ACTIN and β-TUBULIN antibodies were used as loading controls. Asterisks (*) in (g) indicated the non-specific bands. Q-PCR showing the transcript levels of STAT3 and SNAIL after STAT3 knockdown in (h) L3MBTL3 overexpression MCF7 cells or in (i) L3MBTL3 knockout and rescued SUM159PT cells. Western blot showing the protein levels of Flag-L3MBTL3, STAT3, p-STAT3Y705 and SNAIL in L3MBTL3-overexpressing MCF7 cells or L3MBTL3 knockout and rescue SUM159PT cells after (j) STAT3 knockdown or (k) STAT3 inhibitor NIF treatment. The β-ACTIN and β-TUBULIN antibodies were used as loading controls. For (bi), n = 3 biological replicates (bf, h, i), n = 7 biological replicaes (g), mean ± SD. Statistical analysis according to two-tailed unpaired Student’s t test (b) and one-way ANOVA test (ci); For (e, f, g, j, k), each blotting experiment included three biological replicates with similar results. Source data are provided as a Source Data file.
Fig. 7
Fig. 7. L3MBTL3-mediated promotion of BC cell migration and invasion is dependent on STAT3.
The migration assays in (a) L3MBTL3 overexpression MCF7 cells and (b) L3MBTL3-rescued SUM159PT cells transfected with STAT3 siRNA (siSTAT3 1 and siSTAT3 2). c The invasion assays in L3MBTL3-rescued SUM159PT cells transfected with STAT3 siRNA (siSTAT3 1 and siSTAT3 2). The migration assays in (d) L3MBTL3-overexpressing MCF7 cells and (e) L3MBTL3-rescued SUM159PT cells treated or untreated with NIF. f The invasion assay in L3MBTL3-rescued SUM159PT cells treated or untreated with NIF. For (af), n = 3 biological replicates, mean ± SD, one-way ANOVA test. Source data are provided as a Source Data file.
Fig. 8
Fig. 8. The Region 176-193 aa is the key site through which L3MBTL3 interacts with STAT3.
a A GST pull-down assay showed that the recombinant truncated L3MBTL3 protein GST-L3-1 (1-204 aa) directly interacted with p-STAT3Y705. b Coimmunoprecipitation showed that the Flag-L3MBTL3 truncation proteins Flag-L3-5 and Flag-L3-6 (both including 1-204 aa region) interacted with p-STAT3Y705. c A GST pull-down assay showed that deleting the region 105-204 aa of L3MBTL3 decreased the interaction with p-STAT3Y705. d A GST pull-down assay showed that the region 176-193 aa region was the key site at which L3MBTL3 interacted with p-STAT3Y705. e Coimmunoprecipitation showed that deleting the 176-193 aa region of L3MBTL3 decreased the interaction between exogenous Flag-L3MBTL3 and exogenous HA-STAT3 in 293 T cells. Coimmunoprecipitation showed that deleting the 176-193 aa region of L3MBTL3 decreased the interaction between exogenous Flag-L3MBTL3 and endogenous p-STAT3Y705 in (f) 293T and (g) L3MBTL3 knockout SUM159PT cells. Asterisks (*) in (g) indicated the non-specific bands. For (ag), each blotting experiment included three biological replicates with similar results. Source data are provided as a Source Data file.
Fig. 9
Fig. 9. The interaction between L3MBTL3 and STAT3 is required for SNAIL expression.
a Comparable enrichment analysis from ChIP sequence between L3-KO5 + L3 vs. L3-KO5 + V and STAT3 using MSigDB database. b Ratio plot depicting the differential binding signal at the differential binding genes in the L3-KO5 + L3 vs. L3-KO5 + L3-Δ176-193 group and the L3-KO5 + L3 vs. L3-KO5 + V group of SUM159PT cells. c Ratio plot depicting the differential binding signal at the differential binding genes in the L3-KO5 + L3 vs. L3-KO5 + L3-Δ176-193 group and differential expression level of the DEGs in C vs. L3-KO5 group of SUM159PT cells. d Volcano plot representing the transcript level of DEGs in common group in (c). The STAT3 target genes SNAIL, CEBPD, UGCG, SOD2, PIM1, NFKBIA, NFATC1, JUNB and FANCC were found in transcriptional upregulation group and labeled. e Venn diagram of the L3-KO5 + L3 vs. L3-KO5 + V different binding genes detected by ChIP-seq and DEGs detected by RNA-seq in L3MBTL3 knockout group and STAT3 knockdown group. f UCSC genome browser tracks of Flag ChIP-seq signals in the vicinity of the SNAIL gene in L3MBTL3 knockout (L3-KO5 + V), L3MBTL3 wildtype (L3-KO5 + L3) and mutant rescued (L3-KO5 + L3-Δ176-193) SUM159PT cells. Rep-1 and rep-2 were used for technical replicates. g ChIP assays were performed in (c) L3MBTL3 knockout (L3-KO5 + V), L3MBTL3 wildtype (L3-KO5 + L3) and mutant (L3-KO5 + L3-Δ176-193) rescued SUM159PT cells using L3MBTL3 and p-STAT3Y705 antibodies. Primer specific for the P3 region on the SNAIL gene promoter were used (n = 3 biological replicates, mean ± SD, one-way ANOVA test). h Q-PCR showing the transcription levels of L3MBTL3 and SNAIL in L3MBTL3 wildtype (L3) and mutant (L3-Δ176-193) overexpression MCF7 cells and in L3MBTL3-knockout, L3MBTL3 wildtype (L3) and mutant (L3-Δ176-193) rescued SUM159PT cells (n = 3 biological replicates, mean ± SD, one-way ANOVA test). i Western blot showing the protein levels of L3MBTL3 and SNAIL in L3MBTL3 wildtype (L3) and mutant (L3-Δ176-193) overexpression MCF7 cells and in L3MBTL3-knockout, L3MBTL3 wildtype (L3) and mutant (L3-Δ176-193) rescued SUM159PT cells. The β-TUBULIN antibody was used as a loading control. The blotting experiment include three biological replicates with similar results. Source data are provided as a Source Data file.
Fig. 10
Fig. 10. The interaction between L3MBTL3 and STAT3 is required for BC metastasis.
a The migration assays in L3MBTL3 wildtype (L3) and mutant (L3-Δ176-193) expression MCF7 cells. The migration and invasion assays in L3MBTL3 wildtype (L3) and mutant (L3-Δ176-193) rescued SUM159PT cells. (n = 3 biological replicates, one-way ANOVA test, mean ± SD) b L3MBTL3 and Flag antibodies were used to detect the expression of L3MBTL3 in the control (NC + V), L3MBTL3 knockdown (L3-KD2 + V) and L3MBTL3 wildtype (L3-KD2 + L3) and mutant (L3-KD2 + L3-Δ176-193) rescued stable 4T1 cell lines. β-TUBULIN and β-ACTIN antibodies were used as loading controls. The double asterisks (**) indicated the mouse L3mbtl3 protein, and the single asterisks (*) indicated the human L3MBTL3 protein in left panel. Each blotting experiment include three biological replicates with similar results. cf (c) The lung metastasis foci (scale bar, 5 mm) and (d) the HE staining of lung sections (scale bar, 4 mm) in the lung metastasis model induced by NC (NC + V) and L3MBTL3 knockdown, L3MBTL3 wildtype (L3) and mutant (L3-Δ176-193) rescued 4T1 cells. The metastasis foci and the metastatic areas in the lung sections were indicated by single asterisks (*), respectively. e The number of metastatic nodules or f the percentage of metastatic area in the lung sections were quantified and shown as scatter plots (n = 10 mice, Welch one-way ANOVA test, mean ± SD). gj (g)The lung metastasis foci (scale bar, 5 mm) and (h) the HE staining of lung sections (scale bar, 4 mm) in the spontaneous lung metastasis model induced by NC (NC + V) and L3MBTL3 knockdown, L3MBTL3 wildtype (L3) and mutant (L3-Δ176-193) rescued 4T1 cells. The metastasis foci and the metastatic areas in the lung sections were indicated by single asterisks (*). i The number of metastatic nodules (n = 8 mice, Welch one-way ANOVA test, mean ± SD) or j the percentage of metastatic area in the lung sections (n = 8 mice, Kruskal-Wallis one-way ANOVA test, mean ± SD) were quantified and shown as scatter plots. k A schematic of how L3MBTL3 and STAT3 collaboratively upregulate SNAIL expression to promote metastasis in BC. Source data are provided as a Source Data file.

Similar articles

Cited by

References

    1. Park, M. et al. Breast cancer metastasis: mechanisms and therapeutic implications. Int. J. Mol. Sci.23, 6806 (2022). - PMC - PubMed
    1. Buyuk, B., Jin, S. & Ye, K. Epithelial-to-mesenchymal transition signaling pathways responsible for breast cancer metastasis. Cell Mol. Bioeng.15, 1–13 (2022). - PMC - PubMed
    1. Zhou, B. P. et al. Dual regulation of Snail by GSK-3beta-mediated phosphorylation in control of epithelial-mesenchymal transition. Nat. Cell Biol.6, 931–940 (2004). - PubMed
    1. Barrallo-Gimeno, A. & Nieto, M. A. The Snail genes as inducers of cell movement and survival: implications in development and cancer. Development132, 3151–3161 (2005). - PubMed
    1. Lamouille, S., Xu, J. & Derynck, R. Molecular mechanisms of epithelial-mesenchymal transition. Nat. Rev. Mol. Cell Biol.15, 178–196 (2014). - PMC - PubMed

Publication types

MeSH terms

Substances