. 2025 Jan 2;16(1):326.
doi: 10.1038/s41467-024-55575-2.

Phthalocyanine aggregates as semiconductor-like photocatalysts for hypoxic-tumor photodynamic immunotherapy

Affiliations

Phthalocyanine aggregates as semiconductor-like photocatalysts for hypoxic-tumor photodynamic immunotherapy

Hao Liu et al. Nat Commun. .

Abstract

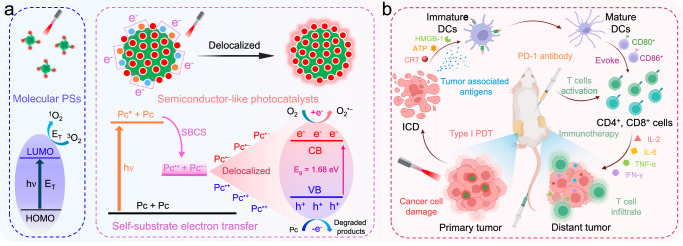
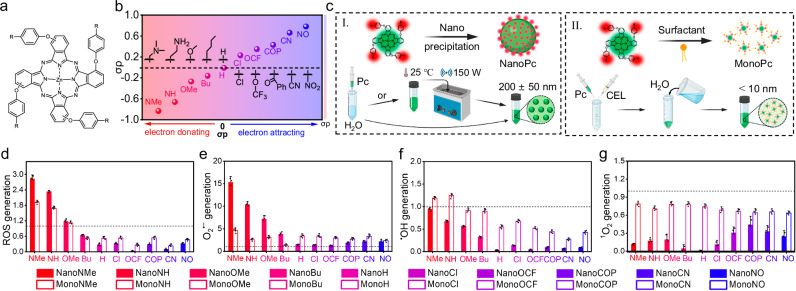
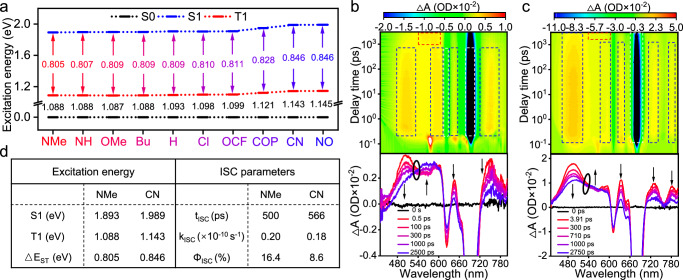
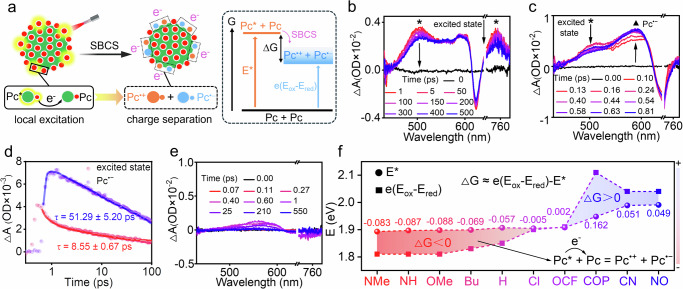
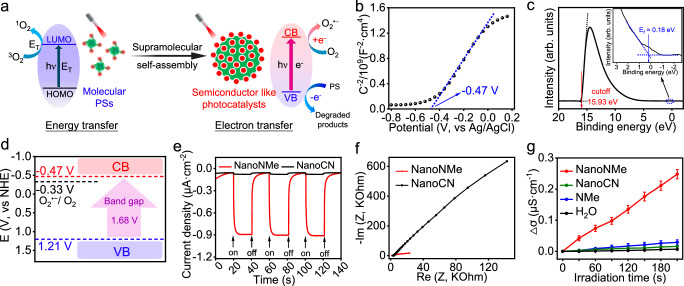
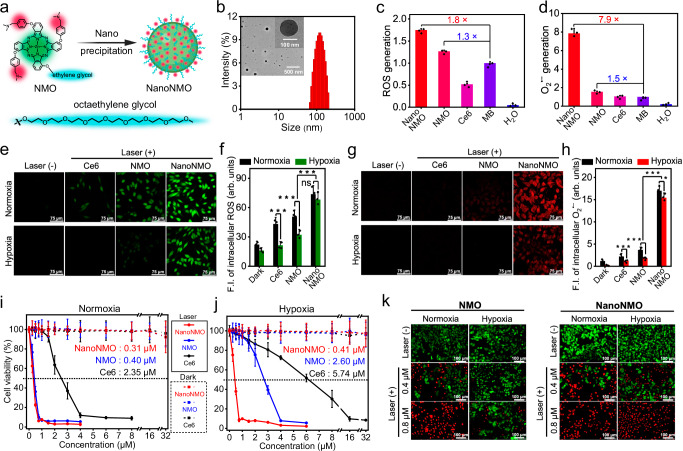
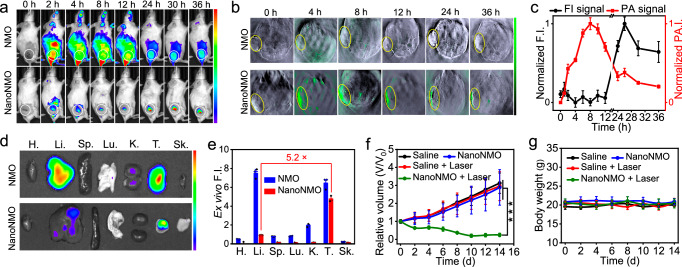
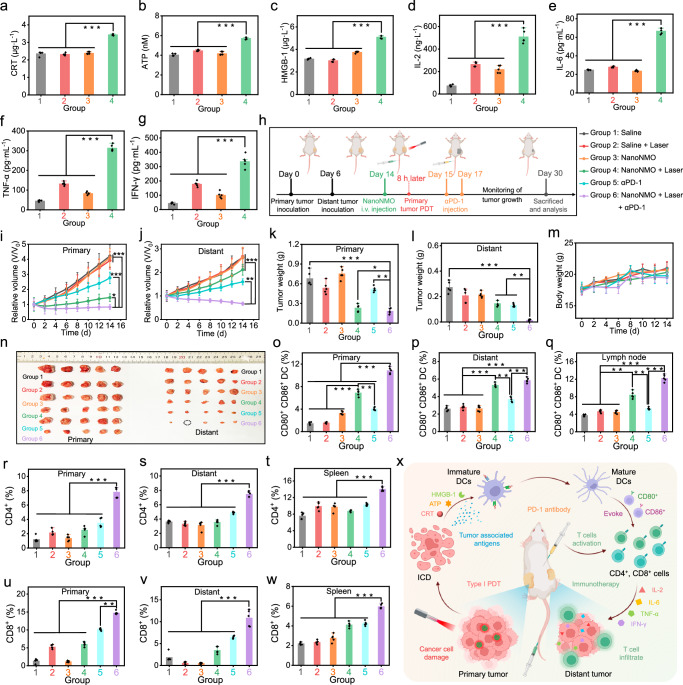
Photodynamic immunotherapy (PIT) has emerged as a promising approach for efficient eradication of primary tumors and inhibition of tumor metastasis. However, most of photosensitizers (PSs) for PIT exhibit notable oxygen dependence. Herein, a concept emphasizing on transition from molecular PSs into semiconductor-like photocatalysts is proposed, which converts the PSs from type II photoreaction to efficient type I photoreaction. Detailed mechanism studies reveal that the nanostructured phthalocyanine aggregate (NanoNMe) generates radical ion pairs through a photoinduced symmetry breaking charge separation process, achieving charge separation through a self-substrate approach and leading to exceptional photocatalytic charge transfer activity. Additionally, a reformed phthalocyanine aggregate (NanoNMO) is fabricated to improve the stability in physiological environments. NanoNMO showcases significant photocytotoxicities under both normoxic and hypoxic conditions and exhibits remarkable tumor targeting ability. Notably, the NanoNMO-based photodynamic therapy and PD-1 checkpoint inhibitor-based immunotherapy synergistically triggers the infiltration of cytotoxic T lymphocytes into the tumor sites of female mice, leading to the effective inhibition of breast tumor growth.


Conflict of interest statement

Competing interests: The authors declare no competing interests.

Figures

Fig. 1
Fig. 1. Mechanisms of semiconductor-like photocatalysts in PIT.
a Schematic illustration of the mechanism of molecular PSs and the charge separation and photocatalytic mechanism of semiconductor-like photocatalysts. b Schematic illustration of the PIT synergistic process of NanoNMO and PD-1 antibody. Created in BioRender.
Fig. 2
Fig. 2. Fabrication of NanoPcs and MonoPcs and their ROS generations.
a The structure of tetrasubstituted zinc (II) Pcs and b quantitative electron properties of the substituent group (σρ) on zinc (II) Pcs. The σρ value is a substituent constant derived from the Hammett equation. The σρ value of electron donor substituents are negative, while the σρ value of electron accept substituents are positive. The absolute value of the σρ indicates the electron donating or accepting ability of substituent. c Schematic illustration of the fabrication of NanoPcs and MonoPcs. Created in BioRender. d Relative ROS generations of NanoPcs and MonoPcs. e Relative O2•− generations of NanoPcs and MonoPcs. f Relative OH generations of NanoPcs and MonoPcs. (g) Relative 1O2 generations of NanoPcs and MonoPcs. n = 3 independent samples with similar results. Data are presented as mean values  ± standard deviation (SD). The relative ROS, O2•−, OH, and 1O2 generations of NanoPcs or MonoPcs were determined comparing them with the reference samples (MB). The probe slope of MB was considered as 1 (marked as dashed line), and the slope ratios were served as the ordinate.
Fig. 3
Fig. 3. Investigation on ISC process of MonoPcs.
a The calculated S1 and T1 energy levels of Pcs. Ground-state geometries optimizations and TD-DFT calculations were carried out at B3LYP/6-31 G* method. All calculations were carried out using the Gaussian 16 package. The polarizable continuum model with default parameters was used to implicitly consider solvation effects of H2O. 2D pseudo-color fs-TA spectra of b NMe and c CN obtained with time delays from 0 to 3080 ps (NMe: 694 nm, 47 μJ; CN: 685 nm, 77 μJ) and plots at different pump-probe delay times. The upward arrow symbolizes the population of triplet states while the downward arrow represents the depopulation of singlet states. The presence of an isosbestic point (marked with a black solid lines) indicates the appearance of both singlet and triplet species, which represents the occurrence of ISC. d The excitation energy data calculated by B3LYP/6-31 G* and the ISC parameters obtained from the fs-TA results of NMe and CN.
Fig. 4
Fig. 4. Self-substrate PET mechanism of NanoPcs.
a Schematic illustration of the electron transfer mechanism of NanoPcs. fs-TA spectra of b NMe in THF and c NanoNMe in H2O upon excitation by 694 nm pulses. * represents excited state species, ▴ represents Pc•−. d The dynamic decay trace and lifetimes of excited states and Pc•− species of NanoNMe within a 3 ns range. e fs-TA spectra of NanoCN in H2O at different time delays upon excitation by 685 nm pulses. f Difference between the oxidation and reduction potentials (shown as e(Eox-Ered)) and the calculated excited energy (E*) of Pcs. “∆G” is displayed in the form of color bars. The redox potentials of Pcs were measured through cyclic voltammetry in DMF containing 0.1 M (n-Bu)4N+PF6–, using glassy carbon as the working electrode, Ag/AgCl as the reference electrode, Pt wire as the counter electrode, with a scan rate of 100 mV·s-1. Ferrocene was used as an external reference. The excited energy of Pcs was calculated by B3LYP/6-31 G* method.
Fig. 5
Fig. 5. Semiconductor-like photocatalysis for O2•− generation.
a Schematic illustration of the molecular orbital diagram of Pcs and the band diagram of NanoPcs. The excited Pcs transfer energy to O2, generating 1O2. The excited NanoPcs transfer electron to O2, generating O2•−. b Mott-Schottky plots of NanoNMe under dark conditions (100 Hz). The lyophilized NanoNMe adhered ITO glass was served as the working electrode, Ag/AgCl as the reference electrode, and platinum wire as the counter electrode, with 0.2 M Na2SO4 as the supporting electrolyte. c UPS valence band spectrum of NanoNMe. The work function (Φ) was calculated through the formula Φ = hν - (cutoff - Ef), where the excitation energy of the He light source was 21.22 eV. The VB potential was calculated through the formula EVB (NHE) = Ef + Φ - 4.44. d Band diagram of NanoNMe, including CB, VB potentials and the band gap. e Representative photocurrent response of NanoNMe and NanoCN on an ITO glass electrode with the interval of 20 s. f Electrochemical impedance spectroscopy of NanoNMe and NanoCN. Ag/AgCl served as the reference electrode, platinum wire as the counter electrode, and 0.2 M Na2SO4 as the supporting electrolyte with a bias of −0.2 V, white light, 180 mW·cm-2. g Changes in conductivity of NanoNMe, NanoCN, and NMe (all at 1 mg·mL-1) over time with the interval of 30 s, white light, 180 mW·cm-2. n = 3 independent samples with similar results. Data are presented as mean values   ± SD.
Fig. 6
Fig. 6. ROS generations and in vitro phototherapeutic efficacy of NanoNMO.
a Structure of NMO and schematic illustration of the fabrication of NanoNMO. Created in BioRender. Liu, H. (2024) BioRender.com/m21y350. b Diameter size distribution and morphology of NanoNMO (5 μM) measured by DLS and TEM. c Relative ROS generations and d relative O2•− generation of NanoNMO. n = 3 independent samples. Data are presented as mean values   ± SD. The relative ROS and O2•− generations of NanoNMO, NMO and Ce6 were determined comparing them with the reference samples (MB). The probe slope of MB was considered as 1, and the slope ratios were served as the ordinate. e CLSM images of intracellular DCFH fluorescence and f quantitative fluorescence emission of 4T1 cells incubated with Ce6 (***p = 0.0004), NMO (***p = 0.0008), and NanoNMO (ns = 0.4060) under both normoxic and hypoxic conditions. g CLSM images of intracellular DHE fluorescence and h quantitative fluorescence emission of 4T1 cells incubated with Ce6 (***p = 0.0007), NMO (***p = 0.0003), and NanoNMO (*p = 0.0342) under both normoxic and hypoxic conditions. Cells were irradiated with 685 nm laser for 5 min (15 mW·cm-2). F.I., Fluorescence intensity. Cytotoxic effects of Ce6, NMO, and NanoNMO on 4T1 cells under i normoxic and j hypoxic conditions in dark or with 685 nm laser irradiation (30 min, 15 mW·cm-2). k Calcein-AM/PI costaining images detected by CLSM, with Calcein-AM staining displayed in the green channel and PI staining in the red channel (scale bar = 100 μm). n = 3 biologically independent experiments for cell samples with similar results. Data were expressed as mean values ± SD, *p < 0.05, ***p < 0.001, NS. not significant, determined by two-tailed Student’s t test.
Fig. 7
Fig. 7. In vivo biodistribution and phototherapeutic efficacy of NanoNMO.
a In vivo fluorescence imaging (excited at 640 nm, ×107 ps−1·cm−1·sr−1·μW−1·cm2, white ellipses representing the tumor area) and b in vivo photoacoustic imaging (excited at 690 and 700 nm, yellow ellipses representing the tumor area) of 4T1 tumor-bearing mice before and after intravenous injection of NMO or NanoNMO. c Quantitative fluorescence and photoacoustic intensities of the tumor sites after intravenous injection of NanoNMO. F.I., fluorescence intensity; PA.I., photoacoustic intensity. d Ex vivo fluorescence imaging of 4T1 tumor bearing mice injected with NMO and NanoNMO (×107 ps−1·cm−1·sr−1·μW−1·cm2) and e quantitative fluorescence intensities. H., heart; Li., liver; Sp., spleen; Lu., lung; K., kidney; T., tumor; Sk., skin. n = 3 biologically independent experiments for mice with similar results. Data were expressed as mean values ± SD. f Tumor growth plots of 4T1 tumor bearing mice following various treatments (***p < 0.0001). g Average body weight changes of mice after indicated treatments. n = 5 biologically independent experiments for mice. Data were expressed as mean values ± SD, ***p < 0.001, determined by two-tailed Student’s t test.
Fig. 8
Fig. 8. In vivo PIT efficiency of NanoNMO in combination with PD-1 antibody.
Biochemical analysis of a CRT (***p < 0.0001), b ATP (***p < 0.0001), c HMGB-1 (***p < 0.0001), d IL-2 (***p < 0.0001), e IL-6 (***p < 0.0001), f TNF-α (***p < 0.0001) and g IFN-γ (***p < 0.0001) in the serum of mice 24 h after different treatments. n = 5 biologically independent experiments for mice. h Schematic outline of the establishment of a 4T1 bilateral tumor model and the treatment steps and procedures for different treatments. Created in BioRender. Liu, H. (2024) BioRender.com/w77z183. PDT treatment was performed 8 h after intravenous injection of NanoNMO with a 685 nm laser (100 mW·cm−2, 5 min), followed by intravenous injection of αPD-1 (2.5 mg·kg-1) on the first and third days, respectively. Tumor volume was continuously monitored until day 14, after which mice were sacrificed for further biochemical studies. Tumor growth plots of i primary tumors (Group 1:***p < 0.0001, Group 5:***p < 0.0001, *p = 0.0268) and j distant tumors (***p < 0.0001, **p = 0.0045) in 4T1 tumor-bearing mice following the indicated treatments. Average weights of k primary tumors (***p < 0.0001, **p = 0.0046, *p = 0.0164) and l distant tumors (***p < 0.0001, **p = 0.0020) following different treatments. m Average body weight changes of mice after different treatments. n Representative tumor images of primary tumors and distant tumors of mice after 14 d of indicated treatments. n = 5 biologically independent experiments for mice. The quantitative data of the population of DC maturation (CD11c+ CD80+ CD86+) in o primary tumors (Group 6: ***p < 0.0001, Group 4: ***p = 0.0046, **p = 0.0080), p distant tumors (Group 6: ***p < 0.0001, Group 5: ***p < 0.0001, Group 4: ***p < 0.0001, **p = 0.0096) and q lymph nodes (Group 6: ***p < 0.0001, Group 5: ***p < 0.0001, Group 5: **p = 0.0038, Group 1–3: **p = 0.0018) of mice after the indicated treatments. The quantitative data of CD4+ T lymphocytes in r primary tumors (***p < 0.0001), s distant tumors (***p < 0.0001) and t spleen (***p < 0.0001) of mice after the indicated treatments. The quantitative data of CD8+ T lymphocytes in u primary tumors (***p < 0.0001, **p = 0.0011), v distant tumors (***p < 0.0001) and w spleen (***p < 0.0001) of mice after the indicated treatments. n = 5 biologically independent experiments for mice. x Schematic illustration of the PIT synergistic process of NanoNMO and αPD-1. Created in BioRender. Liu, H. (2024) BioRender.com/r19s666. Data were expressed as mean values ± SD, *p < 0.05, **p < 0.01, ***p < 0.001, determined by two-tailed Student’s t test.

Similar articles

References

    1. Felsher, D. W. Cancer revoked: Oncogenes as therapeutic targets. Nat. Rev. Cancer3, 375–380 (2003). - PubMed
    1. Brown, J. M. & Wilson, W. R. Exploiting tumour hypoxia in cancer treatment. Nat. Rev. Cancer4, 437–447 (2004). - PubMed
    1. Li, X., Lovell, J. F., Yoon, J. & Chen, X. Clinical development and potential of photothermal and photodynamic therapies for cancer. Nat. Rev. Clin. Oncol.17, 657–674 (2020). - PubMed
    1. Chen, H., Zhang, W., Zhu, G., Xie, J. & Chen, X. Rethinking cancer nanotheranostics. Nat. Rev. Mater.2, 17024–17042 (2017). - PMC - PubMed
    1. Dolmans, D., Fukumura, D. & Jain, R. K. Photodynamic therapy for cancer. Nat. Rev. Cancer3, 380–387 (2003). - PubMed

Publication types

MeSH terms

LinkOut - more resources