. 2025 Jan 2;15(1):327.
doi: 10.1038/s41598-024-83369-5.

FN1 shapes the behavior of papillary thyroid carcinoma through alternative splicing of EDB region

Affiliations

FN1 shapes the behavior of papillary thyroid carcinoma through alternative splicing of EDB region

Mian Liu et al. Sci Rep. .

Abstract

Papillary thyroid cancer (PTC) is often characterized by indolent behavior, small tumors with slow cell proliferation and a tendency to metastasize to cervical lymph node simultaneously, and the molecular mechanisms underlying that remain poorly understood. In this study, FN1 was the hottest gene of PTC and distinctive expression in PTC cells. FN1 deficiency severely inhibited the p53 signaling pathway, especially cyclin proteins, resulting in increased cell growth but hampered invasion. The alternatively splicing EDB region of FN1 was exclusively expressed in tumors, which impacted integrin β1 (ITGB1) bonding FN1 and its secretion process, resulting in completely distinct roles of two isoforms that FN1 including and skipping EDB domain. The isoform EDB(-)FN1 intracellularly inhibited tumor proliferation by upregulating p21 expression, whereas extracellular EDB(+)FN1 promoted lymph node metastasis via the VEGF signaling pathway in vitro and in vivo. Moreover, the alternative splicing EDB region of FN1 was modulated by p53-targeted protein ZMAT3 which activated cell migration and lymphoangiogenesis. Collectively, combined with p53-induced proteins, FN1 played both anti- and pro-cancer roles owing to EDB domain alternative splicing. FN1 is a potential determinant behind the characteristic behavior of PTC, which may contribute to a deeper understanding of the peculiarity of PTC and provide a promising target for regional lymph node metastasis.

Keywords: Alternative splicing EDB domain; FN1; Lymph node metastasis; Papillary thyroid cancer; ZMAT3; p53/p21.


Conflict of interest statement

Declarations. Ethics approval and consent to participate: Ethical approval was provided by the Committees for Ethical Review of Research involving Human Subjects and Animal experiments at Xiangya Hospital, Central South University (No. 2019030140). Competing interests: The authors declare no competing interests.

Figures

Fig. 1
Fig. 1
FN1 is distinctive expression in PTC cells and positively correlated with p53 signaling pathway. (A, B) FN1 mRNA and protein levels in pan-cancer cell lines analyzed by semiquantitative PCR (A) and western blotting (B) respectively. (C) GSEA pathway enrichment plot showing the positive correlation between FN1 expression and p53 signaling pathway in PTC patients from TCGA dataset. (D) The TP53 mutation rate of PTC tissues of TCGA dataset from cBioPortal database. (E) Knockdown of FN1 in K1 and KTC-1 cells verified by western blotting with GAPDH loading control. (F) GSEA pathway enrichment plot showing significant downregulation of p53 signaling pathway following FN1 knockdown in PTC cells.
Fig. 2
Fig. 2
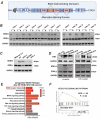
EDB region is exclusively expressed in tumor, EDB(+)FN1 and EDB(−)FN1 two isoforms enriched in different signaling pathways. (A) The simple schematic diagram showing FN1 containing three alternative splicing domains, EDB, EDA and IIICS. (B, C) Semiquantitative PCR analysis of EDB domain expression in normal and papillary thyroid tissues (B) and cells (C) respectively, EDB(+) representing FN1 including EDB domain and EDB(−) representing FN1 skipping EDB domain. (D) Overexpression of two isoforms of FN1, EDB(+)FN1 and EDB(−)FN1, verified by western blotting and Semiquantitative PCR with GAPDH loading control. (E) KEGG enrichment showing ECM-receptor interaction upregulated after co-culture with conditional medium (CM) from OE-EDB(+)FN1 cells. (F) GSEA pathway enrichment plot showing significant upregulation of p53 signaling pathway following EDB(−)FN1 overexpression in shFN1 cells.
Fig. 3
Fig. 3
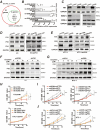
EDB(−)FN1 inhibits cell proliferation by upregulating p53-targeted protein p21 expression. (A) The Venn plot showing the genes in p53 signaling pathway downregulated after knockdown of FN1 and re-upregulated after overexpression of EDB(−)FN1. (B) qRT-PCR analysis verifying P21, BAX, ZMAT3 and MDM2 expression in indicated cells. (C) Knockdown of alternative splicing EDB domain of FN1 verified by western blotting and semiquantitative PCR with GAPDH loading control in K1 and KTC-1 cells. (D, E) Western blot analysis of P53 and p21 expression level in different transfection cells. (F, G) PTC cells treated with DNA-induced damage drug cis-platinum for 24 h, then Western blotting analyzed P53 and p21 expression in shFN1 and shEDB cells. (H) Cell proliferation ability of shFN1 cell overexpressed EDB(−)FN1 or EDB(+)FN1 isoform measured by CCK8 assays. (I, J) After shEDB and shFN1 cells transduced with sgRNAs targeting p53 and p21, the cell growth capability tested by CCK8 assays.
Fig. 4
Fig. 4
EDB(+)FN1 promotes migration, invasion and tube formation extracellularly via VEGF signaling pathway. (A, B) After overexpressing EDB(+)FN1 or EDB(−)FN1 in shFN1 cells, the migration and invasion ability examined by wound healing and transwell assays. (C) Representative images and quantifications of tube formation by LECS and HECV cultured with conditional medium (CM) collected from two isoforms EDB(+)FN1 and EDB(−)FN1 cells. Scale bars: 50 μm. (D) GSEA pathway enrichment plot showing significant upregulation of VEGF signaling pathway following EDB(+)FN1 overexpression in shFN1 cells. (E, F) Western blot analysis of VEGFC expression in LECS and HECV cells after co-culture with CM collected from the indicated PTC cells.
Fig. 5
Fig. 5
EDB region deficiency inhibits the binding of ITGB1 and FN1 and its secretion. (A) Flag tag with EDB(+)FN1 and His tag with EDB(−)FN1, using anti-flag and anti-his antibodies to pull down corresponding bound proteins for PAGE. (B, C) After transfecting Flag-EDB(+)FN1 or His-EDB(−)FN1 plasmids, then using FN1, flag and his antibodies for immunoprecipitation and western blotting assays. (D) After transfecting Flag-EDB(+)FN1 or His-EDB(−)FN1 plasmids, then using ITGB1 antibody for immunoprecipitation and western blotting assays. (E, F) Western blot analysis of secreted FN1 expression in cultured medium collected from the indicated cells with transferrin loading control. (G) Knockdown of ITGB1 in OE-EDB(+)FN1 cells verified by western blotting with GAPDH loading control. (H) Western blot analysis of VEGFC expression level in LECS cells after co-culture with CM from the indicated cells.
Fig. 6
Fig. 6
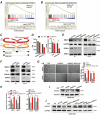
EDB region of FN1 is modulated by splicing factor ZMAT3 which promotes cell migration and invasion. (A) GSEA pathway enrichment plot showing the positive correlation between ZMAT3 expression level and P53 signaling pathway from TCGA database. (B) GSEA pathway enrichment plot showing the positive correlation between ZMAT3 expression and ECM-receptor interaction from TCGA database. (C) rMATS plot showing the decrease in Including level (InLevel) of the alternative splicing EDB region of FN1 upon ZMAT3 silencing. (D) The expression of EDB(+)FN1 and EDB(−)FN1 isoforms in shZMAT3 and control groups from RNA-seq data and verified by qRT-PCR. (E) Semiquantitative PCR analysis of EDB(+)FN1 and EDB(−)FN1 isoforms expression of K1 and KTC-1 cells following ZMAT3 knockdown. (F) Western blot analysis of ZMAT3 expression and Semiquantitative PCR analysis of EDB(+)FN1 and EDB(−)FN1 expression following p53 knockout. (G) Representative images and quantifications of tube formation by LECS and HECV cultured with CM collected from the indicated cells. Scale bars: 50 μm. (H) qRT-PCR analysis of VEGFR3 expression of LECS and HECV after co-cultured with CM derived from indicated cells. (I, J) Western blot analysis of VEGFC expression of LECS after co-cultured with CM from the indicated PTC cells.
Fig. 7
Fig. 7
EDB(−)FN1 impairs tumor growth while EDB(+)FN1 promotes LNM in mice models. (A) Tumor formation by shFN1 or shEDB cells injected into the subcutaneous tissue of nude mice, and tumor growth curves are shown. (B) The expression of p53 and p21 in subcutaneous tumor tissues were evaluated by IHC. Scale bars: 50 μm. (C) Representative images of popliteal lymph node (LN) metastasis model of nude mouse, the indicated K1 cells were injected into the footpads, and images of popliteal LNs and histogram analysis of the LN volume in the indicated cells (n = 3). (D) The image of LYVE-1 expression in popliteal LNs tested by IHC. (E) The expression of VEGFC and CK7 in popliteal LNs of indicated groups. Scale bars: 50 μm.
Fig. 8
Fig. 8
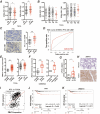
The expression of EDB(−)FN1, EDB(+)FN1 and ZMAT3 in PTC patients. (A) The percentage of EDB(−)FN1 and EDB(+)FN1 accounting for FN1 in tumors with-LNM (N1) and without-LNM (N0) respectively in TCGA dataset from the TSVdb database. (B) The ratio of EDB(−)FN1 and EDB(+)FN1 in different tumor size stage (T1–T4) in TCGA dataset from the TSVdb database. (C) Representative images of EDB region expression in PTC tumors with-LNM (N1) and without-LNM (N0), and statistical diagram was shown. Scale bars: 50 μm. (D) Diagnostic efficacy of EDB region expression in PTC with LNM evaluated by ROC curve. (E) The differential expression of ZMAT3 in normal and tumor tissues, tumor with-LNM and without-LNM PTC tissues from TCGA dataset. (F) The differential expression of ZMAT3 in normal and tumor tissues, normal LN and metastatic LN from GSE60542 dataset. (G) qRT-PCR analysis of ZMAT3 mRNA expression in paired tumor and paracancerous tissues (n = 10). (H) ZMAT3 protein expression in normal and PTC tissues from the Protein Atlas database. (I) The correlation analysis of FN1 and ZMAT3 expression levels from cBioPortal database. (J, K) Kaplan-Meier analyses of the correlations between FN1 (I), ZMAT3 (J) expression and recurrence-free survival of PTC patients from Kmplot database.
Fig. 9
Fig. 9
A simple signaling pathway diagram. FN1 plays both oncogenic and tumor suppressive roles combined with p53 signaling pathway owing to the alternative splicing of EDB domain and its subcellular location. The isoform EDB(−)FN1 intracellularly inhibited tumor proliferation by upregulating p21 expression, whereas extracellular EDB(+)FN1 that was up-regulated by ZMAT3 promoted lymph node metastasis via the VEGF signaling pathway.

Similar articles

References

    1. Siegel, R. L., Miller, K. D., Fuchs, H. E. & Jemal, A. Cancer statistics, 2022. Ca-a Cancer J. Clin.72 (1), 7–33 (2022). - PubMed
    1. Miranda, A. et al. Thyroid cancer incidence trends by histology in 25 countries: a population-based study. Lancet Diabetes Endocrinol.9 (4), 225–234 (2021). - PubMed
    1. Schlumberger, M. & Leboulleux, S. Current practice in patients with differentiated thyroid cancer. Nat. Reviews Endocrinol.17 (3), 176–188 (2021). - PubMed
    1. Yu, X., Wan, Y., Sippel, R. & Chen, H. J. A. o. s., Should all papillary thyroid microcarcinomas be aggressively treated? An analysis of 18,445 cases. Ann. Surg.254 (4), 653–660 (2011). - PubMed
    1. Sciuto, R. et al. Natural history and clinical outcome of differentiated thyroid carcinoma: a retrospective analysis of 1503 patients treated at a single institution. Ann. Oncol.20 (10), 1728–1735 (2009). - PubMed

Publication types

MeSH terms