. 2025 Jan 2;16(1):72.
doi: 10.1038/s41467-024-55509-y.

Physiological premature aging of ovarian blood vessels leads to decline in fertility in middle-aged mice

Affiliations

Physiological premature aging of ovarian blood vessels leads to decline in fertility in middle-aged mice

Lu Mu et al. Nat Commun. .

Abstract

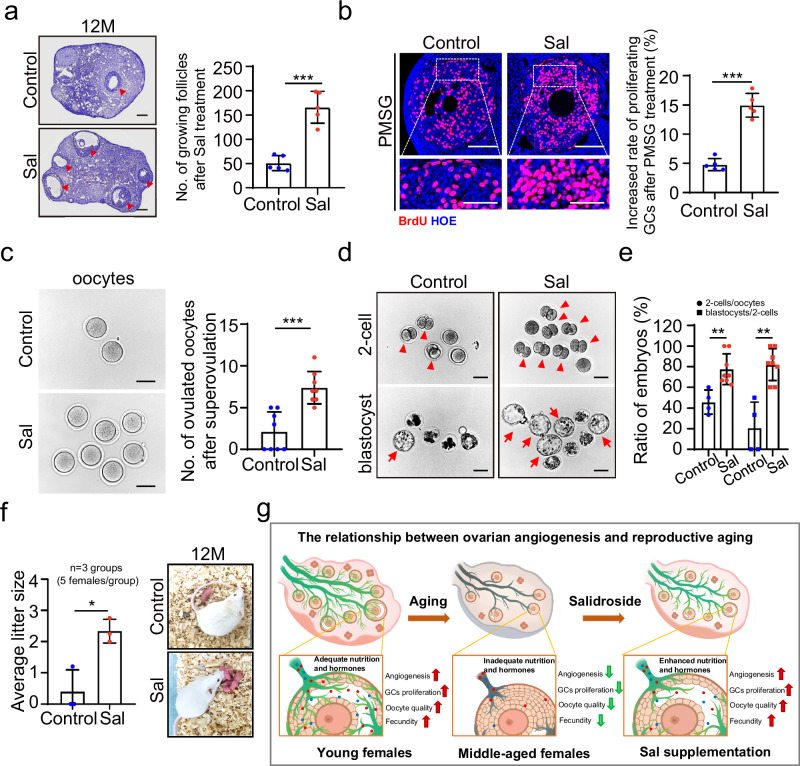
Ovarian function declines significantly as females enter middle-age, but the mechanisms underlying this decline remain unclear. Here, we utilize whole-organ imaging to observe a notable decrease in ovarian blood vessel (oBV) density and angiogenesis intensity of middle-aged mice. This leads to a diminished blood supply to the ovaries, resulting in inadequate development and maturation of ovarian follicles. Utilizing genetic-modified mouse models, we demonstrate that granulosa cell secreted VEGFA governs ovarian angiogenesis, but the physiological decline in oBV is not attributed to VEGFA insufficiency. Instead, through single-cell sequencing, we identify the aging of the ovarian vascular endothelium as the primary factor contributing to oBV decline. Consequently, the administration of salidroside, a natural compound that is functional to reverse oBV aging and promote ovarian angiogenesis, significantly enhances ovarian blood supply and improve fertility in older females. Our findings highlight that enhancing oBV function is a promising strategy to boost fertility in females.


Conflict of interest statement

Competing interests: The author declares no competing interests.

Figures

Fig. 1
Fig. 1. Age-associated decline of ovarian blood vessel starts since middle aged.
a Schematic representation illustrating the methodology employed for achieving high-resolution 3D imaging of ovarian blood vessels. b Images of 3D ovarian blood vessels in adult Tek-CreERT2;mTmG mice, showing the reconstructed images are flexible to analyze the ovarian blood vessels from whole organ level to the subcellular level. Whole-mount, single-slice (white frame), Follicle (blue frame), Tip cells (yellow frame, arrowheads) (c) High-resolution 3D images of ovarian blood vessels at different ages. Showing a notable decrease of blood vessel density (left) and a reduction in the number of tip cells (right, arrows) with reproductive aging. d Quantifying the number of tip cells showed a notable decline of angiogenesis with reproductive aging (4 M: n = 7 mice, 8 M: n = 6 mice, 12 M: n = 7 mice). e Quantifying the density of blood vessels revealed a substantial decrease with reproductive aging (4 M: n = 3 mice, 8 M: n = 4 mice, 12 M: n = 5 mice). f Detecting the age-associated blood vessel changes in ovary, heart, liver, lung, and kidney, showing vascular density at 4 months, 8 months, and 12 months (green: PODXL). g Quantification of relative vascular density in organs indicating no significant changes in the heart, liver, lung, and kidney, but a marked decline in ovaries since middle age (Ovary: 4 M: n = 3 mice, 8 M: n = 4 mice, 12 M: n = 4 mice, Heart: n = 4 mice, Liver: n = 4 mice, Lung: n = 4 mice, Kidney: n = 4 mice). h Illustration of the methodology employed to assess blood vessel permeability following Evans blue injection (upper) and the distribution of Evans blue (arrowheads) in ears (middle) and ovaries (bottom) subsequent to tail vein injection at 4, 8, and 12 months. i Quantification of Evans blue signal demonstrating a significant reduction in vascular permeability in ovaries with reproductive aging (n = 3 mice). Data are presented as the means ± SD. Data were analyzed by 2-tailed unpaired Student’s t-test without adjustments; *** P < 0.001, ** P < 0.01, * P < 0.05, n.s. (not significant) P ≥ 0.05. Scale bars: 10 μm (c), 50 μm (f), 500  μm (h). Source data are provided as a Source Data file including exact P values.
Fig. 2
Fig. 2. Ovarian blood vessel decline decreases the follicle developmental potential in the middle-aged ovaries.
a Age-related changes in tip cells (arrows) on growing follicles during reproductive aging. b Quantification of the tip cells on growing follicles at different ages, showing a significantly reduced angiogenesis with age in the ovaries (4 M: n = 7 mice, 8 M: n = 10 mice, 12 M: n = 7 mice). c Live imaging tracking the growth of blood vessels on follicles at 4, 8, and 12 months in vitro culture. d Statistical analysis of the relative growth rate of follicle blood vessels over 24 h in vitro culture, showing a significant decrease at 8 and 12 months compared to 4 months (4 M: n = 8 follicles from 3 mice, 8 M: n = 11 follicles from 3mice, 12 M: n = 10 follicles from 3 mice). e Relative growth rate of follicle diameter over 24 h in vitro culture, demonstrating consistent growth ability of follicles across different ages (4 M: n = 8 follicles from 3 mice, 8 M: n = 11 follicles from 3 mice, 12 M: n = 10 follicles from 3 mice). f Evans blue signal (left) and quantification of EB intensity (right) in the follicles at different ages, revealing a significant decrease in dye penetration in aging follicles (4 M: n = 21 follicles from 3 mice, 8 M: n = 9 follicles from 3 mice, 12 M: n = 15 follicles from 3 mice). g BrdU staining detection of proliferative granulosa cells in antral follicles at different ages (red: BrdU, blue: Hoechst). h Quantification of BrdU+ GCs indicating a significant decreased GC proliferation in antral follicles with age (n = 8 follicles from 3 mice). i BrdU staining detection of proliferative GCs after 24 h of PMSG treatment (red: BrdU, blue: Hoechst) at different ages (left). j Quantification of BrdU+ GCs showing significantly decreased responses of PMSG in follicle development at 8 months and 12 months compared to that at 4 months (n = 4 mice). Data are presented as the means ± SD. Data were analyzed by 2-tailed unpaired Student’s t-test without adjustments; *** P < 0.001, ** P < 0.01, n.s. P ≥ 0.05. Scale bars: 20 μm (a), 100 μm (c and f), 50 μm (g and i). Source data are provided as a Source Data file including exact P values.
Fig. 3
Fig. 3. Granulosa cell secreted VEGFA governs the ovarian angiogenesis.
a In situ hybridization demonstrating granulosa cells (arrows) as the primary cells of VEGFA secretion in ovaries. Three experiments were repeated independently with similar results. b Schematic representation of the strategy of Vegfa deletion in GCs. Exon 3-7 deletion via Foxl2-Cre-mediated recombination in granulosa cells within GC;Vegfafl/fl (vko) ovaries. c Validation of Vegfa deletion in GCs of vko females. Three experiments were repeated independently with similar results. d Histological analysis showing a significant suppression of ovarian and follicle development in the vko females compared to nocre ovaries at 23 dpp and 6 months. No ovulated follicles and many empty follicle-like structures (arrows) were observed in vko ovaries at 6 months. e Follicle counting results in nocre ovaries at 23 dpp and 6 months, showing a dramatically decreased number of growing follicles at 23 dpp (left) and a failure of ovulated follicle formation at 6 months (right) in vko ovaries (23dpp: n = 4 mice, 6 M: n = 3 mice). f Immunostaining of endothelium revealing the failure of follicle blood vessel formation (arrows) in vko ovaries (green: PODXL, gray: Hoechst). g Quantification of relative vascular density in vko ovaries at both 23 dpp and 6 months (n = 3 mice). h Histological analysis of ovaries before and after PMSG treatment, showing a failure of PMSG response with no markedly changes of in both ovarian size and follicle developmental profiles in vko ovaries after PMSG treatment. i Maximum follicle diameter in 23 dpp ovaries before and after PMSG treatment, showing a significantly increase of follicle diameter in nocre ovaries, but the size of largest follicles had no changes in vko ovaries (n = 10 follicles from 3 mice). Data are presented as the means ± SD. Data were analyzed by 2-tailed unpaired Student’s t-test without adjustments; *** P < 0.001, ** P < 0.01, n.s. P ≥ 0.05. Scale bars: 200 μm (a), 100 μm (d and f), 500 μm (h). Source data are provided as a Source Data file including exact P values.
Fig. 4
Fig. 4. Vascular senescence leads to the blood vessel decline in middle-aged ovaries.
a In situ hybridization results showing the expressions of Vegfa in ovaries at 4 months and 12 months, highlighting the granulosa cell (GCs) as the primary cells secreting VEGFA. b Relative Vegfa expression levels in GCs demonstrating increased Vegfa expressions with age (n = 3 mice). c Western blot detections revealing a significant increase in VEGFA expression in ovaries with age from 4 months to 12 months (n = 3 mice). d UMAP plot illustrating that young (2 months, red plots) and middle-aged (10 months, blue plots) ovarian vascular endothelial cells (oVEs) share similar cell populations, including capillary (C0), artery (C1), vein (C2), and Ada+ endothelium(C4), with proliferating endothelium (C3) only present in young oVEs. e UMAP plot (left) displaying the cellular atlas of young (green frame) and middle-aged oVEs (blue frame), emphasizing changes in cell type proportions between the two age groups (right). f Immunostaining results (left) showing the ratio of PODXL+BrdU+ endothelium in follicles (upper, arrows) and livers (bottom, arrowheads) (green: PODXL, red: BrdU). Quantification of the PODXL+BrdU+ endothelium ratio (right) revealing a significant decrease in oVEs with reproductive aging (4 M: n = 5 mice, 8 M: n = 3 mice, 12 M: n = 5 mice). g Relative telomere length detection indicating a significant decrease in oVEs during reproductive aging (n = 3 mice). h Gene Ontology analysis of differential genes in capillaries (upper), arteries (middle) and veins (bottom) of young and middle-aged oVEs. i Violin plot displaying angiogenesis-related genes including End1 and Tspo significantly decreasing and Flt1 significantly increasing in middle-aged oVEs, indicating reduced angiogenesis with reproductive aging (upper); oxidative stress-related genes including Gpx1, Gsr and Prdx5 significantly decreasing in middle-aged oVEs, suggesting increased oxidative stress with reproductive aging (bottom). Data shown as median, interquartile range (IQR), and 1.5x IQR (Young: n = 1992 cells, Middle-age: n = 488 cells). Data are presented as the means ± SD. Data were analyzed by 2-tailed unpaired Student’s t-test without adjustments (b, c, f, g) and Wilcoxon rank sum test with adjustments (i); *** P < 0.001, ** P < 0.01, * P < 0.05. Scale bars: 200 μm (a), 25 μm (f). Source data are provided as a Source Data file including exact P values.
Fig. 5
Fig. 5. Salidroside supplementation enhances ovarian angiogenesis and blood supply in aged ovaries.
a Live-cell imaging analysis tracking the growth of blood vessels of Tek-CreERT2;mTmG follicles from 12-month-old females with Sal, Ft1, Dosk or vehicle. b Relative growth rate of vascular area in follicles during 24 h of in vitro culture, revealing Sal as the most significant component for increasing blood vessel growth in cultured follicles (Control: n = 10 follicles from 3 mice, Sal: n = 8 follicles from 3 mice, Ft1: n = 9 follicles from 3 mice, Dosk: n = 8 follicles from 3 mice). c Sal treatment strategy in 12-month-old females. After 7 days of Sal (300 mg/kg BW, once a day) or vehicle treatment, females were evaluated for their reproductive ability or the angiogenesis intensity. d Tip cells on growing follicles after 7 days of Sal or vehicle treatment (left), quantifying the number of tip cells (right) showing a significant increase in tip cells on growing follicles after 7 days of Sal treatment (n = 5 mice). e Whole-mount reconstruction of ovarian blood vessels (left) after 7 days of Sal or vehicle treatment at 12 months and quantification analysis (right) showing a slight elevation in ovarian vessel density after Sal treatment compared to the control (n = 5 mice). f Intensity of Evans blue (arrowheads) in ovaries (left) of 12-month-old females after Sal or vehicle treatment. Quantification of the EB signal (right) indicating Sal treatment significantly increased the blood supply to the ovaries (n = 4 mice). g EB signals in follicles from the females with or without Sal treatment (left), and quantitation of EB abundance in follicles showing Sal treatment significantly enhanced the blood supply to the follicles (right, Control: n = 8 follicles from 3 mice, Sal: n = 7 follicles from 3 mice). Data are presented as the means ± SD. Data were analyzed by 2-tailed unpaired Student’s t-test without adjustments; *** P < 0.001, ** P < 0.01, * P < 0.05. Scale bars: 100 μm (a and g), 10 μm (d), 500 μm (f). Source data are provided as a Source Data file including exact P values.
Fig. 6
Fig. 6. Salidroside supplementation enhances fertility in aged females.
a Ovarian morphology with or without Sal treatment at 12 months, exhibiting an increase in the number of growing follicles (arrows) in the Sal group compared to the control (n = 5 mice). b Immunostaining detection of proliferating granulosa cells (red: BrdU, blue: Hoechst) in Sal and vehicle-treated ovaries at 12 months post-PMSG treatment. Statistical analysis revealing a significantly increase in GC proliferating ratio after Sal treatment compared to the control (n = 5 mice). c A significantly higher number of ovulated oocytes was retrieved from Sal-treated ovaries compared to controls after superovulation (n = 8 mice). d Representative images of 2-cells (arrowheads) and blastocysts (arrows) derived from in vitro fertilized oocytes from Sal-treated and control mice. e The ratio of 2-cell embryos (left) and blastocysts (right) significantly increased in Sal-treated mice compared to controls (Control: n = 4 mice, Sal: n = 8 mice). f Fertility test demonstrating a significant increase in litter size (left) after Sal treatment (n = 3 groups, 5 females per group) and general appearance of Sal-treated and control females at 12 months, displaying increased number of healthy pups with Sal-treated mothers (right). g The graphic model illustrates how the decline of ovarian angiogenesis contributes to ovarian aging. In young ovaries, active ovarian angiogenesis results in the development of high-density blood vessels that provide ample nutrition and hormones for follicle growth, thereby ensuring a high fertility efficiency (left). Conversely, reduced angiogenesis in middle-aged ovaries leads to insufficient nutrition and hormone supply, resulting in decreased fertility (middle). Efficiently supplying Sal reverses these age-related negative effects on fertility (right). Data are presented as the means ± SD. Data were analyzed by 2-tailed unpaired Student’s t-test without adjustments; *** P < 0.001, ** P < 0.01, * P < 0.05. Scale bars: 200 μm (a), 100 μm (b, c and d). Source data are provided as a Source Data file including exact P values.

References

    1. Timonin, S. et al. Disparities in length of life across developed countries: measuring and decomposing changes over time within and between country groups. Popul Health Metr.14, 29 (2016). - PMC - PubMed
    1. Adams, O. Life expectancy in Canada-an overview. Health Rep.2, 361–376 (1990). - PubMed
    1. Lehallier, B. et al. Undulating changes in human plasma proteome profiles across the lifespan. Nat. Med.25, 1843–1850 (2019). - PMC - PubMed
    1. Li, J. et al. Determining a multimodal aging clock in a cohort of Chinese women. Med.4, 825–848.e813 (2023). - PubMed
    1. te Velde, E. R. & Pearson, P. L. The variability of female reproductive ageing. Hum. Reprod. Update8, 141–154 (2002). - PubMed

Publication types

MeSH terms

LinkOut - more resources