. 2025 Jan 2;15(1):368.
doi: 10.1038/s41598-024-83204-x.

Mechanistic modelling of allergen-induced airways disease in early life

Affiliations

Mechanistic modelling of allergen-induced airways disease in early life

Hannah J Pybus et al. Sci Rep. .

Abstract

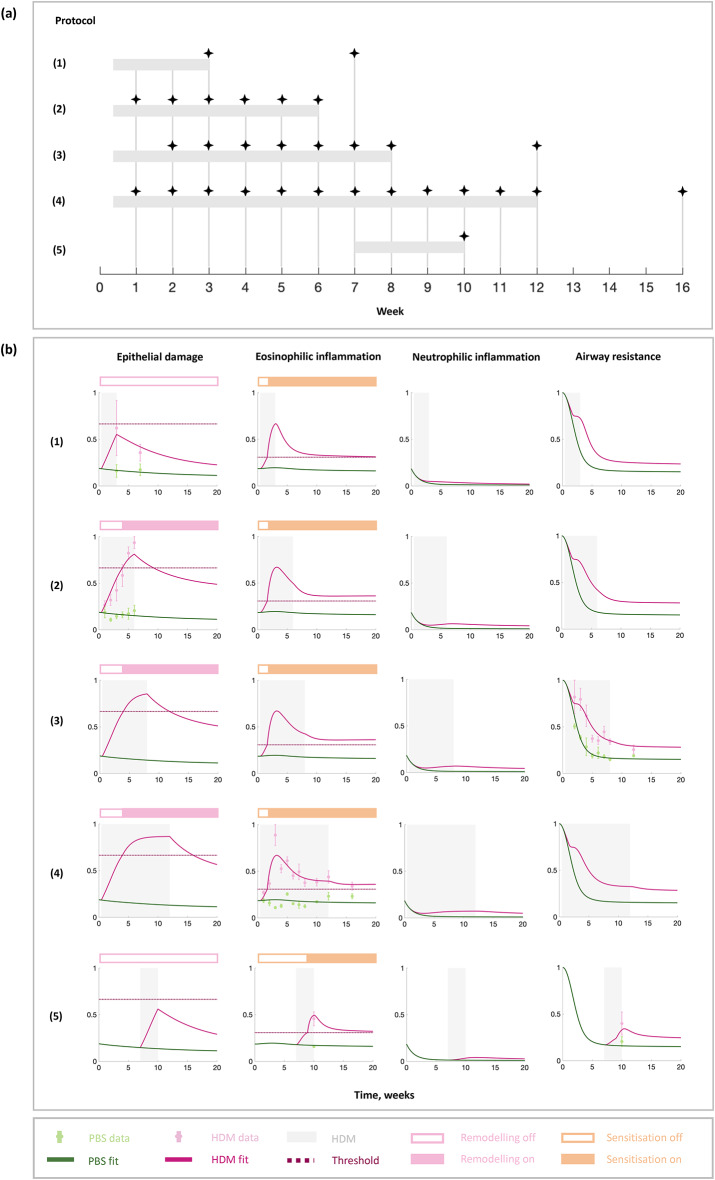
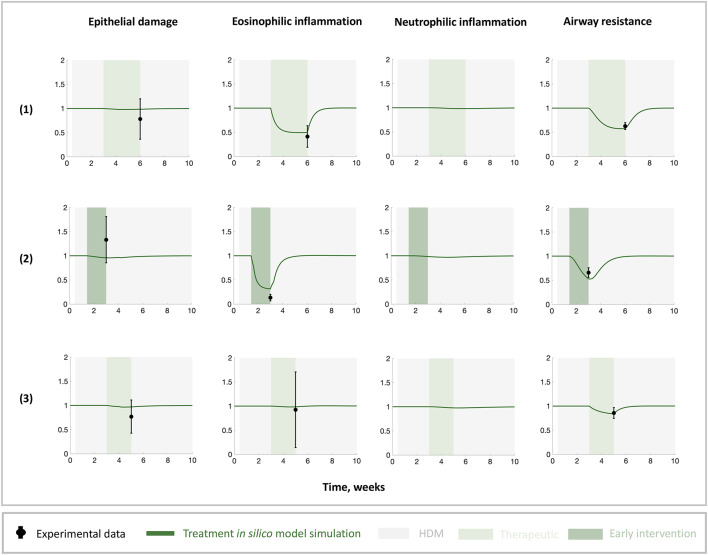
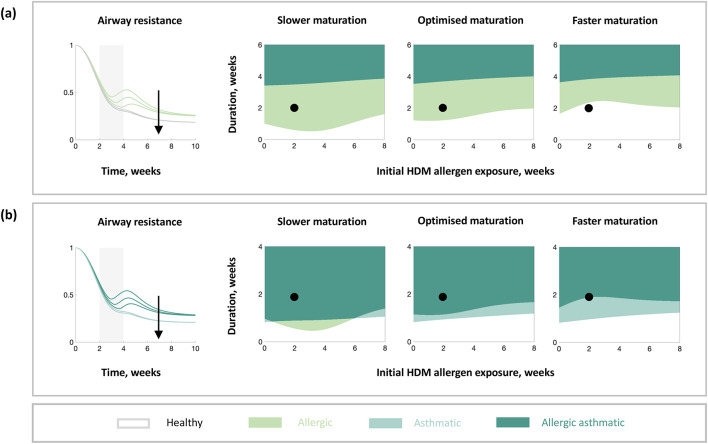
Asthma affects approximately 300 million individuals worldwide and the onset predominantly arises in childhood. Children are exposed to multiple environmental irritants, such as viruses and allergens, that are common triggers for asthma onset, whilst their immune systems are developing in early life. Understanding the impact of allergen exposures on the developing immune system and resulting alterations in lung function in early life will help prevent the onset and progression of allergic asthma in children. In this study, we developed an in silico model describing the pulmonary immune response to a common allergen, house dust mite, to investigate its downstream impact on the pathophysiology of asthma, including airway eosinophilic inflammation, remodelling, and lung function. We hypothesised that altered epithelial function following allergen exposure determines the onset of airway remodelling and abnormal lung function, which are irreversible with current asthma therapies. We calibrated the in silico model using age appropriate in vivo data from neonatal and adult mice. We validated the in silico model using in vivo data from mice on the effects of current treatment strategies. The in silico model recapitulates experimental observations and provides an interpretable in silico tool to assess airway pathology and the underlying immune responses upon allergen exposure. The in silico model simulations predict the extent of bronchial epithelial barrier damage observed when allergen sensitisation occurs and demonstrate that epithelial barrier damage and impaired immune maturation are critical determinants of reduced lung function and asthma development. The in silico model demonstrates that both epithelial barrier repair and immune maturation are potential targets for therapeutic intervention to achieve successful asthma prevention.

Keywords: Allergen; Asthma; In silico models; Mechanistic modelling; Pre-school wheeze.


Conflict of interest statement

Declarations. Competing interests: The authors declare no competing interests.

Figures

Fig. 1
Fig. 1
Development of an in silico model of the immune response to HDM exposure. (a) Overview highlighting the input, output, and key components of the in silico model. (b) Biological diagram of a cross section of the airway showing the key interactions and pathways included in the in silico model. Type 1 responses account for neutrophilic inflammation. Type 2 responses account for eosinophilic inflammation, allergic responses (IgE), and accompanying cytokines. The tissue-level airway resistance changes due to changes in the cell-level structure, which is caused by mucus accumulation, inflammation, and epithelial barrier damage. (c) Schematic of the in silico model with two switches (one for sensitisation and another for remodelling). Dashed lines indicate time-dependent rates. The colour coding for grouped cells follows that in Fig. 1b, where type 1 and type 2 responses are shown in blue and orange, respectively. (d) Long-term outcomes of the immune response described by 4 disease states (healthy, allergic, asthmatic and allergic asthmatic) defined by the on/off states of the two switches in the in silico model. Diagrams (bd) created in BioRender (2024); (bhttps://biorender.com/d54v750, (c) https://biorender.com/t10x595, (dhttps://biorender.com/i93i862.
Fig. 2
Fig. 2
In silico model fitting to experimental data. (a) Experimental protocols of published in vivo mouse model studies we used for model fitting. Shaded regions indicate HDM challenge present and stars represent the timings of experimental data measurements (weeks from birth). (b) Model simulations of the parameterised in silico model for each of the experimental protocols. The data obtained for each protocol are (1–2) epithelial barrier damage (IL-33), (3) airway resistance, and (4) eosinophil cell counts from a neonatal mouse model, and (5) eosinophil cell counts and airway resistance from an adult mouse model. Shaded regions indicate HDM challenge present and the dots with error bars indicate the mean data measurements with SEM. The green lines indicate the fit to PBS data and the dark pink lines the fit to HDM data. The dotted horizontal lines in the epithelial damage and eosinophilic inflammation plots indicate the thresholds for the remodelling and sensitisation switches, respectively. The resulting switch states are shown by the colours of the bars above the plots, with the on-states represented by pink and orange for remodelling and sensitisation switches and the off-states represented by white.
Fig. 3
Fig. 3
Validation of the in silico model against current treatment strategies. (1) Corticosteroid applied at week 3, i.e., after the disease onset, (b) corticosteroid applied at day 10, i.e., before the disease onset, and (c) anti-IL-13 use at week 3, i.e., after the disease onset, in a mouse model. All data points (black circles with SEM error bars) and simulation dynamics (solid green lines) are plotted as a fold change in treatment application vs placebo with HDM present from day 3 of life. Grey shaded regions indicate HDM present, dark green shaded regions indicate treatment interventions before disease onset, light green shaded regions indicate therapeutic treatment use after disease onset.
Fig. 4
Fig. 4
In silico long-term outcomes of HDM exposures of varied initial times and durations. Results for (a) the validated in silico model of the nominal virtual mouse and (b) the in silico model with modified parameters (an alternative virtual mouse, Figure S2). (Top) Switch plots that summarise the simulation results of long-term disease states as a result of HDM exposure for different durations starting at different timings. (Middle and bottom) Example dynamics as a result of the in silico model simulation for three representative scenarios of HDM exposure (1) at week 1 for 1 (dashed lines), 3 (dotted lines), and 5 (solid lines) weeks and (2) at week 4 for 0.5 (dashed lines), 1.3 (dotted lines), and 2 (solid lines) weeks. The black dots in the top rows of switch plots indicate the three representative scenarios in (1) and the grey dots in the top rows of switch plots indicate the three representative scenarios in (2).
Fig. 5
Fig. 5
In silico model simulations of airway resistance for different rates of epithelial barrier repair. Dynamical responses (left) and long-term outcomes (right) in airway resistance for different initial times and durations of HDM exposure, and rate of epithelial barrier repair (faster in the direction of the arrow). Results for (a) the validated in silico model of the nominal virtual mouse and (b) the in silico model with modified parameters (an alternative virtual mouse, Figure S2). The grey shaded region indicates when HDM is present, with the corresponding initial HDM exposure and the duration shown as the black dot on the switch plots. The line colours in the dynamical plots correspond to the switch state regions in the switch plots, except the grey lines which correspond to the white region on the switch plots (for visibility). Slower repair refers to a reduced epithelial barrier repair rate (0.5x), optimised repair refers to the optimised epithelial barrier repair rate (1x), and faster repair refers to an increased epithelial barrier repair rate (1.5x).
Fig. 6
Fig. 6
In silico model simulations of airway resistance for different rates of immune maturation. Dynamical responses (left) and long-term outcomes (right) in airway resistance for different initial times and durations of HDM exposure, and rate of immune maturation (increases in the direction of the black arrows). Results for (a) the validated in silico model of the nominal virtual mouse and (b) the in silico model with modified parameters (an alternative virtual mouse, Figure S2). The grey shaded region indicates when HDM is present, with the corresponding initial HDM exposure and the duration shown as the black dot on the switch plots. The line colours in the dynamical plots correspond to the switch state regions in the switch plots, except the grey lines which correspond to the white region on the switch plots (for visibility). Impaired refers to a reduced immune maturation rate (0.75x), optimised refers to the optimised immune maturation rate (1x), and improved refers to an increased immune maturation rate (1.25x).

Similar articles

Cited by

References

    1. Song, P. et al. Global, regional, and national prevalence of asthma in 2019: A systematic analysis and modelling study. J. Glob. Health12 (2022). - PMC - PubMed
    1. Barnes, P. J. Immunology of asthma and chronic obstructive pulmonary disease. Nat. Rev. Immunol.8, 183–192 (2008). - PubMed
    1. Blease, K., Lukacs, N. W., Hogaboam, C. M. & Kunkel, S. L. Chemokines and their role in airway hyper-reactivity. Respir. Res.1, 54–61 (2000). - PMC - PubMed
    1. Belgrave, D. C. M. et al. Lung function trajectories from pre-school age to adulthood and their associations with early life factors: A retrospective analysis of three population-based birth cohort studies. Lancet Respir. Med.6, 526–534 (2018). - PubMed
    1. Oksel, C. et al. Distinguishing wheezing phenotypes from infancy to adolescence: A pooled analysis of five birth cohorts. Ann. Am. Thorac. Soc.16, 868–876 (2019). - PMC - PubMed

Publication types