. 2025 Jan 2;15(1):129.
doi: 10.1038/s41598-024-83742-4.

Multi-omic biomarker panel in pancreatic cyst fluid and serum predicts patients at a high risk of pancreatic cancer development

Affiliations

Multi-omic biomarker panel in pancreatic cyst fluid and serum predicts patients at a high risk of pancreatic cancer development

Laura E Kane et al. Sci Rep. .

Abstract

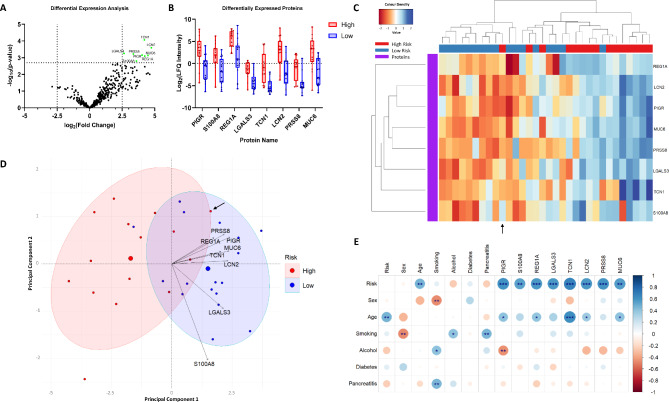
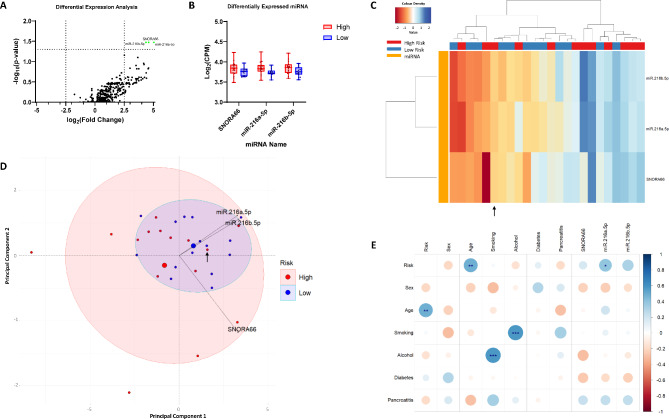
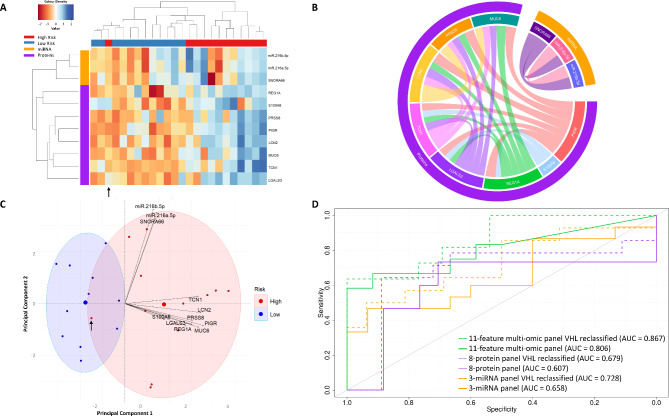
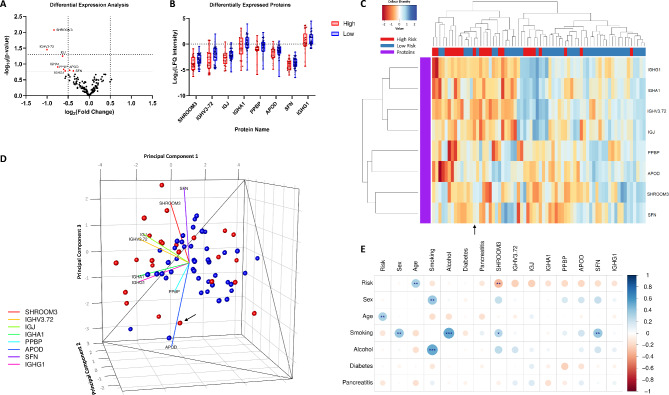
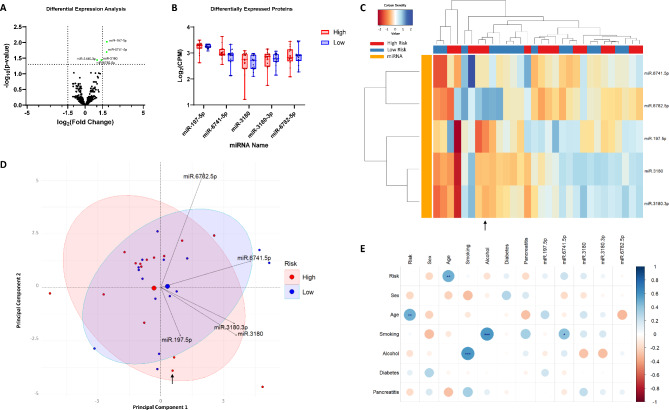
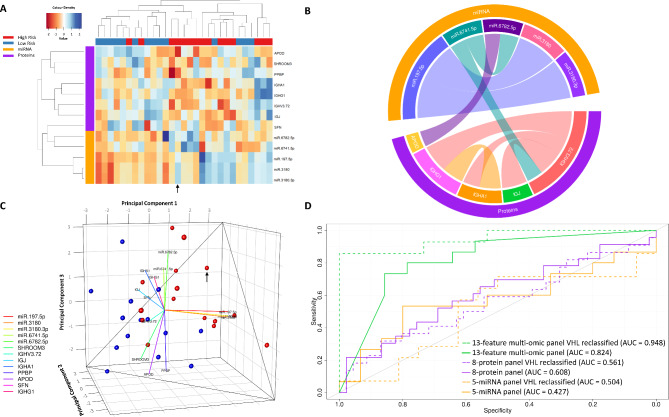
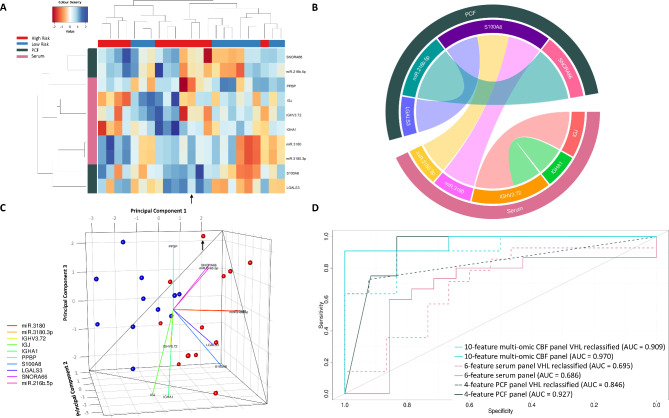
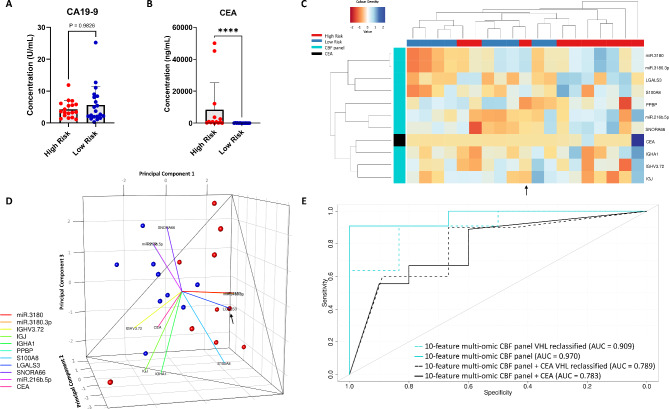
Integration of multi-omic data for the purposes of biomarker discovery can provide novel and robust panels across multiple biological compartments. Appropriate analytical methods are key to ensuring accurate and meaningful outputs in the multi-omic setting. Here, we extensively profile the proteome and transcriptome of patient pancreatic cyst fluid (PCF) (n = 32) and serum (n = 68), before integrating matched omic and biofluid data, to identify biomarkers of pancreatic cancer risk. Differential expression analysis, feature reduction, multi-omic data integration, unsupervised hierarchical clustering, principal component analysis, spearman correlations and leave-one-out cross-validation were performed using RStudio and CombiROC software. An 11-feature multi-omic panel in PCF [PIGR, S100A8, REG1A, LGALS3, TCN1, LCN2, PRSS8, MUC6, SNORA66, miR-216a-5p, miR-216b-5p] generated an AUC = 0.806. A 13-feature multi-omic panel in serum [SHROOM3, IGHV3-72, IGJ, IGHA1, PPBP, APOD, SFN, IGHG1, miR-197-5p, miR-6741-5p, miR-3180, miR-3180-3p, miR-6782-5p] produced an AUC = 0.824. Integration of the strongest performing biomarkers generated a 10-feature cross-biofluid multi-omic panel [S100A8, LGALS3, SNORA66, miR-216b-5p, IGHV3-72, IGJ, IGHA1, PPBP, miR-3180, miR-3180-3p] with an AUC = 0.970. Multi-omic profiling provides an abundance of potential biomarkers. Integration of data from different omic compartments, and across biofluids, produced a biomarker panel that performs with high accuracy, showing promise for the risk stratification of patients with pancreatic cystic lesions.

Keywords: Biomarker; Multi-omics; Pancreatic cancer; Pancreatic cystic lesion; Risk stratification.


Conflict of interest statement

Declarations. Competing interests: The authors declare no competing interests. Ethics approval and consent to participate: This work was performed in accordance with the Code of Ethics of the World Medical Association (Declaration of Helsinki) for experiments involving humans. Patients provided informed consent for sample and data acquisition, and the study received full ethical approval from Tallaght University Hospital Joint Research Ethics Committee Review Board (ID: 0319-264).

Figures

Fig. 1
Fig. 1
Proteomic analysis of PCF identifies eight proteins significantly upregulated in high-risk patients compared to low-risk patients. (A) Differential expression analysis identified eight proteins that were differentially expressed between low- and high-risk PCF samples (adj-p < 0.05, FDR = 0.05, s0 = 0.1). (B) Boxplots showing the distribution of patient expression levels for the eight differentially expressed proteins. (C) UHC of patients into high- and low-risk groups based on their expression of the eight differentially expressed proteins. Dendrograms show (top) the relatedness of the patients, and (left) the relatedness of the differentially expressed proteins. (D) 2D PCA using the eight differentially expressed proteins, with biplot overlayed. Ellipses represent 80% of the data captured within the two risk classifications. Biplot scale is set to zero to ensure vectors (arrows) are scaled to represent their respective loadings. The length of each vector is proportional to the variance of the corresponding protein. (E) Spearman correlations between patient clinical data and the eight differentially expressed proteins are given as a corrplot. Colour intensity relates to R value, circle size relates to the p-value (*p < 0.05, **p < 0.01, ***p < 0.001). Black arrows show the position of the VHL outlier patient.
Fig. 2
Fig. 2
Transcriptomic analysis of PCF identifies three miRNAs significantly upregulated in high-risk patients compared to low-risk patients. (A) Differential expression analysis identified three miRNAs that were differentially expressed between low- and high-risk PCF samples (adj-p < 0.05, FDR = 0.05, s0 = 0.1). (B) Boxplots showing the distribution of patient expression levels of the three differentially expressed miRNAs. (C) UHC of patients into high- and low-risk groups based on their expression of the three differentially expressed miRNAs. Dendrograms show (top) the relatedness of the patients, and (left) the relatedness of the miRNAs. (D) 2D PCA using the three differentially expressed miRNAs, with biplot overlayed. Ellipses represent 80% of the data captured within the two risk classifications. Biplot scale is set to zero to ensure vectors (arrows) are scaled to represent their respective loadings. The length of each vector is proportional to the variance of the corresponding miRNA. (E) Spearman correlations between patient clinical data and the three differentially expressed miRNAs are given as a corrplot. Colour intensity relates to R value, circle size relates to the p-value (*p < 0.05, **p < 0.01, ***p < 0.001). Black arrows show the position of the VHL outlier patient.
Fig. 3
Fig. 3
Integration of the differentially expressed proteins and miRNAs generates a robust 11-feature multi-omic biomarker panel in PCF. (A) UHC of patients into high- and low-risk groups based on their expression of the eight proteins and three miRNAs which form an 11-feature multi-omic panel. Dendrograms show (top) the relatedness of the patients, and (left) the relatedness of the differentially expressed proteins and miRNAs. (B) Chord diagram showing significant Spearman correlations (p < 0.05) between the eight differentially expressed proteins and three differentially expressed miRNAs. Inner chords reflect correlations between the biomarkers. Chord thickness is directly related to the strength of the correlation, with thicker chords indicating stronger correlations. (C) 2D PCA using this 11-feature multi-omic panel, with biplot overlayed. Ellipses represent 80% of the data captured within the two risk classifications. Biplot scale is set to zero to ensure vectors (arrows) are scaled to represent their respective loadings. The length of each vector is proportional to the variance of the corresponding protein or miRNA. (D) ROC curves generated from LOOCV of the miRNAs alone, the proteins alone, and the 11-feature multi-omic panel, as well as their performances when the VHL outlier patient is reclassified. Black arrows show the position of the VHL outlier patient.
Fig. 4
Fig. 4
Proteomic analysis of serum identifies eight proteins downregulated in high-risk patients compared to low-risk patients. (A) Differential expression analysis identified eight proteins that were differentially expressed between low- and high-risk serum samples. (B) Boxplots showing the distribution of patient expression levels for the eight differentially expressed proteins. (C) UHC of patients into high- and low-risk groups based on their expression of the eight differentially expressed proteins. Dendrograms show (top) the relatedness of the patients, and (left) the relatedness of the differentially expressed proteins. (D) 3D PCA using the eight differentially expressed proteins, with biplot overlayed. Biplot scale is set to zero to ensure vectors (arrows) are scaled to represent their respective loadings. The length of each vector is proportional to the variance of the corresponding protein. (E) Spearman correlations between patient clinical data and the eight differentially expressed proteins are given as a corrplot. Colour intensity relates to R value, circle size relates to the p-value (*p < 0.05, **p < 0.01, ***p < 0.001). Black arrows show the position of the VHL outlier patient.
Fig. 5
Fig. 5
Transcriptomic analysis of serum identifies five miRNAs significantly upregulated in high-risk patients compared to low-risk patients. (A) Differential expression analysis identified five miRNAs that were significantly differentially expressed between low- and high-risk serum samples (adj-p < 0.05, FDR = 0.05, s0 = 0.1). (B) Boxplots showing the distribution of patient expression levels of the five differentially expressed miRNAs. (C) UHC of patients into high- and low-risk groups based on their expression of the five differentially expressed miRNAs. Dendrograms show (top) the relatedness of the patients, and (left) the relatedness of the miRNAs. (D) 3D PCA using the five differentially expressed miRNAs, with biplot overlayed. Biplot scale is set to zero to ensure vectors (arrows) are scaled to represent their respective loadings. The length of each vector is proportional to the variance of the corresponding miRNA. (E) Spearman correlations between patient clinical data and the differentially expressed miRNA are given as a corrplot. Colour intensity relates to R value, circle size relates to the p-value (*p < 0.05, **p < 0.01, ***p < 0.001). Black arrows show the position of the VHL outlier patient.
Fig. 6
Fig. 6
Integration of the differentially expressed proteins and miRNAs generates a robust 13-feature multi-omic biomarker panel in serum. (A) UHC of patients into high- and low-risk groups based on their expression of the eight proteins and the five miRNAs identified as being differentially expressed, which form a 13-feature multi-omic panel. Dendrograms show (top) the relatedness of the patients, and (left) the relatedness of the miRNAs and proteins. (B) Chord diagram showing significant Spearman correlations (p < 0.05) between the eight differentially expressed proteins and five differentially expressed miRNAs. Inner chords reflect correlations between the biomarkers. Chord thickness is directly related to the strength of the correlation, with thicker chords indicating stronger correlations. (C) 3D PCA using the 13-feature multi-omic panel, with biplot overlayed. Biplot scale is set to zero to ensure vectors (arrows) are scaled to represent their respective loadings. The length of each vector is proportional to the variance of the corresponding protein or miRNA. (D) ROC curves generated from LOOCV of the miRNAs alone, the proteins alone, and the 13-feature multi-omic panel, as well as their performances when the VHL outlier patient is reclassified. Black arrows show the position of the VHL outlier patient.
Fig. 7
Fig. 7
Integration of the reduced PCF and serum panels generates a robust 10-feature multi-omic CBF biomarker panel. (A) UHC of patients into high- and low-risk groups based on their expression of the reduced serum panel and the reduced PCF panel. Dendrograms show (top) the relatedness of the patients, and (left) the relatedness of the biomarkers. (B) Chord diagram showing significant Spearman correlations (p < 0.05) between the serum biomarkers and PCF biomarkers. Inner chords reflect correlations between the biomarkers. Chord thickness is directly related to the strength of the correlation, with thicker chords indicating stronger correlations. (C) 3D PCA using this 10-feature multi-omic CBF panel, with biplot overlayed. Biplot scale is set to zero to ensure vectors (arrows) are scaled to represent their respective loadings. The length of each vector is proportional to the variance of the corresponding biomarker. (D) ROC curves generated from LOOCV of the reduced PCF panel alone, the reduced serum panel alone, and the 10-feature multi-omic CBF panel, as well as their performances when the VHL outlier patient is reclassified. Black arrows show the position of the VHL outlier patient.
Fig. 8
Fig. 8
Neither CA19-9 nor CEA improve the performance of the 10-feature multi-omic CBF panel. (A) Serum concentration of CA19-9 (U/mL) in high-risk (red) and low-risk (blue) patients. Mann–Whitney test. Data are presented as mean ± SEM. (B) PCF concentration of CEA (ng/mL) in high-risk (red) and low-risk (blue) patients. Mann–Whitney test. Data are presented as mean ± SEM, ****p < 0.0001. (C) UHC of patients into high-risk (red) and low-risk (blue) groups based on their expression of the 10-feature multi-omic CBF panel and CEA. Dendrograms show (top) the relatedness of the patients, and (left) the relatedness of the biomarkers. (D) 3D PCA using the 10-feature multi-omic CBF panel + CEA, with biplot overlayed. Biplot scale is set to zero to ensure vectors (arrows) are scaled to represent their respective loadings. The length of each vector is proportional to the variance of the corresponding biomarker. (E) ROC curves generated from LOOCV of the 10-feature multi-omic CBF panel (light blue lines), and the 10-feature multi-omic CBF panel + CEA (black), as well as their performances when the VHL outlier patient is reclassified (dashed lines). Black arrows show the position of the VHL outlier patient.

Similar articles

References

    1. Chen, C. et al. Applications of multi-omics analysis in human diseases. MedComm4(4), e315 (2023). - PMC - PubMed
    1. Vandereyken, K., Sifrim, A., Thienpont, B. & Voet, T. Methods and applications for single-cell and spatial multi-omics. Nat. Rev. Genet.24(8), 494–515 (2023). - PMC - PubMed
    1. Babu, M. & Snyder, M. Multi-omics profiling for health. Mol. Cell. Proteom.22(6), 100561 (2023). - PMC - PubMed
    1. Kane, L. E., Mellotte, G. S., Conlon, K. C., Ryan, B. M. & Maher, S. G. Multi-Omic biomarkers as potential tools for the characterisation of pancreatic cystic lesions and cancer: Innovative patient data integration. Cancers13(4), 769 (2021). - PMC - PubMed
    1. Siegel, R. L., Giaquinto, A. N. & Jemal, A. Cancer statistics, 2024. CA Cancer J. Clin.74(1), 12–49 (2024). - PubMed

Publication types