. 2025 Jan 2;15(1):361.
doi: 10.1038/s41598-024-82899-2.

Amblyopic binocular imbalance quantified by the dichoptic contrast ordering test and dichoptic letters test

Affiliations

Amblyopic binocular imbalance quantified by the dichoptic contrast ordering test and dichoptic letters test

Alexandre Reynaud et al. Sci Rep. .

Abstract

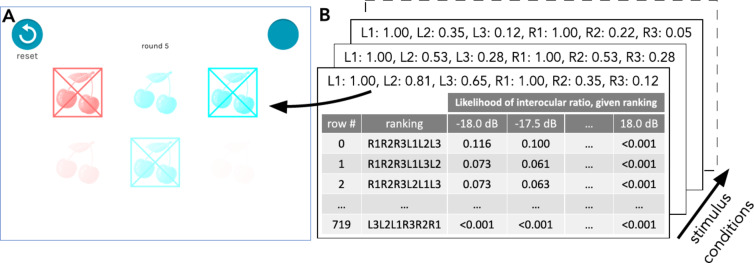
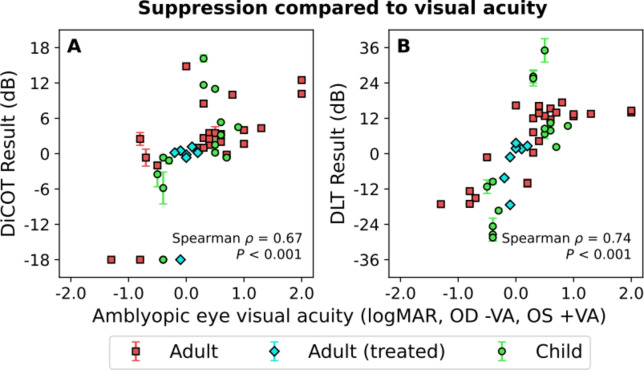
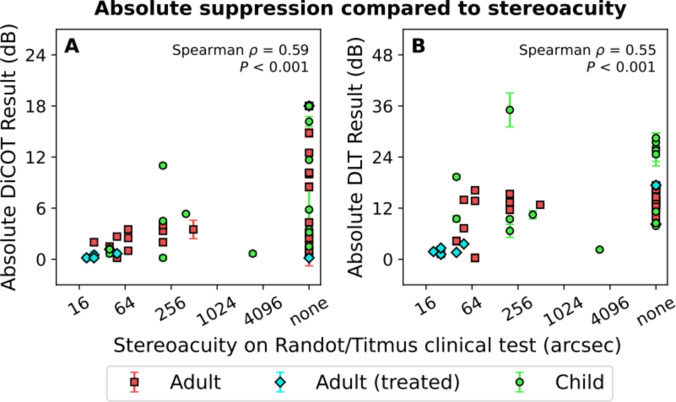
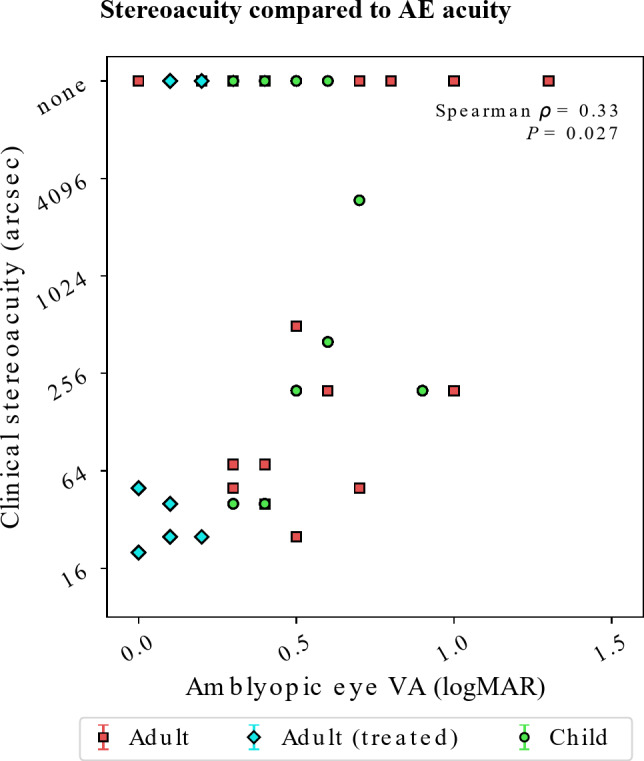
In amblyopia, abnormal binocular interactions lead to an overwhelming dominance of one eye. One mechanism implied in this imbalance is the suppression between the inputs from the two eyes. This interocular suppression involves two components: an overlay suppression and a surround suppression. Here, we propose a new method for measuring surround suppression which has been demonstrated in both strabismic and anisometropic amblyopes, based on a novel interocular contrast scaling task, suitable for use as a clinical tool. We compare the results obtained with this method against those from another method designed to measure overlay suppression: the Dichoptic Letter Test. We find a strong correlation between the results obtained with the two methods. Additionally, we observe strong correlations between the imbalance measured with the two tests and visual acuity and stereopsis. Altogether this suggests that amblyopic suppression is spatially broad and has direct relevance in global vision. So our new method is a relevant, clinically suitable tool to track the disease state in amblyopia.


Conflict of interest statement

Declarations. Competing interests: Authors ASB and RFH are inventors on a provisional patent application (U.S. Provisional Patent Application 63/511.359) that describes the inventive aspects of the DiCOT measurement tool. The study protocol was designed by the authors AR, ASB and RFH, and conducted by all authors at RI-MUHC; McGill University. Novartis Pharma AG (Basel) supported the study with funds under a research agreement entered into on March 31st, 2020, and terminated on March 31st, 2023.

Figures

Fig. 1
Fig. 1
Conditions for a single trial of the DiCOT. (A) Shows a screenshot of a trial where the left eye stimuli (in red for illustrative purposes) have contrasts of 100%, 35%, and 12% and the right eye stimuli (in green for illustrative purposes) have contrasts of 100%, 81%, and 65%. (B) Shows an illustration of the look-up tables (one per stimulus condition) which indicate the likelihood of the participant’s visual system being balanced by some interocular ratio parameter (from − 18 to + 18 dB) given the ranking given in response to that stimulus. Figure taken from Baldwin et al..
Fig. 2
Fig. 2
Test–retest reliability comparison of first and second measurements made with the DiCOT (top row) and DLT (bottom row). The panels on the left show scatter plots of retest vs. test measurement. The solid diagonal line is the line of equality (y = x). The panels on the right show Bland Altman plots of the difference against the mean. The three solid lines show the bias, and the limits of agreement. Shaded regions around those lines give the 95% confidence intervals. Positive and negative values refer to suppression on right and left eyes respectively.
Fig. 3
Fig. 3
Comparisons between DLT and DiCOT measurement results. Presentation is similar to that used in Fig. 2. (A) Shows a scatter plot with the ICCconsistency calculated as well as the linear regression between the two measures. Shaded purple area indicates 95% confidence interval. This regression is used to transform the DiCOT results to give the adjusted DiCOT in (B) that is put into better agreement with the DLT following the equation: Adjusted DiCOT = (DiCOT + 0.47)/0.45. (C) Shows the Bland Altman plot of the difference between the two measures plotted against the DLT result.
Fig. 4
Fig. 4
Relationship between amblyopic eye acuity and the two suppression measures. The two scatterplots show the average measurement from the DiCOT (A) and DLT (B) plotted against the logMAR acuity in the amblyopic eye. The sign of the acuity is flipped based on which eye is amblyopic. This makes values from the right eye negative (−VA) and from the left eye positive (+ VA). Different groups are plotted separately, however the Spearman rank correlation was calculated for the combined data.
Fig. 5
Fig. 5
Relationship between stereoacuity measured in a standard clinical test and the two suppression measures. The two scatterplots show the average absolute measurement from the DiCOT (A) and DLT (B) plotted against the stereoacuity. Different groups of amblyopic participants are plotted separately, however the Spearman rank correlation was calculated for the combined data. The 23/46 participants who were unable to perform the clinical stereo tests are indicated as having a value of “none”.
Fig. 6
Fig. 6
Relationship between stereoacuity measured in a standard clinical test and the visual acuity of the amblyopic eye.

References

    1. Li, J. et al. The role of suppression in amblyopia. Investig. Ophthal. Vis. Sci.52(7), 4167–4176 (2011). - PubMed
    1. McKee, S. P., Levi, D. M. & Movshon, J. A. The pattern of visual deficits in amblyopia. J. Vis.3(5), 380–405 (2003). - PubMed
    1. Hess, R. F. & Thompson, B. Amblyopia and the binocular approach to its therapy. Vis. Res.114, 4–16 (2015). - PubMed
    1. Mansouri, B., Thompson, B. & Hess, R. F. Measurement of suprathreshold binocular interactions in amblyopia. Vis. Res.48(28), 2775–2784 (2008). - PubMed
    1. Worth, C. A. Squint, Its Causes, Pathology and Treatment 6th edn (John Bale Sons and Danielsson, 1929).

LinkOut - more resources