. 2025 Jan 2;15(1):435.
doi: 10.1038/s41598-024-84704-6.

Protective effect of compound K against podocyte injury in chronic kidney disease by maintaining mitochondrial homeostasis

Affiliations

Protective effect of compound K against podocyte injury in chronic kidney disease by maintaining mitochondrial homeostasis

Fugang Huang et al. Sci Rep. .

Abstract

Chronic kidney disease (CKD) stands as a formidable global health challenge, often advancing to end-stage renal disease (ESRD) with devastating morbidity and mortality. At the central of this progression lies podocyte injury, a critical determinant of glomerular dysfunction. Compound K (CK), a bioactive metabolite derived from ginsenoside, has emerged as a compelling candidate for nephroprotective therapy. Here, we unveil the profound therapeutic potential of CK in a folic acid (FA)-induced CKD mouse model, demonstrating its ability to restore renal function and mitigate podocyte injury. CK exerted its nephroprotective effects by reinforcing inter-podocyte junctions, suppressing aberrant podocyte motility, and preventing podocyte detachment and apoptosis, thereby safeguarding the glomerular filtration barrier. Mechanistically, we identified mitochondrial dysregulation as a key driver of excessive oxidative stress, which is commonly associated with podocyte damage. CK remarkably restored mitochondrial homeostasis by attenuating pathological mitochondrial fission and enhancing mitophagy, thereby rebalancing the delicate mitochondrial network. Intriguingly, CK may disrupt the formation of the Drp1-Bax dimer, a crucial mediator of mitochondrial apoptosis, further averting podocyte loss. Collectively, our findings highlight CK as a potent nephroprotective agent, offering a novel therapeutic avenue for CKD management and redefining possibilities in the battle against progressive renal disease.

Keywords: Apoptosis; Chronic kidney disease; Compound K; Mitochondrial homeostasis; Podocyte Injury.


Conflict of interest statement

Declarations. Competing interests: The authors declare no competing interests. Declaration of competing interest: The authors declare that they have no conflicts of interest. Ethics statement: All experiments involving animals have been approved by the Institutional Animal Care and Use Committee of Zhejiang Chinese Medical University (the approval number of ethics committee: IACUC-20240429-16). All animal procedures were adhered to internationally accepted standards for animal research, following the 3Rs principle. The ARRIVE guidelines were employed for reporting experiments involving live animals, promoting ethical research practices.

Figures
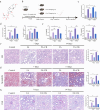
Fig. 1
Fig. 1
CK ameliorated renal injury in FA-induced mice. (a) Molecular structure of CK. (b) Schematic representation of the experimental design for animal studies. (cd) Levels of proteinuria, SCr, and BUN in the different groups. (e) Concentrations of circulating inflammatory factors, including IL-6, IL-1β, and TNF-α. (fh) Representative images of kidney sections stained with H&E, Masson’s trichrome, and PAS to assess renal histopathology (scale bars: 100 μm for H&E and Masson’s trichrome, 50 μm for PAS), with corresponding quantitative analysis. Data are expressed as mean ± SD. Statistical significance is indicated as *P < 0.05, **P < 0.01 versus 7-day FA group; #P < 0.05, ##P < 0.01 versus 14-day FA group. Abbreviation: IL-6, interleukin-6; IL-1β, interleukin-1 beta; TNF-α, tumor necrosis factor-alpha.
Fig. 2
Fig. 2
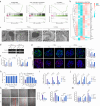
CK alleviated podocyte injury and motility impairment. (a) Gene Set Enrichment Analysis (GSEA) plots: Left panel represents lamellipodium-related pathways, middle panel shows actin cytoskeleton organization, and right panel depicts cell motility. (b) Heatmap of actin cytoskeleton-related genes across experimental groups. (c) Microstructure of FPs visualized by transmission electron microscopy (TEM) (scale bars: 1 μm). (df) Western blot analysis with corresponding quantifications showing Nephrin and Synaptopodin expression in renal cortical samples; (e) depicts results at 7 days and (f) at 14 days. (g) Immunofluorescence staining of Nephrin and Synaptopodin in glomeruli, demonstrating protein localization and distribution (scale bars: 5 μm), with corresponding quantitative analysis. (h) Cell viability of podocytes treated with CK, with or without LPS stimulation, assessed quantitatively. (i) Transcription levels of pro-inflammatory cytokines IL-6, IL-1β, and TNF-α. (j) Transcription levels of SYNPO, Npsh1, and Npsh2. (k) Cell migration visualized by scratch assay, with quantification of wound area coverage after injury. (lm) Transcription levels of RhoA, Myo9A, Cfl1, Ssh1, and Limk1 in MPC-5 cells stimulated by LPS. Data are presented as mean ± SD. Statistical significance is indicated as *P < 0.05, **P < 0.01 versus the 7-day FA group; #P < 0.05, ##P < 0.01 versus the 14-day FA group. For in vitro experiments, *P < 0.05, **P < 0.01 versus the LPS-treated group.
Fig. 3
Fig. 3
CK protects against podocyte apoptosis and preserves mitochondrial integrity compromised by oxidative stress. (a) GSEA plots depicting pathways related to apoptosis. (b) Heatmap illustrating the expression of apoptosis-related genes. (c) TUNEL assay images demonstrating apoptotic cells across different groups (scale bars: 100 μm). (d) Western blot analysis with corresponding quantification showing Bax and cleaved caspase-3 expression levels in renal cortical samples; (e) depicts results at day 7, and (f) at day 14. (g) GSEA plots illustrating pathways associated with antioxidant activity. (h) Heatmap of redox-related gene expression across groups. (i) Intracellular levels of MDA and SOD activity. (j) GSEA plots for genes involved in the response to ROS. (k) Heatmap showing the expression of ROS-responsive genes. (l,m) Representative images of ROS staining, with green fluorescence indicating the presence and distribution of ROS (scale bars: 50 μm). (n,o) JC-1 staining images depicting alterations in ΔΨm (scale bars: 5 μm). Green fluorescence represents JC-1 monomers, indicative of low membrane potential, while red fluorescence represents JC-1 aggregates, indicative of high membrane potential. Quantification was performed based on the ratio of red to green fluorescence. Data are presented as mean ± SD. Statistical significance is indicated as *P < 0.05, **P < 0.01 versus the 7-day FA group; #P < 0.05, ##P < 0.01 versus the 14-day FA group. For in vitro experiments, *P < 0.05, **P < 0.01 versus the LPS-treated group.
Fig. 4
Fig. 4
CK modulates mitochondrial dynamics to alleviate podocyte injury. (a) GSEA plots depicting mitochondrial-related pathways, including mitochondrial organization, membrane integrity, fission, and fusion. (b) Heatmap illustrating the expression levels of genes associated with mitochondrial dynamics across experimental groups. (c) Representative images of mitochondrial morphology stained under different treatments (scale bar: 5 μm), with corresponding quantification of mitochondrial aspect ratio. (d) Molecular docking analysis of Drp1 and CK. (e) Western blot analysis of p-Drp1 Ser616, indicating mitochondrial fission activity, with quantification for both day 7 and day 14. (f) Relative mRNA levels of Fis1 in different groups. (g) Immunofluorescence staining of Mfn2 with corresponding quantification of expression levels (scale bar: 5 μm). (h) Structural interaction analysis of Drp1 and Bax, depicting key binding residues (e.g., Arg409, Arg645, Glu69, Ser72). (i) Immunofluorescence staining of Drp1 and Bax in glomeruli (scale bar: 5 μm), demonstrating their co-localization and relative expression, accompanied by line profile plots and quantification of co-localization. (j) Representative images of podocytes showing co-localization of Drp1 (green) and Bax (red) under different conditions (scale bar: 10 μm), with line profile plots and co-localization quantification. Data are expressed as mean ± SD. Statistical significance is indicated as *P < 0.05, **P < 0.01 versus the 7-day FA group; #P < 0.05, ##P < 0.01 versus the 14-day FA group. For in vitro experiments, *P < 0.05, **P < 0.01 versus the LPS-treated group.
Fig. 5
Fig. 5
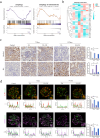
CK modulated autophagy and mitophagy. (a) GSEA plots showing pathways related to autophagy and autophagy of mitochondria. (b) Heatmap depicting the expression profiles of mitophagy-related genes across experimental groups. (c) Immunohistochemical staining of Beclin-1 and p62, which are key autophagy markers (scale bar: 50 μm), along with quantification of integrated optical density (IOD) to reflect changes in autophagic activity. (d) Immunofluorescence staining of LC3B and Lamp1 (top row), as well as TOM20 and Lamp1 (bottom row), in glomeruli at both 7-day and 14-day time points (scale bar: 5 μm). Line profile plots represent the degree of co-localization, highlighting autophagosome formation (top) and mitophagy-related alterations (bottom). Corresponding quantitative analysis of fluorescence intensity overlap is shown on the right. Data are expressed as mean ± SD. Statistical significance is indicated by *P < 0.05, **P < 0.01 versus the 7-day FA groups; #P < 0.05, ##P < 0.01 versus the 14-day FA groups.
Fig. 6
Fig. 6
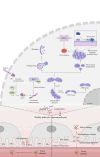
Diagram illustrating an underlying mechanism of the potential therapeutic effect of CK against CKD.

Similar articles

Cited by

References

    1. Li, Q. et al. Mitochondrial targeting of herbal medicine in chronic kidney disease. Front. Pharmacol.12, 632388. 10.3389/fphar.2021.632388 (2021). - PMC - PubMed
    1. Yeh, T. H. et al. From acute to chronic: Unraveling the pathophysiological mechanisms of the progression from acute kidney injury to acute kidney disease to chronic kidney disease. Int. J. Mol. Sci.25, 1755. 10.3390/ijms25031755 (2024). - PMC - PubMed
    1. André, C. et al. The AKI-to-CKD transition: The role of uremic toxins. Int. J. Mol. Sci. 24, 16152. 10.3390/ijms242216152 (2023). - PMC - PubMed
    1. Tamargo, C. et al. Treatment of acute kidney injury: A review of current approaches and emerging innovations. J. Clin. Med.13, 2455. 10.3390/jcm13092455 (2024). - PMC - PubMed
    1. Gameiro, J. et al. Acute kidney injury: From diagnosis to prevention and treatment strategies. J. Clin. Med.9, 1704. 10.3390/jcm9061704 (2020). - PMC - PubMed

Publication types

MeSH terms