. 2025 Jan;15(1):e70162.
doi: 10.1002/ctm2.70162.

A new peptide inhibitor of C1QBP exhibits potent anti-tumour activity against triple negative breast cancer by impairing mitochondrial function and suppressing homologous recombination repair

Affiliations

A new peptide inhibitor of C1QBP exhibits potent anti-tumour activity against triple negative breast cancer by impairing mitochondrial function and suppressing homologous recombination repair

Xingxing Li et al. Clin Transl Med. 2025 Jan.

Abstract

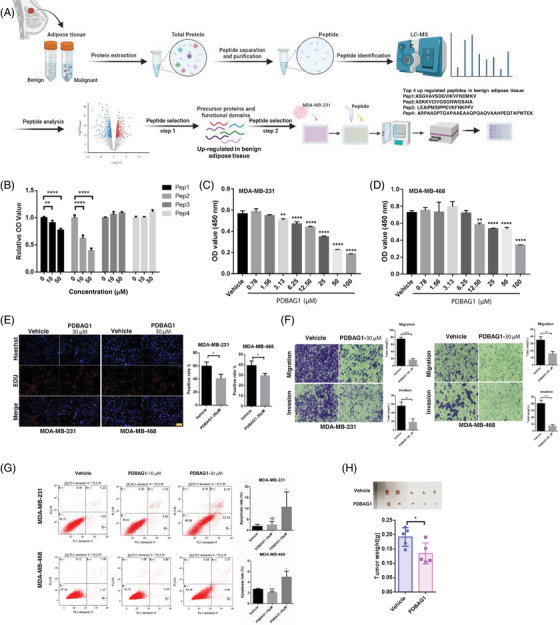
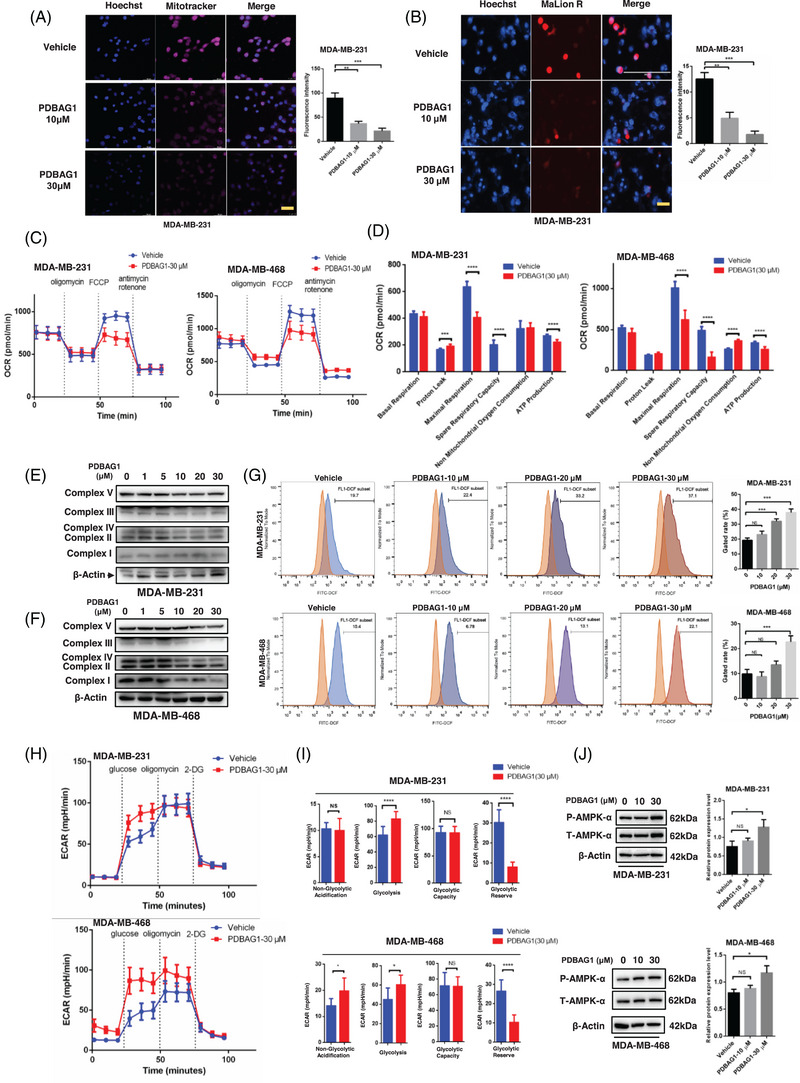
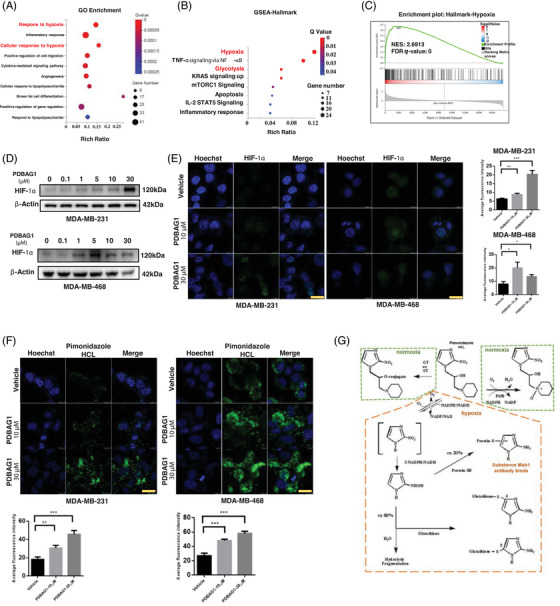
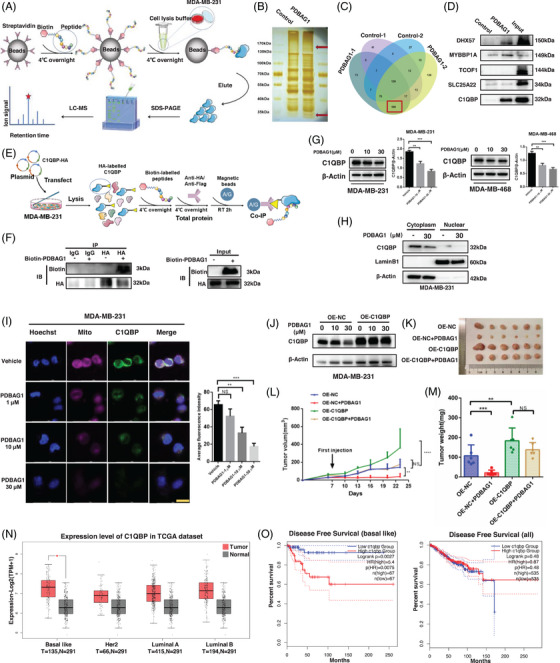
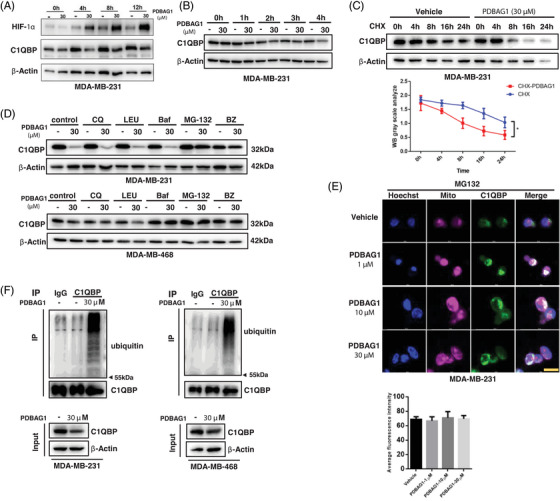
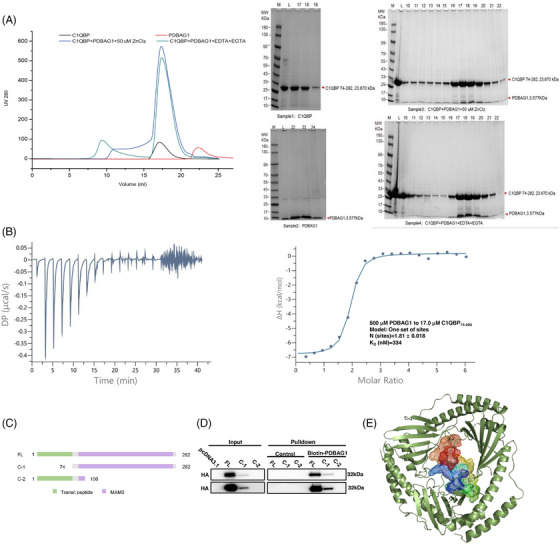
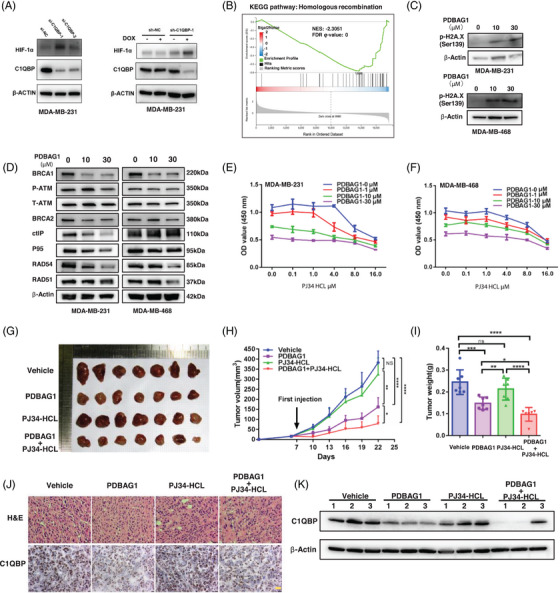
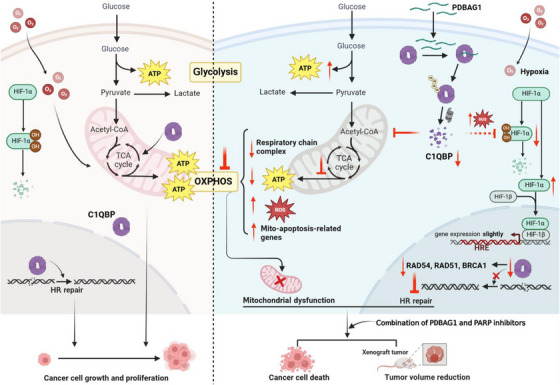
C1QBP exhibits heightened expression across a spectrum of tumours, thereby fostering their proliferation and metastasis, rendering it a pivotal therapeutic target. Nevertheless, to date, no pharmacological agents capable of directly targeting and inducing the degradation of C1QBP have been identified. In this study, we have unveiled a new peptide, PDBAG1, derived from the precursor protein GPD1, employing a peptidomics-based drug screening strategy. PDBAG1 has demonstrated substantial efficacy in suppressing triple-negative breast cancer (TNBC) both in vitro and in vivo. Its mechanism of action involves mitochondrial impairment and the inhibition of oxidative phosphorylation (OXPHOS), achieved through direct binding to C1QBP, thereby promoting its ubiquitin-dependent degradation. Concomitantly, due to metabolic adaptability, we have observed an up-regulation of glycolysis to compensate for OXPHOS inhibition. We observed an aberrant phenomenon wherein the hypoxia signalling pathway in tumour cells exhibited significant activation under normoxic conditions following PDBAG1 treatment. Through size-exclusion chromatography (SEC) and isothermal titration calorimetry (ITC) assays, we have validated that PDBAG1 is capable of binding C1QBP with a Kd value of 334 nM. Furthermore, PDBAG1 inhibits homologous recombination repair proteins and facilitates synergism with poly-ADP-ribose polymerase inhibitors in cancer therapy. This underscores that PDBAG1 ultimately induces insurmountable survival stress through multiple mechanisms while concurrently engendering therapeutic vulnerabilities specific to TNBC. KEY POINTS: The newly discovered peptide PDBAG1 is the first small molecule substance found to directly target and degrade C1QBP, demonstrating significant tumour inhibitory effects and therapeutic potential.

Keywords: C1QBP; anti‐tumour peptide; homologous recombination repair; mitochondrial function; targeted protein degradation.


Conflict of interest statement

The authors have no conflicts of interest to declare.

Figures

FIGURE 1
FIGURE 1
New peptide PDBAG1 exhibits inhibition function in TNBC in vitro and in vivo. (A) Schematic diagram of the screening process of endogenous anti‐tumour peptide PDBAG1. (B) Relative OD values were detected after 48 h of treatment with different concentrations of four peptides in MDA‐MB‐231cells (n = 4). **p < .01, ****p < .0001, compared with vehicle group. (C and D) OD values were detected after 48 h of treatment with different concentrations of PDBAG1 in MDA‐MB‐231and MDA‐MB‐468 cells (n = 4). *p < .05, **p < .01, ****p < .0001, compared with vehicle group. (E) The cell EdU positive rate was detected in MDA‐MB‐231 and MDA‐MB‐468 cells after cultured with different concentrations of PDBAG1 for 48 h. Scale bar, 50 µm. (F) Transwell assay was performed on MDA‐MB‐231 and MDA‐MB‐468 cells lines after PDBAG1(30 µM) treatments. (G) Cell death was performed and quantified by fluorescence‐activated cell sorter (FACS) analysis on MDA‐MB‐231 and MDA‐MB‐468 cells that stained annexin V/PI after 24 h PDBAG1(30 µM) treatments. *p < .05, compared with vehicle group. (H) The photo of xenografted mice model treated with PDBAG1 every 2 days and the tumour weights were measured in each group after sacrifice of xenograft mice at the 21th day. n = 5. *p < .05, **< .01, ****< .0001, compared with vehicle group; Student's t‐test. Error bars, mean ± SD.
FIGURE 2
FIGURE 2
PDBAG1 induces mitochondria dysfunction and oxidative phosphorylation inhibition in TNBC cells. (A) Changes in mitochondrial mass (mitotracker) after PDBAG1 treatment were assessed by confocal microscopy (Leica STELLARIS STED). Quantification from three independent experiments is presented as histograms. Magnification: 40×, scale bar: 50 µm (**< .01, ***p < .001). (B) The cellular ATP levels were measured in MDA‐MB‐231 cells following treatment with vehicle and PDBAG1, using the MalionR ATP sensor. Quantification from three independent experiments is presented as histograms. Magnification: 40×, scale bar, 50 µm (EVOS FL AUTO, Life, **< .01, ***p < .001). (C and D) Seahorse XF24 was used to detect mitochondrial stress after PDBAG1 treatment on MDA‐MB‐231 and MDA‐MB‐468 cells, the basal respiration, proton Leak, maximal respiration, spare respiratory capacity, non‐mitochondrial oxygen consumption, ATP production in each group were measured (***p < .001, ****p < .0001, compared with vehicle group; Student's t‐test. Error bars, mean ± SD, MDA‐MB‐231 n = 12 and MDA‐MB‐468 n = 9). (E and F) Protein levels of mitochondrial complexes after treatment with different concentrations of PDBAG1 in TNBC cell lines were detected by immunoblotting. (G) Intracellular ROS levels were detected by flow cytometry after PDBAG1 treatment of TNBC cells for 24 h. A bar graph shows the percentage of gated cells, quantifying ROS levels across treatment groups (***p < .001, compared with vehicle group; Student's t‐test. Error bars, mean ± SD, n = 3). (H and I) Seahorse XF24 was used to detect glycolytic stress after PDBAG1 treatment on TNBC cell lines, the non‐glycolytic acidification, glycolysis, glycolytic capacity, glycolytic reserve in each group were measured (NS, non‐significant, *p < .01, ****p < .0001, compared with vehicle group; two‐way ANOVA test. Error bars, mean ± SD, n = 12). (J) Western blot analysis was employed to assess alterations in AMPK phosphorylation levels within TNBC cells following a 24‐h treatment with PDBAG1.
FIGURE 3
FIGURE 3
PDBAG1 induces hypoxia, promotes glycolysis in TNBC cells. (A and B) GO enrichment analysis and GSEA analysis were performed by GOseq on differential expressed genes (foldchange ≥1.5) between vehicle and PDBAG1 treated samples (n = 3). (C) GSEA enrichment analysis in Hallmark dataset of hypoxia (NES = 2.6913, FDR q value = 0). (D) HIF‐1α level was detected by immunoblotting after treated with different concentrations of PDBAG1. (E) Immunofluorescence was used to detect the expression of HIF‐1α in TNBC cells treated with PDBAG1. Quantification from three independent experiments is presented as histograms. Magnification: 40×, scale bar, 20 µm (Leica STELLARIS STED). (F) Extent of intracellular hypoxia was detected by using hypoxy probe after PDBAG1 treatment. Quantification from three independent experiments is presented as histograms. Magnification: 40×, scale bar, 20 µm (Leica STELLARIS STED). (G) Schematic illustration depicting the operational principle of hypoxy probe (pimonidazole HCL), which can undergo a reaction with sulphide under hypoxic conditions to generate an adduct capable of binding monoclonal antibodies.
FIGURE 4
FIGURE 4
PDBAG1 inhibits TNBC by direct target and decrease C1QBP at protein level. (A) Schematic diagram of the biotin‐labelled PDBAG1 pull down assay. (B and C) The silver staining gel picture and mass spectrometry results of the pulldown assay. (D) Pulldown experiment to verify the top five high abundant proteins bound by PDBAG1. (E and F) Schematic diagram and the results of the co‐IP assay (HA‐tagged C1QBP were used as bait, and biotin‐labelled PDBAG1 was added to the protein lysate). (G and H) Protein level of C1QBP was tested in TNBC cell lines after treated with PDBAG1 and change of C1QBP in the cytoplasm and nucleus of MDA‐MB‐231 cells after treated with PDBAG1. (I) 24 h after MDA‐MB‐231 cells were treated with PDBAG1, the intracellular fluorescence intensity and distribution of C1QBP and mitotracker (Thermo Fisher) were detected by immunofluorescence. Quantification of C1QBP from three independent experiments is presented as histograms. Magnification: 40×, Scale bar, 20 µm (Leica STELLARIS STED). (J) Stable overexpression C1QBP MDA‐MB‐231 cell lines were constructed to detect C1QBP protein level after treated with PDBAG1. (K, L and M) Stable overexpression tumour cells were inoculated into nude mice for tumourigenic model experiments (n = 6 mice in each group) were constructed, after treated with vehicle or PDBAG1 the effects were shown on tumour image, tumour volume and tumour weight were examined (NS, non‐significant, *p < .05, **p < .01, ***p < .001; two‐way ANOVA test. Error bars, mean ± SD, n = 6). (N and O) The expression levels of C1QBP in different subtypes of breast cancer in the TCGA database and the effect of high expression of C1QBP on DFS of patients with all types of breast cancer and triple negative breast cancer (GEPIA2, http://gepia2.cancer‐pku.cn).
FIGURE 5
FIGURE 5
PDBAG1 promotes ubiquitin‐dependent degradation of C1QBP. (A) The protein level of C1QBP and HIF‐1α were assessed by immunoblotting in TNBC cells after treated with PDBAG1 within 12 h. (B) C1QBP protein level was assessed by immunoblotting after treated with PDBAG1 within 4 h. (C) The degradation speed of C1QBP protein was performed with protein extracted at 0, 4, 8, 16 and 24 h after treatment of MDA‐MB‐231 cells with cycloheximide (CHX) and PDBAG1. (D) Treating TNBC cells with inhibitors of different protein degradation associated pathways stacked with PDBAG1, the ubiquitin–proteasome pathway inhibitors MG‐132 and BZ could reverse the decrease in C1QBP protein level (long expose) caused by PDBAG1 (CQ, chloroquine; LEU, leupeptin hemisulphate; Baf, bafilomycin A1; BZ, bortezomib). (E) 24 h after MDA‐MB‐231 cells were treated with PDBAG1 and MG132, the intracellular fluorescence intensity and distribution of C1QBP and mitotracker (thermos fisher) were detected by immunofluorescence. Quantification from three independent experiments is presented as histograms. Magnification: 40×, Scale bar, 20 µm (Leica STELLARIS STED). (F) The impact of PDBAG1 treatment on C1QBP ubiquitination was assessed over a 12‐h period using co‐immunoprecipitation (co‐IP) assays. Results demonstrate a significant enhancement of C1QBP ubiquitination upon exposure to PDBAG1.
FIGURE 6
FIGURE 6
PDBAG1 directly binds to C1QBP protein. (A) Gel filtration elution profiles for PDBAG1 (red), C1QBP (black), PDBAG1+C1QBP (green) and PDBAG1+C1QBP+ZnCL2 (blue) are shown on the left(C1QBP to PDBAG1 ratio = 1:1.2), and Coomassie‐stained SDS‐PAGE gels of the fractions collected are shown on the right. Co‐elution of C1QBP and PDBAG1 complexes was detected, indicating the presence of binding of C1QBP and PDBAG1, while addition of EDTA and EGTA without Zn2+ had the same phenomenon, suggesting that binding may not be metal ion‐dependent. (B) Isothermal titration calorimetry (ITC) of peptide (500 µM) into C1QBP74–282 (17.0 µM) in 20 mM potassium phosphate, 100 mM NaCl, pH 7.4. It was showed that the experimentally derived curve with raw heat rate/μcal s−1 versus time/min (left) and the calculated binding isotherm with change in enthalpy/kcal mol−1 versus C1QBP74–282–PDBAG1 molar ratio (right, K = 334 nM). (C and D) Schematic diagram of the construction of the truncated form of C1QBP and the results of pulldown experiments between PDBAG1 and C1QBP truncated forms. (E) Molecular docking model of C1QBP (PDB: 1P32) and PDBAG1.
FIGURE 7
FIGURE 7
PDBAG1 suppresses homologous recombination repair and induces PARP inhibitor sensitivity in vitro and in vivo. (A) The changes in HIF‐1α protein were observed by Western blot analysis following both transient and long‐term C1QBP knockdown. (B) GSEA enrichment analysis results in KEGG‐pathway dataset of homologous recombination (NES = −2.3051, FDR q value = 0). (C) The protein level of phospho‐H2A.X(Ser139) after treated with PDBAG1 in TNBC cell lines. (D) Expression of homologous recombination pathway related proteins after PDBAG1 treatment for 24 h on TNBC cell lines. (E and F) TNBC cells were treated with corresponding concentrations of PDBAG1 and PJ34‐HCL for 24 h in MDA‐MB‐231 and MDA‐MB‐468 cells, and the OD value of the treated cells was measured by CCK8 method. (G, H and I) Using vehicle, PDBAG1, PJ34‐HCL and PDBAG1 combined with PJ34‐HCL administration in nude mice tumourigenic model experiments (n = 7 mice in each group), the effects of these administrations on tumour image, tumour volume and tumour weight were examined (NS, non‐significant, *< .01, **< .001, ***< .0001, ****< .00001, two‐way ANOVA test. Error bars, mean ± SD, n = 7). (J and K) The expression of C1QBP in nude mice tumourigenic model after administration was detected by immunohistochemistry and western blot, Magnification: 20×, Scale bar, 20 µm.
FIGURE 8
FIGURE 8
Schematic diagram of the mechanism of PDBAG1 acting on breast cancer cells (Created with BioRender.com).

Similar articles

References

    1. Bianchini G, Balko JM, Mayer IA, Sanders ME, Gianni L. Triple‐negative breast cancer: challenges and opportunities of a heterogeneous disease. Nat Rev Clin Oncol. 2016;13(11):674‐690. doi:10.1038/nrclinonc.2016.66 - DOI - PMC - PubMed
    1. Foulkes WD, Smith IE, Reis‐Filho JS. Triple‐negative breast cancer. N Engl J Med. 2010;363(20):1938‐1948. doi:10.1056/NEJMra1001389 - DOI - PubMed
    1. Ghebrehiwet B, Geisbrecht BV, Xu X, Savitt AG, Peerschke EIB. The C1q receptors: focus on gC1qR/p33 (C1qBP, p32, HABP‐1)(1). Semin Immunol. 2019;45:101338. doi:10.1016/j.smim.2019.101338 - DOI - PubMed
    1. Gotoh K, Morisaki T, Setoyama D, et al. Mitochondrial p32/C1qbp is a critical regulator of dendritic cell metabolism and maturation. Cell Rep. 2018;25(7):1800‐1815. e4. doi:10.1016/j.celrep.2018.10.057 - DOI - PubMed
    1. Lei Y, Li X, Qin D, Zhang Y, Wang Y. gC1qR: a new target for cancer immunotherapy. Front Immunol. 2023;14:1095943. doi:10.3389/fimmu.2023.1095943 - DOI - PMC - PubMed