Completeness and quality of comprehensive managed care data compared with fee-for-service data in national Medicaid claims from 2001 to 2019
- PMID: 39748217
- PMCID: PMC12120513
- DOI: 10.1111/1475-6773.14429
Completeness and quality of comprehensive managed care data compared with fee-for-service data in national Medicaid claims from 2001 to 2019
Abstract
Objective: To evaluate the completeness and quality of Medicaid comprehensive managed care (CMC) data in national MAX/TAF research files.
Study setting and design: This observational study compared CMC with fee-for-service (FFS) enrollee data in 2001-2019 Medicaid MAX/TAF inpatient, outpatient, and pharmacy files. Completeness was assessed as the proportion of enrollees with any claim and mean claims per enrollee with any claim. Quality was assessed as the proportion of inpatient and outpatient claims with primary diagnosis and procedure codes and the proportion of prescription drug claims with fill dates, National Drug Codes (NDC), days supplied, and quantity dispensed. Acceptable ranges for each study measure were defined as the national FFS mean ± 2 standard deviations.
Data sources and analytic sample: We analyzed secondary data on 45 states from 2001 to 2013 (MAX) and 50 states and DC from 2014 to 2019 (TAF). The sample included adults aged 18-64 with continuous calendar-year enrollment who were eligible for full Medicaid benefits and ineligible for Medicare. We determined CMC enrollment rates and assessed data completeness and quality among state-years with ≥10% CMC penetration, comparing CMC with FFS enrollees.
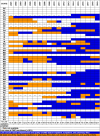
Principal findings: Across 891 state-years, 194,364,647 enrollees met inclusion criteria. Of 540 state-years (60.6%) with ≥10% CMC enrollment, CMC data were largely comparable to national FFS distributions for all inpatient (n = 430; 79.6%), outpatient (n = 467, 86.5%), and prescription (n = 459, 85.0%) completeness criteria and for all inpatient (n = 449, 83.1%), outpatient (n = 511, 94.6%), and prescription (n = 528, 97.8%) quality criteria. Overall completeness (92.3%) and quality (84.6%) improved substantially by 2019.
Conclusions: Completeness and quality of CMC data were largely comparable to FFS data, with increasing state-years meeting criteria over time. Further research on national Medicaid populations should assess and address differences in data completeness and quality by plan type across states, over time, and in relation to specific study samples and measures of interest.
Keywords: Medicaid; data accuracy; data quality; fee‐for‐service plans; managed care programs.
© 2025 The Author(s). Health Services Research published by Wiley Periodicals LLC on behalf of Health Research and Educational Trust.
Conflict of interest statement
HS has received consulting fees from The Pew Charitable Trusts and the American Society of Addiction Medicine unrelated to this work.
Figures


Similar articles
-
Completeness and Quality of Data for Children in Medicaid Comprehensive Managed Care Compared to Fee-for-Service, 2001-2019.Health Serv Res. 2025 Jun 4:e14651. doi: 10.1111/1475-6773.14651. Online ahead of print. Health Serv Res. 2025. PMID: 40464879
-
Internal validation of Medicaid Analytic eXtract (MAX) data capture for comprehensive managed care plan enrollees from 2007 to 2010.Pharmacoepidemiol Drug Saf. 2018 Oct;27(10):1067-1076. doi: 10.1002/pds.4365. Epub 2017 Dec 6. Pharmacoepidemiol Drug Saf. 2018. PMID: 29210142
-
Usability of encounter data for Medicaid comprehensive managed care vs traditional Medicaid fee-for-service claims among pregnant women.Pharmacoepidemiol Drug Saf. 2020 Jan;29(1):30-38. doi: 10.1002/pds.4923. Epub 2019 Nov 18. Pharmacoepidemiol Drug Saf. 2020. PMID: 31737976
-
Assessing the usability of MAX 2008 encounter data for comprehensive managed care.Medicare Medicaid Res Rev. 2013 Mar 28;3(1):mmrr.003.01.b01. doi: 10.5600/mmrr.003.01.b01. eCollection 2013. Medicare Medicaid Res Rev. 2013. PMID: 24753961 Free PMC article.
-
Payment methods for healthcare providers working in outpatient healthcare settings.Cochrane Database Syst Rev. 2021 Jan 20;1(1):CD011865. doi: 10.1002/14651858.CD011865.pub2. Cochrane Database Syst Rev. 2021. PMID: 33469932 Free PMC article.
References
-
- Centers for Medicare & Medicaid Services . Section 1915(c) waiver program participants in 2020. Medicaid Data Brief. Accessed April 15, 2024. https://www.medicaid.gov/medicaid/data-and-systems/downloads/macbis/sctn...
Publication types
MeSH terms
Grants and funding
LinkOut - more resources
Full Text Sources
Medical
Miscellaneous

